P = −3.00 D has the same effect on vision as reducing the power of the eye itself by 3.00 D. So to correct the eye for nearsightedness, the cornea
is flattened to reduce its power. Similarly, to correct for farsightedness, the curvature of the cornea is enhanced to increase the power of the eye—the
same effect as the positive power spectacle lens used for farsightedness. Laser vision correction uses high intensity electromagnetic radiation to
ablate (to remove material from the surface) and reshape the corneal surfaces.
Today, the most commonly used laser vision correction procedure is Laser in situ Keratomileusis (LASIK). The top layer of the cornea is surgically
peeled back and the underlying tissue ablated by multiple bursts of finely controlled ultraviolet radiation produced by an excimer laser. Lasers are
used because they not only produce well-focused intense light, but they also emit very pure wavelength electromagnetic radiation that can be
controlled more accurately than mixed wavelength light. The 193 nm wavelength UV commonly used is extremely and strongly absorbed by corneal
tissue, allowing precise evaporation of very thin layers. A computer controlled program applies more bursts, usually at a rate of 10 per second, to the
areas that require deeper removal. Typically a spot less than 1 mm in diameter and about 0.3 μm in thickness is removed by each burst.
Nearsightedness, farsightedness, and astigmatism can be corrected with an accuracy that produces normal distant vision in more than 90% of the
patients, in many cases right away. The corneal flap is replaced; healing takes place rapidly and is nearly painless. More than 1 million Americans per
year undergo LASIK (see Figure 26.9).
Figure 26.9 Laser vision correction is being performed using the LASIK procedure. Reshaping of the cornea by laser ablation is based on a careful assessment of the patient’s
vision and is computer controlled. The upper corneal layer is temporarily peeled back and minimally disturbed in LASIK, providing for more rapid and less painful healing of the
less sensitive tissues below. (credit: U.S. Navy photo by Mass Communication Specialist 1st Class Brien Aho)
26.3 Color and Color Vision
The gift of vision is made richer by the existence of color. Objects and lights abound with thousands of hues that stimulate our eyes, brains, and
emotions. Two basic questions are addressed in this brief treatment—what does color mean in scientific terms, and how do we, as humans, perceive
it?
Simple Theory of Color Vision
We have already noted that color is associated with the wavelength of visible electromagnetic radiation. When our eyes receive pure-wavelength
light, we tend to see only a few colors. Six of these (most often listed) are red, orange, yellow, green, blue, and violet. These are the rainbow of colors
CHAPTER 26 | VISION AND OPTICAL INSTRUMENTS 939
produced when white light is dispersed according to different wavelengths. There are thousands of other hues that we can perceive. These include
brown, teal, gold, pink, and white. One simple theory of color vision implies that all these hues are our eye’s response to different combinations of
wavelengths. This is true to an extent, but we find that color perception is even subtler than our eye’s response for various wavelengths of light.
The two major types of light-sensing cells (photoreceptors) in the retina are rods and cones. Rods are more sensitive than cones by a factor of
about 1000 and are solely responsible for peripheral vision as well as vision in very dark environments. They are also important for motion detection.
There are about 120 million rods in the human retina. Rods do not yield color information. You may notice that you lose color vision when it is very
dark, but you retain the ability to discern grey scales.
Take-Home Experiment: Rods and Cones
1. Go into a darkened room from a brightly lit room, or from outside in the Sun. How long did it take to start seeing shapes more clearly? What
about color? Return to the bright room. Did it take a few minutes before you could see things clearly?
2. Demonstrate the sensitivity of foveal vision. Look at the letter G in the word ROGERS. What about the clarity of the letters on either side of
G?
Cones are most concentrated in the fovea, the central region of the retina. There are no rods here. The fovea is at the center of the macula, a 5 mm
diameter region responsible for our central vision. The cones work best in bright light and are responsible for high resolution vision. There are about 6
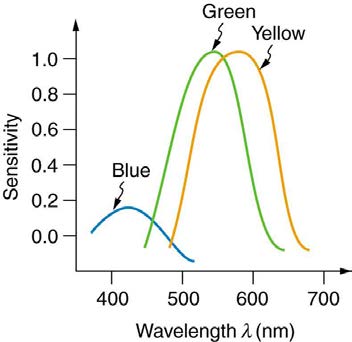
million cones in the human retina. There are three types of cones, and each type is sensitive to different ranges of wavelengths, as illustrated in
Figure 26.10. A simplified theory of color vision is that there are three primary colors corresponding to the three types of cones. The thousands of other hues that we can distinguish among are created by various combinations of stimulations of the three types of cones. Color television uses a
three-color system in which the screen is covered with equal numbers of red, green, and blue phosphor dots. The broad range of hues a viewer sees
is produced by various combinations of these three colors. For example, you will perceive yellow when red and green are illuminated with the correct
ratio of intensities. White may be sensed when all three are illuminated. Then, it would seem that all hues can be produced by adding three primary
colors in various proportions. But there is an indication that color vision is more sophisticated. There is no unique set of three primary colors. Another
set that works is yellow, green, and blue. A further indication of the need for a more complex theory of color vision is that various different
combinations can produce the same hue. Yellow can be sensed with yellow light, or with a combination of red and green, and also with white light
from which violet has been removed. The three-primary-colors aspect of color vision is well established; more sophisticated theories expand on it
rather than deny it.
Figure 26.10 The image shows the relative sensitivity of the three types of cones, which are named according to wavelengths of greatest sensitivity. Rods are about 1000
times more sensitive, and their curve peaks at about 500 nm. Evidence for the three types of cones comes from direct measurements in animal and human eyes and testing of
color blind people.
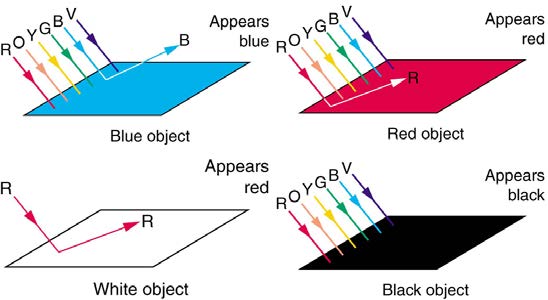
Consider why various objects display color—that is, why are feathers blue and red in a crimson rosella? The true color of an object is defined by its
absorptive or reflective characteristics. Figure 26.11 shows white light falling on three different objects, one pure blue, one pure red, and one black, as well as pure red light falling on a white object. Other hues are created by more complex absorption characteristics. Pink, for example on a galah
cockatoo, can be due to weak absorption of all colors except red. An object can appear a different color under non-white illumination. For example, a
pure blue object illuminated with pure red light will appear black, because it absorbs all the red light falling on it. But, the true color of the object is
blue, which is independent of illumination.
Figure 26.11 Absorption characteristics determine the true color of an object. Here, three objects are illuminated by white light, and one by pure red light. White is the equal mixture of all visible wavelengths; black is the absence of light.
940 CHAPTER 26 | VISION AND OPTICAL INSTRUMENTS
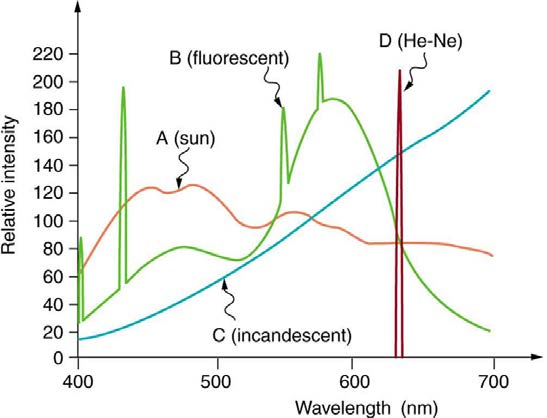
Similarly, light sources have colors that are defined by the wavelengths they produce. A helium-neon laser emits pure red light. In fact, the phrase
“pure red light” is defined by having a sharp constrained spectrum, a characteristic of laser light. The Sun produces a broad yellowish spectrum,
fluorescent lights emit bluish-white light, and incandescent lights emit reddish-white hues as seen in Figure 26.12. As you would expect, you sense these colors when viewing the light source directly or when illuminating a white object with them. All of this fits neatly into the simplified theory that a
combination of wavelengths produces various hues.
Take-Home Experiment: Exploring Color Addition
This activity is best done with plastic sheets of different colors as they allow more light to pass through to our eyes. However, thin sheets of
paper and fabric can also be used. Overlay different colors of the material and hold them up to a white light. Using the theory described above,
explain the colors you observe. You could also try mixing different crayon colors.
Figure 26.12 Emission spectra for various light sources are shown. Curve A is average sunlight at Earth’s surface, curve B is light from a fluorescent lamp, and curve C is the
output of an incandescent light. The spike for a helium-neon laser (curve D) is due to its pure wavelength emission. The spikes in the fluorescent output are due to atomic
spectra—a topic that will be explored later.
Color Constancy and a Modified Theory of Color Vision
The eye-brain color-sensing system can, by comparing various objects in its view, perceive the true color of an object under varying lighting
conditions—an ability that is called color constancy. We can sense that a white tablecloth, for example, is white whether it is illuminated by sunlight,
fluorescent light, or candlelight. The wavelengths entering the eye are quite different in each case, as the graphs in Figure 26.12 imply, but our color vision can detect the true color by comparing the tablecloth with its surroundings.
Theories that take color constancy into account are based on a large body of anatomical evidence as well as perceptual studies. There are nerve
connections among the light receptors on the retina, and there are far fewer nerve connections to the brain than there are rods and cones. This
means that there is signal processing in the eye before information is sent to the brain. For example, the eye makes comparisons between adjacent
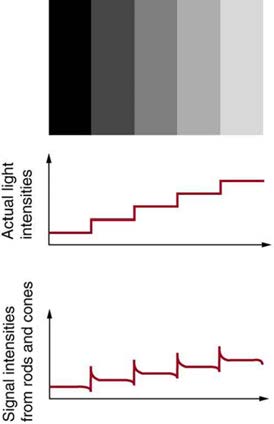
light receptors and is very sensitive to edges as seen in Figure 26.13. Rather than responding simply to the light entering the eye, which is uniform in the various rectangles in this figure, the eye responds to the edges and senses false darkness variations.
Figure 26.13 The importance of edges is shown. Although the grey strips are uniformly shaded, as indicated by the graph immediately below them, they do not appear uniform
at all. Instead, they are perceived darker on the dark side and lighter on the light side of the edge, as shown in the bottom graph. This is due to nerve impulse processing in the
eye.


CHAPTER 26 | VISION AND OPTICAL INSTRUMENTS 941
One theory that takes various factors into account was advanced by Edwin Land (1909 – 1991), the creative founder of the Polaroid Corporation.
Land proposed, based partly on his many elegant experiments, that the three types of cones are organized into systems called retinexes. Each
retinex forms an image that is compared with the others, and the eye-brain system thus can compare a candle-illuminated white table cloth with its
generally reddish surroundings and determine that it is actually white. This retinex theory of color vision is an example of modified theories of color
vision that attempt to account for its subtleties. One striking experiment performed by Land demonstrates that some type of image comparison may
produce color vision. Two pictures are taken of a scene on black-and-white film, one using a red filter, the other a blue filter. Resulting black-and-white
slides are then projected and superimposed on a screen, producing a black-and-white image, as expected. Then a red filter is placed in front of the
slide taken with a red filter, and the images are again superimposed on a screen. You would expect an image in various shades of pink, but instead,
the image appears to humans in full color with all the hues of the original scene. This implies that color vision can be induced by comparison of the
black-and-white and red images. Color vision is not completely understood or explained, and the retinex theory is not totally accepted. It is apparent
that color vision is much subtler than what a first look might imply.
PhET Explorations: Color Vision
Make a whole rainbow by mixing red, green, and blue light. Change the wavelength of a monochromatic beam or filter white light. View the light
as a solid beam, or see the individual photons.
Figure 26.14 Color Vision (http://cnx.org/content/m42487/1.4/color-vision_en.jar)
26.4 Microscopes
Although the eye is marvelous in its ability to see objects large and small, it obviously has limitations to the smallest details it can detect. Human
desire to see beyond what is possible with the naked eye led to the use of optical instruments. In this section we will examine microscopes,
instruments for enlarging the detail that we cannot see with the unaided eye. The microscope is a multiple-element system having more than a single
lens or mirror. (See Figure 26.15) A microscope can be made from two convex lenses. The image formed by the first element becomes the object for
the second element. The second element forms its own image, which is the object for the third element, and so on. Ray tracing helps to visualize the
image formed. If the device is composed of thin lenses and mirrors that obey the thin lens equations, then it is not difficult to describe their behavior
numerically.
Figure 26.15 Multiple lenses and mirrors are used in this microscope. (credit: U.S. Navy photo by Tom Watanabe)
Microscopes were first developed in the early 1600s by eyeglass makers in The Netherlands and Denmark. The simplest compound microscope is
constructed from two convex lenses as shown schematically in Figure 26.16. The first lens is called the objective lens, and has typical magnification values from 5× to 100× . In standard microscopes, the objectives are mounted such that when you switch between objectives, the sample remains
in focus. Objectives arranged in this way are described as parfocal. The second, the eyepiece, also referred to as the ocular, has several lenses
which slide inside a cylindrical barrel. The focusing ability is provided by the movement of both the objective lens and the eyepiece. The purpose of a
microscope is to magnify small objects, and both lenses contribute to the final magnification. Additionally, the final enlarged image is produced in a
location far enough from the observer to be easily viewed, since the eye cannot focus on objects or images that are too close.
942 CHAPTER 26 | VISION AND OPTICAL INSTRUMENTS
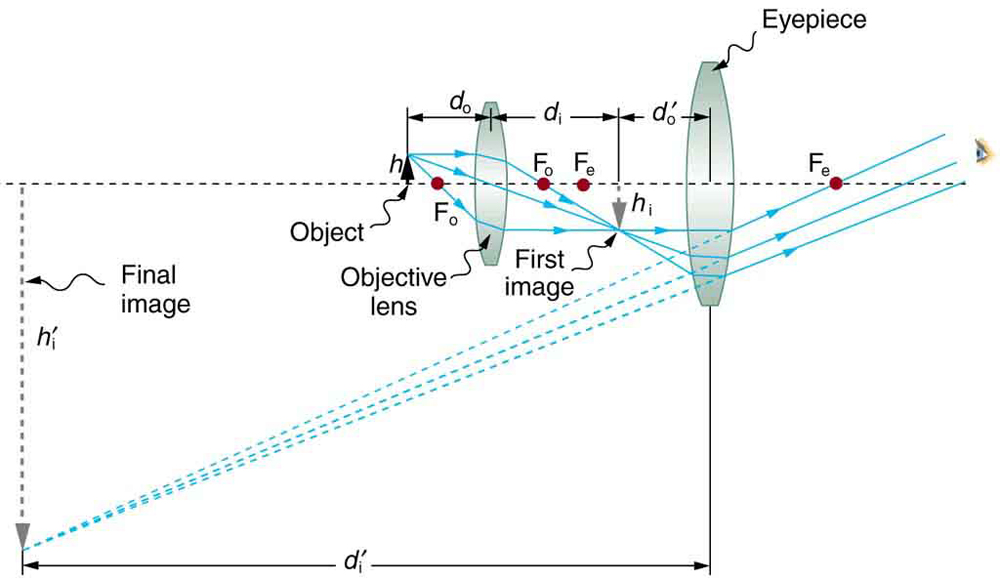
Figure 26.16 A compound microscope composed of two lenses, an objective and an eyepiece. The objective forms a case 1 image that is larger than the object. This first
image is the object for the eyepiece. The eyepiece forms a case 2 final image that is further magnified.
To see how the microscope in Figure 26.16 forms an image, we consider its two lenses in succession. The object is slightly farther away from the
objective lens than its focal length f o , producing a case 1 image that is larger than the object. This first image is the object for the second lens, or
eyepiece. The eyepiece is intentionally located so it can further magnify the image. The eyepiece is placed so that the first image is closer to it than
its focal length f e . Thus the eyepiece acts as a magnifying glass, and the final image is made even larger. The final image remains inverted, but it is
farther from the observer, making it easy to view (the eye is most relaxed when viewing distant objects and normally cannot focus closer than 25 cm).
Since each lens produces a magnification that multiplies the height of the image, it is apparent that the overall magnification m is the product of the
individual magnifications:
m = m
(26.12)
o m e,
where m o is the magnification of the objective and m e is the magnification of the eyepiece. This equation can be generalized for any combination
of thin lenses and mirrors that obey the thin lens equations.
Overall Magnification
The overall magnification of a multiple-element system is the product of the individual magnifications of its elements.
Example 26.5 Microscope Magnification
Calculate the magnification of an object placed 6.20 mm from a compound microscope that has a 6.00 mm focal length objective and a 50.0 mm
focal length eyepiece. The objective and eyepiece are separated by 23.0 cm.
Strategy and Concept
This situation is similar to that shown in Figure 26.16. To find the overall magnification, we must find the magnification of the objective, then the magnification of the eyepiece. This involves using the thin lens equation.
Solution
The magnification of the objective lens is given as
(26.13)
m o = – d i
d ,
o
where d o and d i are the object and image distances, respectively, for the objective lens as labeled in Figure 26.16. The object distance is
given to be d o = 6.20 mm , but the image distance d i is not known. Isolating d i , we have
(26.14)
1 d = 1 − 1 ,
i
f o d o
where f o is the focal length of the objective lens. Substituting known values gives
(26.15)
1 d = 1
i
6.00 mm −
1
6.20 mm = 0.00538
mm .
We invert this to find d i :
d
(26.16)
i = 186 mm.
CHAPTER 26 | VISION AND OPTICAL INSTRUMENTS 943
Substituting this into the expression for m o gives
(26.17)
m o = − d i
d = − 186 mm
o
6.20 mm = −30.0.
Now we must find the magnification of the eyepiece, which is given by
(26.18)
m e = − d i′
d o′,
where d i′ and d o′ are the image and object distances for the eyepiece (see Figure 26.16). The object distance is the distance of the first
image from the eyepiece. Since the first image is 186 mm to the right of the objective and the eyepiece is 230 mm to the right of the objective,
the object distance is d o′ = 230 mm − 186 mm = 44.0 mm . This places the first image closer to the eyepiece than its focal length, so that
the eyepiece will form a case 2 image as shown in the figure. We still need to find the location of the final image d i′ in order to find the
magnification. This is done as before to obtain a value for 1 / d i′ :
(26.19)
1
d
− 1
i′ = 1 f e
d o′ =
1
50.0 mm −
1
44.0 mm = −0.00273
mm .
Inverting gives
(26.20)
d i′ = − mm
0.00273 = −367 mm.
The eyepiece’s magnification is thus
(26.21)
m e = − d i′
d o′ = −−367 mm
44.0 mm = 8.33.
So the overall magnification is
m
(26.22)
= m o m e = ( − 30.0)(8.33) = −250.
Discussion
Both the objective and the eyepiece contribute to the overall magnification, which is large and negative, consistent with Figure 26.16, where the
image is seen to be large and inverted. In this case, the image is virtual and inverted, which cannot happen for a single element (case 2 and
case 3 images for single elements are virtual and upright). The final image is 367 mm (0.367 m) to the left of the eyepiece. Had the eyepiece
been placed farther from the objective, it could have formed a case 1 image to the right. Such an image could be projected on a screen, but it
would be behind the head of the person in the figure and not appropriate for direct viewing. The procedure used to solve this example is
applicable in any multiple-element system. Each element is treated in turn, with each forming an image that becomes the object for the next
element. The process is not more difficult than for single lenses or mirrors, only lengthier.
Normal optical microscopes can magnify up to 1500× with a theoretical resolution of – 0.2 μm . The lenses can be quite complicated and are
composed of multiple elements to reduce aberrations. Microscope objective lenses are particularly important as they primarily gather light from the
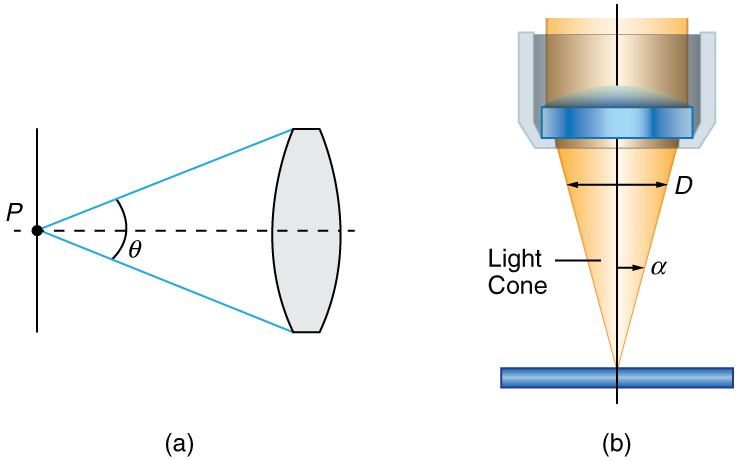
specimen. Three parameters describe microscope objectives: the numerical aperture (NA) , the magnification ( m) , and the working distance. The
NA is related to the light gathering ability of a lens and is obtained using the angle of acceptance θ formed by the maximum cone of rays focusing
on the specimen (see Figure 26.17(a)) and is given by
NA
(26.23)
= n sin α,
where n is the refractive index of the medium between the lens and the specimen and α = θ / 2 . As the angle of acceptance given by θ
increases, NA becomes larger and more light is gathered from a smaller focal region giving higher resolution. A 0.75 NA objective gives more
detail than a 0.10 NA objective.
944 CHAPTER 26 | VISION AND OPTICAL INSTRUMENTS
Figure 26.17 (a) The numerical aperture (NA) of a microscope objective lens refers to the light-gathering ability of the lens and is calculated using half the angle of acceptance θ . (b) Here, α is half the acceptance angle for light rays from a specimen entering a camera lens, and D is the diameter of the aperture that controls the light entering the lens.
While the numerical aperture can be used to compare resolutions of various objectives, it does not indicate how far the lens could be from the
specimen. This is specified by the “working distance,” which is the distance (in mm usually) from the front lens element of the objective to the
specimen, or cover glass. The higher the NA the closer the lens will be to the specimen and the more chances there are of breaking the cover slip
and damaging both the specimen and the lens. The focal length of an objective lens is different than the working distance. This is because objective
lenses are made of a combination of lenses and the focal length is measured from inside the barrel. The working distance is a parameter that
microscopists can use more readily as it is measured from the outermost lens. The working distance decreases as the NA and magnification both
increase.
The term f / # in general is called the f -number and is used to denote the light per unit area reaching the image plane. In photography, an image
of an object at infinity is formed at the focal point and the f -number is given by the ratio of the focal length f of the lens and the diameter D of the
aperture controlling the light into the lens (see Figure 26.17(b)). If the acceptance angle is small the NA of the lens can also be used as given below.
(26.24)
f /# = fD ≈ 1
2 NA.
As the f -number decreases, the camera is able to gather light from a larger angle, giving wide-angle photography. As usual there is a trade-off. A
greater f / # means less light reaches the image plane. A setting of
Describe what you're looking for in as much detail as you'd like.
Our AI reads your request and finds the best matching books for you.
Popular searches:
Join 2.9 million readers and get unlimited free ebooks