

Monarchy & Republic in the Laboratory of History by N. Fakhr - HTML preview
Download the book in PDF, ePub for a complete version.
Comparison of the Voice and Accountability Indicator Between Monarchies and Republics Across Continents and in the Middle East
Comparison of the Voice and Accountability Indicator Between Monarchies and Republics in Asia
Descriptive Statistics
Type of Government |
Number of Countries |
Mean |
Median |
Sample Standard Deviation |
Asian Monarchies |
13 |
31.48 |
27.00 |
21.41 |
Asian Republics |
33 |
27.03 |
23.50 |
21.43 |
The mean Voice and Accountability score is 31.48 for Asian monarchies and 27.03 for Asian republics. Thus, Asian monarchies score, on average, 4.45 percentile points higher than the republics of the continent.
The median points in the same direction. The median is 27.00 for monarchies and 23.50 for republics, meaning that the median country among Asian monarchies scores 3.50 percentile points higher than the median country among Asian republics.
At the same time, the standard deviations of the two groups are almost identical—approximately 21.4—indicating a similar degree of variation in performance within both groups.
Test of the Difference Between Means
To assess the statistical significance of the difference between the two means, Welch’s t-test was used.
Statistical Measure |
Value |
Mean difference (Monarchies − Republics) |
4.46 |
Welch’s t statistic |
0.636 |
Approximate degrees of freedom |
22.05 |
Two-tailed p-value |
0.532 |
Welch’s test indicates that the difference in the mean Voice and Accountability scores between Asian monarchies and republics is not statistically significant (p = 0.532). Therefore, based on the available data, the hypothesis of equal means cannot be rejected.
Mann–Whitney Test
To ensure that the conclusion does not depend on the assumptions of the parametric test, the nonparametric Mann–Whitney test was also conducted.
Statistical Measure |
Value |
U statistic |
247 |
Two-tailed p-value |
0.435 |
The Mann–Whitney test likewise finds no statistically significant difference between the two groups (p = 0.435), confirming the result of Welch’s test.
Conclusion
In 2023, Asian monarchies had a higher average Voice and Accountability score than Asian republics, with both the mean and the median favoring monarchies. However, the observed difference did not reach statistical significance in either Welch’s test or the Mann–Whitney test.
This result indicates that in Asia, as in the global comparison, the data do not contradict the “New or Modern Monarchy” hypothesis, but neither do they provide sufficient statistical evidence to establish a systematic difference between the two groups. The relatively small difference between the means, combined with substantial variation within both groups, means that the observed difference is not statistically significant.
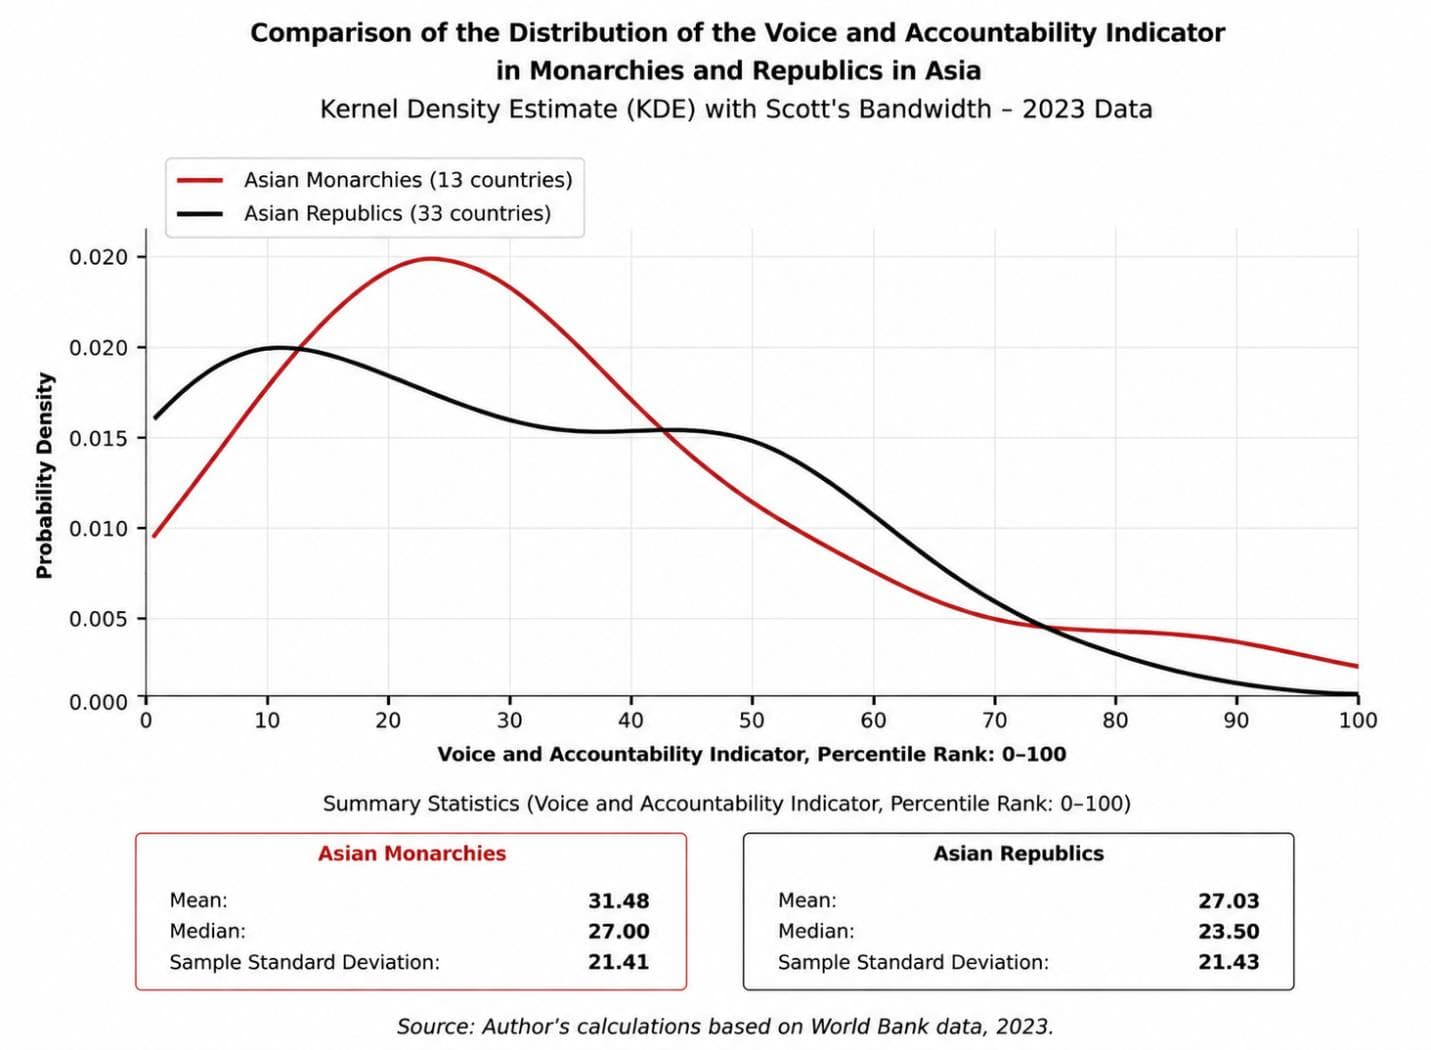
The kernel density estimate shows that the distributions of Asian monarchies and republics on the Voice and Accountability indicator overlap substantially, although the monarchy curve is slightly shifted toward higher scores. This pattern is consistent with the descriptive statistics: the mean and median scores for Asian monarchies are 31.48 and 27.00, respectively, compared with 27.03 and 23.50 for Asian republics. By contrast, the standard deviations of the two groups are nearly identical, indicating a similar degree of dispersion in scores among the monarchies and republics of the continent. Thus, the 2023 data suggest a modest average advantage for Asian monarchies, but the limited separation between the two distributions means that any firm conclusion should be based on the results of the statistical significance tests.
Comparison of the Voice and Accountability Indicator Between Monarchies and Republics in Europe
Descriptive Statistics
Type of Government |
Number of Countries |
Mean |
Median |
Sample Standard Deviation |
European Monarchies |
11 |
87.91 |
93.10 |
18.79 |
European Republics |
34 |
69.77 |
77.45 |
23.52 |
The mean Voice and Accountability score is 87.91 for European monarchies and 69.77 for European republics. Thus, European monarchies score, on average, 18.14 percentile points higher than European republics.
The median confirms the same pattern. The median is 93.10 for monarchies and 77.45 for republics, meaning that the median country among European monarchies scores 15.65 percentile points higher than the median country among European republics.
The standard deviation is also lower among monarchies (18.79) than among republics (23.52), indicating that European monarchies have not only higher scores but also somewhat less variation in their performance.
Test of the Difference Between Means
To assess the statistical significance of the difference between the two means, Welch’s t-test was used.
Statistical Measure |
Value |
Mean difference (Monarchies − Republics) |
18.14 |
Welch’s t statistic |
2.61 |
Approximate degrees of freedom |
21.07 |
Two-tailed p-value |
0.0164 |
Welch’s test shows that the difference in the mean Voice and Accountability scores between European monarchies and republics is statistically significant (p = 0.016). Therefore, the hypothesis of equal means is rejected at the 5 percent significance level.
Mann–Whitney Test
To ensure that the result does not depend on the assumptions of the parametric test, the nonparametric Mann–Whitney test was also conducted.
Statistical Measure |
Value |
U statistic |
294 |
Two-tailed p-value |
0.0049 |
The Mann–Whitney test likewise indicates a statistically significant difference between the two groups (p = 0.0049), confirming the result of Welch’s test.
Conclusion
In 2023, European monarchies had higher Voice and Accountability scores than European republics in terms of both the mean and the median. Both Welch’s test and the Mann–Whitney test confirm that the difference is statistically significant.
This finding indicates that, on average, citizens of European monarchies enjoyed greater freedom to express their views, participate in political life, operate through the media, and hold governments accountable. Therefore, the European evidence for this indicator is also consistent with the prediction of the “New or Modern Monarchy” hypothesis.
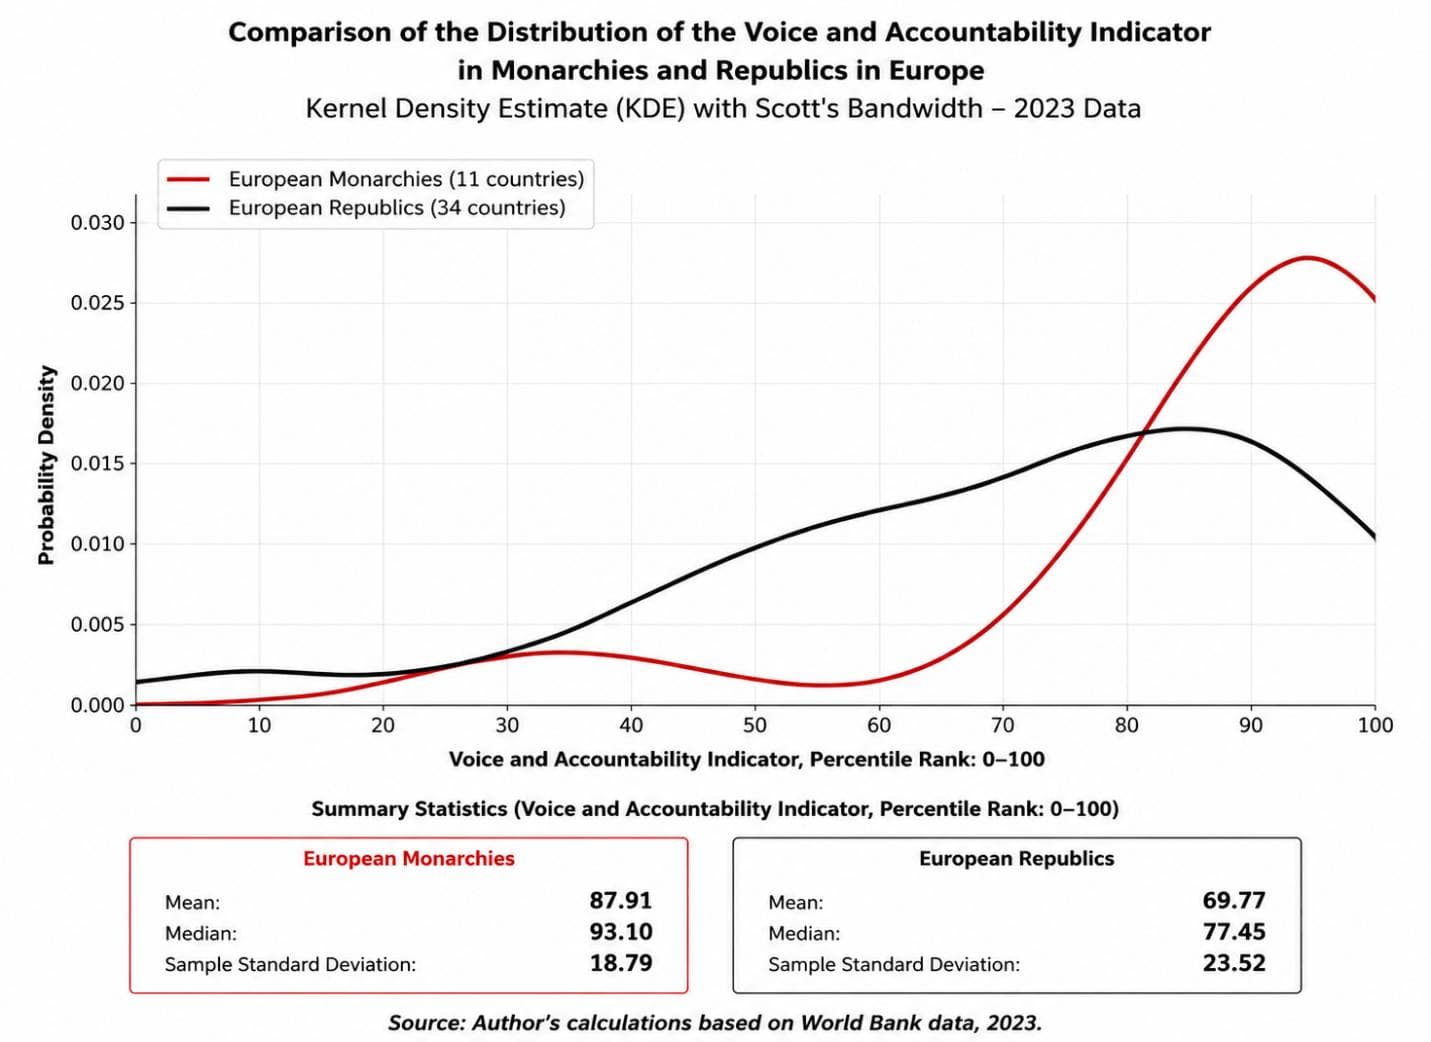
The kernel density estimate shows that the distribution of European monarchies on the Voice and Accountability indicator is generally concentrated at the higher end of the scale, with the greatest density occurring among very high scores. By contrast, although European republics include a substantial number of countries with high scores, their distribution is more dispersed, with some countries falling within the middle and lower ranges of the indicator. This pattern is also consistent with the descriptive statistics: the mean and median scores for European monarchies are 87.91 and 93.10, respectively, compared with 69.77 and 77.45 for European republics. Thus, the 2023 data indicate that, on average, European monarchies perform better than the republics of the continent on the Voice and Accountability indicator.
Comparison of the Voice and Accountability Indicator Between European Monarchies and European Republics That Have Never Been Communist
Descriptive Statistics
Type of Government |
Number of Countries |
Mean |
Median |
Sample Standard Deviation |
European Monarchies |
11 |
87.91 |
93.10 |
18.79 |
Never-Communist European Republics |
13 |
89.17 |
89.70 |
7.47 |
The mean Voice and Accountability score is 87.91 among European monarchies and 89.17 among European republics that have never experienced communist rule. Thus, the never-communist republics score 1.26 percentile points higher on average than the European monarchies.
The median, however, points slightly in the opposite direction. The median is 93.10 among monarchies and 89.70 among never-communist republics. The difference between the mean and the median suggests that one or more relatively low values among the European monarchies—such as Monaco on this indicator—pull down the group mean.
The standard deviation is also substantially higher among monarchies (18.79) than among the never-communist republics (7.47), indicating considerably greater variation among European monarchies on this indicator.
Test of the Difference in Means
To assess the statistical significance of the difference in means, Welch’s t-test was used.
Statistical Measure |
Value |
Mean difference (Monarchies − Republics) |
−1.26 |
Welch’s t statistic |
−0.209 |
Approximate degrees of freedom |
12.67 |
Two-tailed p-value |
0.838 |
Welch’s test shows that the difference in mean Voice and Accountability scores between European monarchies and never-communist European republics is not statistically significant (p = 0.838). The hypothesis of equal means is therefore not rejected.
Mann–Whitney Test
To ensure that the result does not depend on the assumptions of the parametric test, the nonparametric Mann–Whitney test was also conducted.
Statistical Measure |
Value |
U statistic |
87 |
Two-tailed p-value |
0.385 |
The Mann–Whitney test likewise finds no statistically significant difference between the two groups (p = 0.385), confirming the result of Welch’s test.
Conclusion
Once European republics with a history of communist rule are excluded, the difference between monarchies and republics on the Voice and Accountability indicator effectively disappears. Although the median remains slightly higher among monarchies, the group means are extremely close, and neither Welch’s test nor the Mann–Whitney test finds a statistically significant difference.
This result indicates that among European countries with longer-established democratic institutions and civil liberties, regime type—monarchy or republic—is not associated with a statistically significant difference on this indicator. Thus, unlike some previous indicators such as Control of Corruption or Property Rights, European monarchies do not show a statistically significant advantage over never-communist European republics in Voice and Accountability. As elsewhere in this book, this finding describes an observational relationship and is not by itself sufficient to establish causation.
Methodological Note
It should be emphasized that the comparison between European monarchies and European republics with no history of communist rule is only a supplementary analysis intended to explore the possible sources of observed differences; it does not constitute the primary basis for the study’s overall assessment of the relative performance of monarchy and republic. From the outset, the hypothesis of this book concerns the comparison of the two forms of government in their broader categories, and the principal conclusions should therefore rest on comparisons between all monarchies and all republics.
Excluding republics with a communist past—just as excluding non-constitutional monarchies—may help clarify the role of historical, political, or cultural factors in shaping the results, but it does not by itself justify changing the basis of the main comparison. For this reason, such comparisons are used in this book only to interpret the data more carefully and identify potentially relevant factors, not to replace the principal analysis.
Comparison of the Voice and Accountability Indicator in Africa, the Americas, and Oceania
Because the number of monarchies in Africa and Oceania is small, and because the number of Commonwealth realms is also limited in some of these regions, this section is restricted to descriptive statistics and does not include inferential statistical tests.
Africa
Type of Government |
Number of Countries |
Mean |
Median |
Standard Deviation |
African Monarchies |
3 |
32.83 |
34.30 |
15.45 |
African Republics |
49 |
32.41 |
29.90 |
19.66 |
In Africa, the mean Voice and Accountability scores of monarchies and republics are almost identical, and no substantial difference is evident between the two groups.
The Americas
Type of Government |
Number of Countries |
Mean |
Median |
Standard Deviation |
Commonwealth Realms in the Americas |
9 |
73.20 |
72.10 |
9.02 |
Republics in the Americas |
26 |
51.64 |
54.15 |
23.53 |
In the Americas, Commonwealth realms perform substantially better than republics in terms of both the mean and the median, while also displaying considerably less dispersion.
Oceania
Type of Government |
Number of Countries |
Mean |
Median |
Standard Deviation |
Oceanian Monarchy |
1 |
75.00 |
75.00 |
— |
Commonwealth Realms in Oceania |
5 |
77.94 |
89.20 |
23.86 |
Oceanian Republics |
9 |
74.61 |
80.90 |
11.74 |
Oceania has only one independent monarchy, Tonga, so a meaningful inferential comparison between monarchies and republics is not possible. Descriptively, however, both Tonga and the Commonwealth realms of Oceania perform at levels broadly similar to the region’s republics, and the differences in group means are not large.
Comparison of the Voice and Accountability Indicator Between Monarchies and Republics in the Middle East
Descriptive Statistics
Type of Government |
Number of Countries |
Mean |
Median |
Standard Deviation |
Middle Eastern Monarchies |
7 |
20.10 |
21.10 |
8.06 |
Middle Eastern Republics |
10 |
27.10 |
20.80 |
26.20 |
The mean Voice and Accountability score is 20.10 among Middle Eastern monarchies and 27.10 among the region’s republics. Thus, the mean for republics is 7 percentile points higher than that for monarchies.
The medians, however, are almost identical: 21.10 for monarchies and 20.80 for republics. This divergence between the mean and the median reflects the much greater dispersion among the republics. The standard deviation for republics is 26.20, more than three times that of monarchies. Middle Eastern republics are therefore a highly heterogeneous group on this indicator, combining very low scores with two very high values.
Test of the Difference in Means
To assess the statistical significance of the difference in means, Welch’s t-test was used.
Statistical Measure |
Value |
Mean difference (Monarchies − Republics) |
−7.00 |
Welch’s t statistic |
−0.793 |
Approximate degrees of freedom |
11.29 |
Two-tailed p-value |
0.444 |
95% confidence interval |
−26.37 to 12.37 |
Hedges’ g |
−0.32 |
Welch’s test shows that the difference between the two group means is not statistically significant (p = 0.444). The 95% confidence interval includes zero, meaning that the available data are compatible with a positive difference, a negative difference, or no true difference between the groups.
Hedges’ g is approximately −0.32, indicating a small effect in favor of republics. Given the limited sample size and wide confidence interval, however, this estimate is subject to substantial uncertainty.
Mann–Whitney Test
To compare the overall rankings of the two groups and reduce dependence on the means, the nonparametric Mann–Whitney test was also conducted.
Statistical Measure |
Value |
U statistic |
37 |
Two-tailed p-value |
0.887 |
Rank-biserial correlation |
0.06 |
The Mann–Whitney test likewise finds no statistically significant difference between the two groups (p = 0.887). The rank-based effect size is also close to zero, indicating little overall difference in the relative positions of Middle Eastern monarchies and republics within the distribution.
Conclusion
In the Middle East, the mean Voice and Accountability score is higher among republics than among monarchies, but the medians of the two groups are nearly identical, and neither Welch’s test nor the Mann–Whitney test finds a statistically significant difference.
The very high dispersion among republics indicates that their higher mean is strongly influenced by a small number of countries with exceptionally high scores, while most of the region’s republics fall within a range similar to, or below, that of the monarchies. This does not, however, justify excluding those countries or disregarding the republican mean; they are genuine members of the group being studied.
Accordingly, the direction of the mean difference in this comparison runs contrary to the prediction of the “New or Modern Monarchy” hypothesis, but the statistical evidence does not indicate that this difference reflects a systematic distinction between the two forms of government. More precisely, the Middle Eastern result on this indicator provides neither clear support for the hypothesis nor sufficient evidence to reject it.
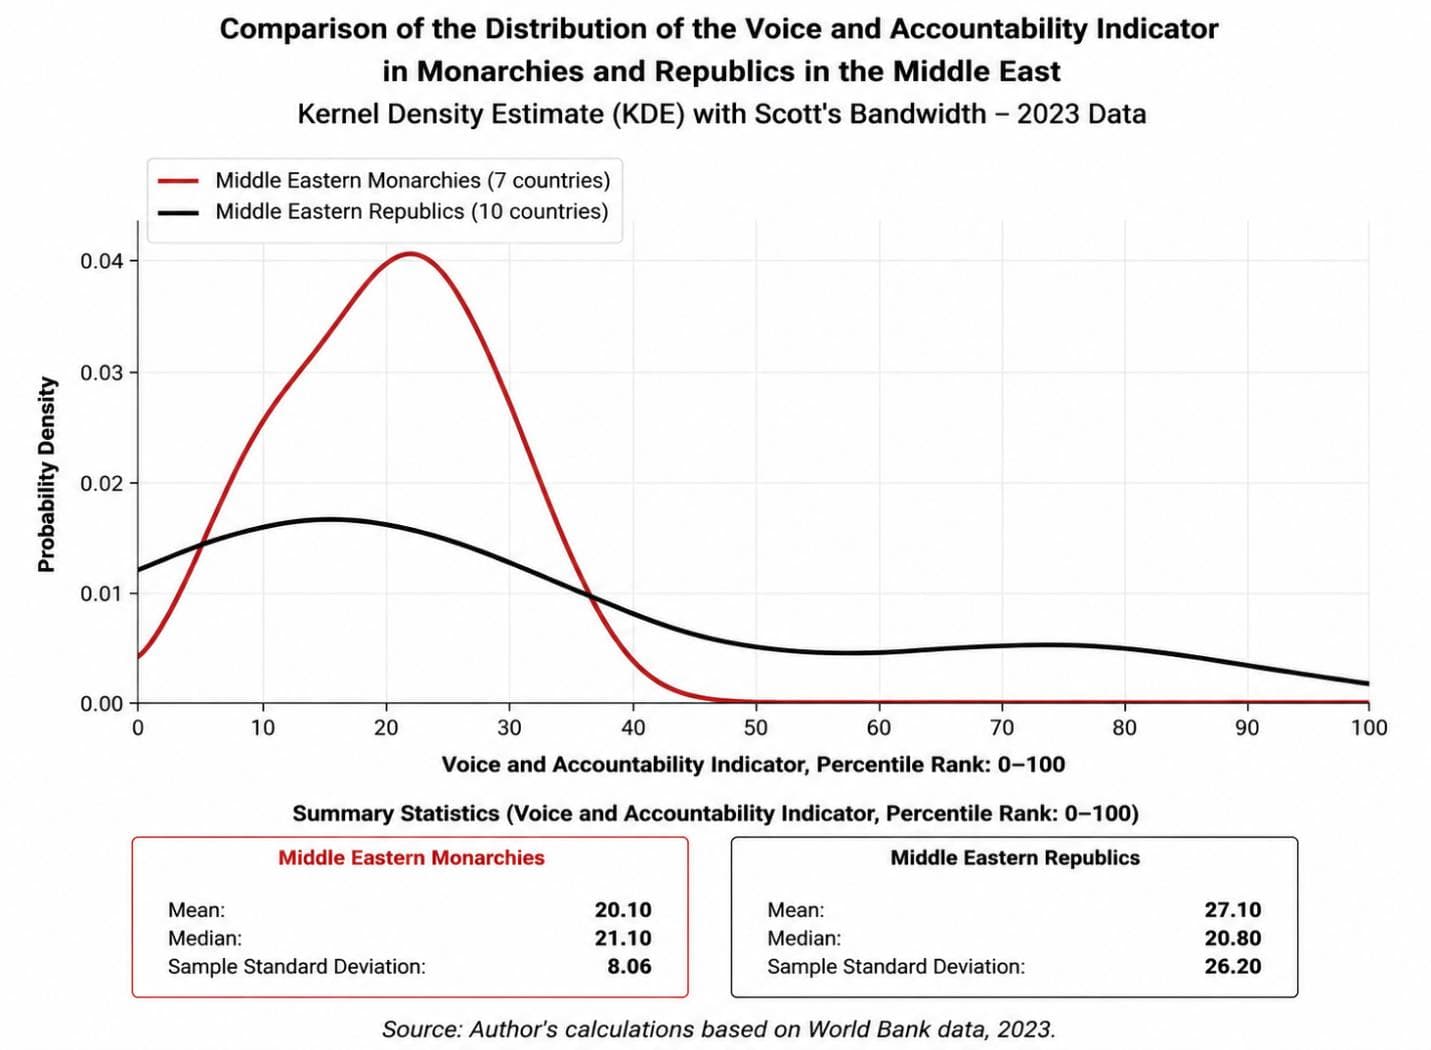
The kernel density estimate shows that the distributions of Middle Eastern monarchies and republics on the Voice and Accountability indicator overlap considerably, but the republics display substantially greater dispersion. This difference is also reflected in the descriptive statistics: the mean score for Middle Eastern republics (27.10) is somewhat higher than that for monarchies (20.10), while the standard deviation among republics (26.20) is more than three times that among monarchies (8.06). This pattern indicates that Middle Eastern republics constitute a highly heterogeneous group in terms of Voice and Accountability, with some countries receiving very high scores and others very low scores, whereas the region’s monarchies are concentrated within a narrower and relatively similar range.
Why Does the Middle Eastern Result Differ from the Overall Pattern?
We appear to have reached the first result that differs from the dominant pattern observed throughout this study, making it one of the most interesting sections of the book.
In the Middle East, unlike the global pattern, the mean Voice and Accountability score is somewhat higher among republics than among monarchies, although the difference between the two groups is not statistically significant and their medians are nearly identical. Unlike many of the preceding indicators, therefore, this result provides neither clear support for the “New or Modern Monarchy” hypothesis nor evidence sufficient to reject it.
This raises an important question.
If Voice and Accountability is so important to good governance, how is it possible that the same Middle Eastern monarchies that score relatively low on this indicator have performed better than the region’s republics on nearly all the other indicators examined so far? These countries have performed favorably on indicators such as GDP per capita, purchasing power, the Gini coefficient, political stability, regulatory quality, rule of law, government effectiveness, control of corruption, property rights, and human development. If Voice and Accountability is a necessary condition for achieving these objectives, how can these two patterns coexist?
Earlier, in examining the Political Stability and Absence of Violence indicator, we also encountered a result in Oceania that ran contrary to the global pattern. There, the particular characteristics of the region’s small island states appeared likely to have contributed to the result, and once data from other regions of the world were incorporated, the effect of that regional pattern disappeared from the overall result.
Something similar may be occurring in the Middle East: a regional factor, independent of the form of government, may be influencing Voice and Accountability scores.
One hypothesis worth examining concerns the role of religious fundamentalist movements in some countries of the region. In much of the Middle East, there are groups with substantial social support that openly advocate restricting a range of individual and civil liberties according to their particular interpretation of Sharia. If such groups gain power through elections or unrestricted political activity, they may themselves proceed to restrict the liberties of those same citizens, including the freedom of expression of their opponents.
This possibility raises an important question: Could there, under certain circumstances, be a difficult trade-off between expanding Voice and Accountability and preserving other objectives of government? Conflicts may sometimes arise among different governmental objectives, and the best decision may not always be to maximize a single indicator. Can all political values be maximized simultaneously, or are choices among them sometimes unavoidable?
In other words, could a government, under particular regional circumstances, restrict some political liberties in order to prevent the establishment of a regime that would abolish many fundamental liberties, while at the same time maintaining higher levels of security, stability, property rights, prosperity, and other dimensions of governance?
The contemporary history of Iran is an example often raised in this discussion. In the second half of the 1970s, the political environment became more open than before, and opponents of the government gained greater scope for political activity. Some analysts argue that this political opening, alongside a range of other factors, contributed to the fall of the monarchy and the establishment of the Islamic Republic—a regime that, according to the data examined in this study, has performed more poorly on many governance indicators than many of the region’s monarchies.
This example, however, is not by itself sufficient to establish such a relationship. The Iranian Revolution resulted from a combination of political, economic, social, religious, and international factors, and the contribution of each cannot be isolated using the data in this study. Nor can the available evidence establish that the relatively low Voice and Accountability scores of Middle Eastern monarchies necessarily result from attempts to preserve other liberties. This is merely one possible hypothesis for explaining the observed pattern, and evaluating it would require dedicated research beyond the scope of this study.
Nevertheless, the question itself is worth considering. If greater Voice and Accountability always and under all circumstances led to better achievement of the objectives of government, one might expect Middle Eastern monarchies, with their lower scores on this indicator, also to perform more poorly on other governance indicators. Yet the evidence examined in this study shows precisely the opposite pattern.
The evidence in this section therefore establishes neither that greater Voice and Accountability always leads to better achievement of other governmental objectives nor the reverse. What this study identifies is simply a noteworthy coexistence of two patterns: in the Middle East, monarchies that score lower on Voice and Accountability have nevertheless performed better than the region’s republics on many other governance indicators. Whether this coexistence reflects an unavoidable trade-off among certain objectives of government under particular regional conditions, or instead results from other factors not examined here, is a question raised by this study but left for future research to answer.
One further point should also be emphasized. Democracy is not itself an objective of government; it is one method of governing. As discussed at the beginning of this book on the basis of the views of political philosophers, the objectives of government are to provide citizens with welfare, order, justice, liberty, and security. Democracy is valuable insofar as it succeeds in advancing these objectives. Therefore, if under particular circumstances a conflict emerges between certain democratic mechanisms and the achievement of other governmental objectives, that conflict should be examined empirically and on the basis of evidence rather than decided in advance solely on the basis of theoretical assumptions.
Status of the “New or Modern Monarchy” Hypothesis After the Thirteenth Indicator
So far, the “New or Modern Monarchy” hypothesis has been tested using thirteen independent indicators. Of these, eleven indicators have clearly been consistent with the hypothesis’s prediction, with statistically significant differences between monarchies and republics.
For the Gini coefficient, the difference between monarchies and republics was in the direction predicted by the hypothesis but did not reach statistical significance. Thus, although the result was aligned with the hypothesis, this indicator alone did not provide sufficient evidence to support it statistically.
The Voice and Accountability indicator produced a different pattern. In the principal comparison—all monarchies worldwide versus all republics—the mean score for monarchies was higher than that for republics, but the difference was not statistically significant. A similar result was found in Asia. In Europe, the difference favored monarchies and was statistically significant, whereas in the Middle East the direction of the mean difference ran contrary to the hypothesis’s prediction, but this difference also failed to reach statistical significance. On the basis of the principal comparison, therefore, this indicator provides insufficient evidence either to support or to reject the hypothesis.
At the same time, the supplementary analyses of this indicator produced noteworthy findings. Constitutional monarchies performed significantly better than both republics and semi-constitutional and absolute monarchies. Commonwealth realms also scored significantly higher than republics worldwide. Because these analyses concern subgroups, they are not incorporated into the study’s principal conclusion, but they may be useful for interpreting the observed patterns and guiding future research.
Contrary to what might initially appear, this result is not a weakness of the study. Rather, it demonstrates that the hypothesis has been tested in a way that allows for divergent findings. If every result, regardless of its direction or statistical significance, were interpreted as supporting the hypothesis, the value of the empirical test would be diminished. In this study, results consistent with the hypothesis have been reported as such, while cases in which the evidence is insufficient for a definitive judgment have likewise been presented without exaggeration or post hoc justification.
Accordingly, at this stage of the study, eleven of the thirteen indicators examined have provided statistically significant evidence consistent with the “New or Modern Monarchy” hypothesis. The remaining two indicators did not reach statistical significance, but neither provided statistically significant evidence contrary to the hypothesis. Thus far, no indicator has produced statistically significant evidence against the “New or Modern Monarchy” hypothesis.
Test |
Indicator |
Result |
✓ |
GDP per Capita |
Consistent with the hypothesis |
✓ |
Purchasing Power per Capita |
Consistent with the hypothesis |
◐ |
Gini Coefficient |
Mixed evidence; difference favors the hypothesis |
✓ |
Political Stability and Absence of Violence |
Consistent with the hypothesis |
✓ |
Regulatory Quality |
Consistent with the hypothesis |
✓ |
Rule of Law |
Consistent with the hypothesis |
✓ |
Government Effectiveness |
Consistent with the hypothesis |
✓ |
Inflation |
Consistent with the hypothesis |
✓ |
Control of Corruption |
Consistent with the hypothesis |
✓ |
Corruption Perceptions |
Consistent with the hypothesis |
✓ |
Property Rights |
Consistent with the hypothesis |
✓ |
Human Development |
Consistent with the hypothesis |
◐ |
Voice and Accountability |
Mixed evidence; principal test not significant, but supplementary analyses favor the hypothesis |