

Monarchy & Republic in the Laboratory of History by N. Fakhr - HTML preview
Download the book in PDF, ePub for a complete version.
Voice and Accountability
So far, all the indicators examined have been consistent with the predictions of the “New or Modern Monarchy” hypothesis. The results have shown that monarchies, whether constitutional or non-constitutional, have on average performed better than republics in providing their citizens with the rights and opportunities necessary for liberty. Thus, for indicators that measure liberty in terms of the ability to choose and access rights and opportunities, the evidence so far has been consistent with the hypothesis.
Yet in the contemporary understanding, liberty is associated perhaps more than anything else with freedom of expression and political participation. For this reason, if the “New or Modern Monarchy” hypothesis is to face a serious test, one of the most appropriate indicators is the Voice and Accountability indicator.
Voice and Accountability is one of the World Bank’s six Worldwide Governance Indicators. It measures the extent to which citizens are able to express their views on public affairs, participate in selecting their government, enjoy freedom of expression and freedom of the media, and form and participate in associations. The World Bank reports this indicator as a percentile rank, with higher scores indicating greater opportunities for citizens to express their views and participate in public life.
The data used in this section are from 2023 (Appendix RDS-M01). For brevity, from this point onward I refer to it simply as the “Voice” indicator.
We can now examine whether, in this dimension of liberty as well, the evidence remains consistent with the predictions of the “New or Modern Monarchy” hypothesis—or whether this will be the first indicator to challenge it.
Comparison of the “Voice and Accountability” Indicator Between Monarchies and Republics Worldwide
Descriptive Statistics
Form of Government |
Number of Countries |
Mean |
Median |
Standard Deviation |
Monarchies Worldwide |
28 |
55.35 |
49.25 |
33.60 |
Republics Worldwide |
151 |
45.47 |
44.60 |
27.66 |
The mean percentile rank for Voice and Accountability is 55.35 among the world’s monarchies and 45.47 among republics. Thus, monarchies score approximately 9.88 percentile points higher on average than republics.
The median points in the same direction. The median is 49.25 for monarchies and 44.60 for republics, meaning that the median country among monarchies ranks approximately 4.65 percentile points higher than the median country among republics.
Both groups exhibit considerable dispersion. The standard deviation is 33.60 among monarchies and 27.66 among republics. This substantial variation indicates that both forms of government include countries with very high as well as very low scores.
Test of the Difference in Means
To assess the statistical significance of the difference in means, Welch’s t-test was used.
Statistical Measure |
Value |
Mean difference; monarchy minus republic |
9.88 |
Welch’s t statistic |
1.47 |
Approximate degrees of freedom |
34.11 |
Two-tailed p-value |
0.152 |
95% confidence interval |
−3.81 to 23.57 |
Hedges’ g |
0.34 |
Welch’s test shows that although the mean score is higher among monarchies, the difference is not statistically significant at the conventional 5 percent level (p = 0.152). The 95 percent confidence interval also includes zero. Therefore, the available data do not provide sufficient evidence to conclude that there is a systematic difference between the mean scores of the two groups.
Hedges’ g is 0.34, indicating a small-to-moderate effect in favor of monarchies.
Mann–Whitney Test
To compare the overall distributions of the two groups without relying on the assumptions of a parametric test, the nonparametric Mann–Whitney test was also conducted.
Statistical Measure |
Value |
U statistic |
2490 |
Two-tailed p-value |
0.136 |
Rank-biserial correlation |
0.18 |
The Mann–Whitney test likewise does not find a statistically significant difference between the two groups at the 5 percent level (p = 0.136). The rank-based effect size of 0.18 is also small and favors monarchies.
Conclusion
In 2023, monarchies worldwide had higher scores than republics on the Voice and Accountability indicator in terms of both the mean and the median; however, the observed difference did not reach statistical significance in either Welch’s t-test or the Mann–Whitney test.
The result is therefore not inconsistent with the “New or Modern Monarchy” hypothesis, since the observed difference is in the direction predicted by the hypothesis. Unlike most of the preceding indicators, however, the statistical evidence is insufficient to establish a systematic difference between the two groups. More precisely, this test neither contradicts the hypothesis nor provides strong statistical support for it.
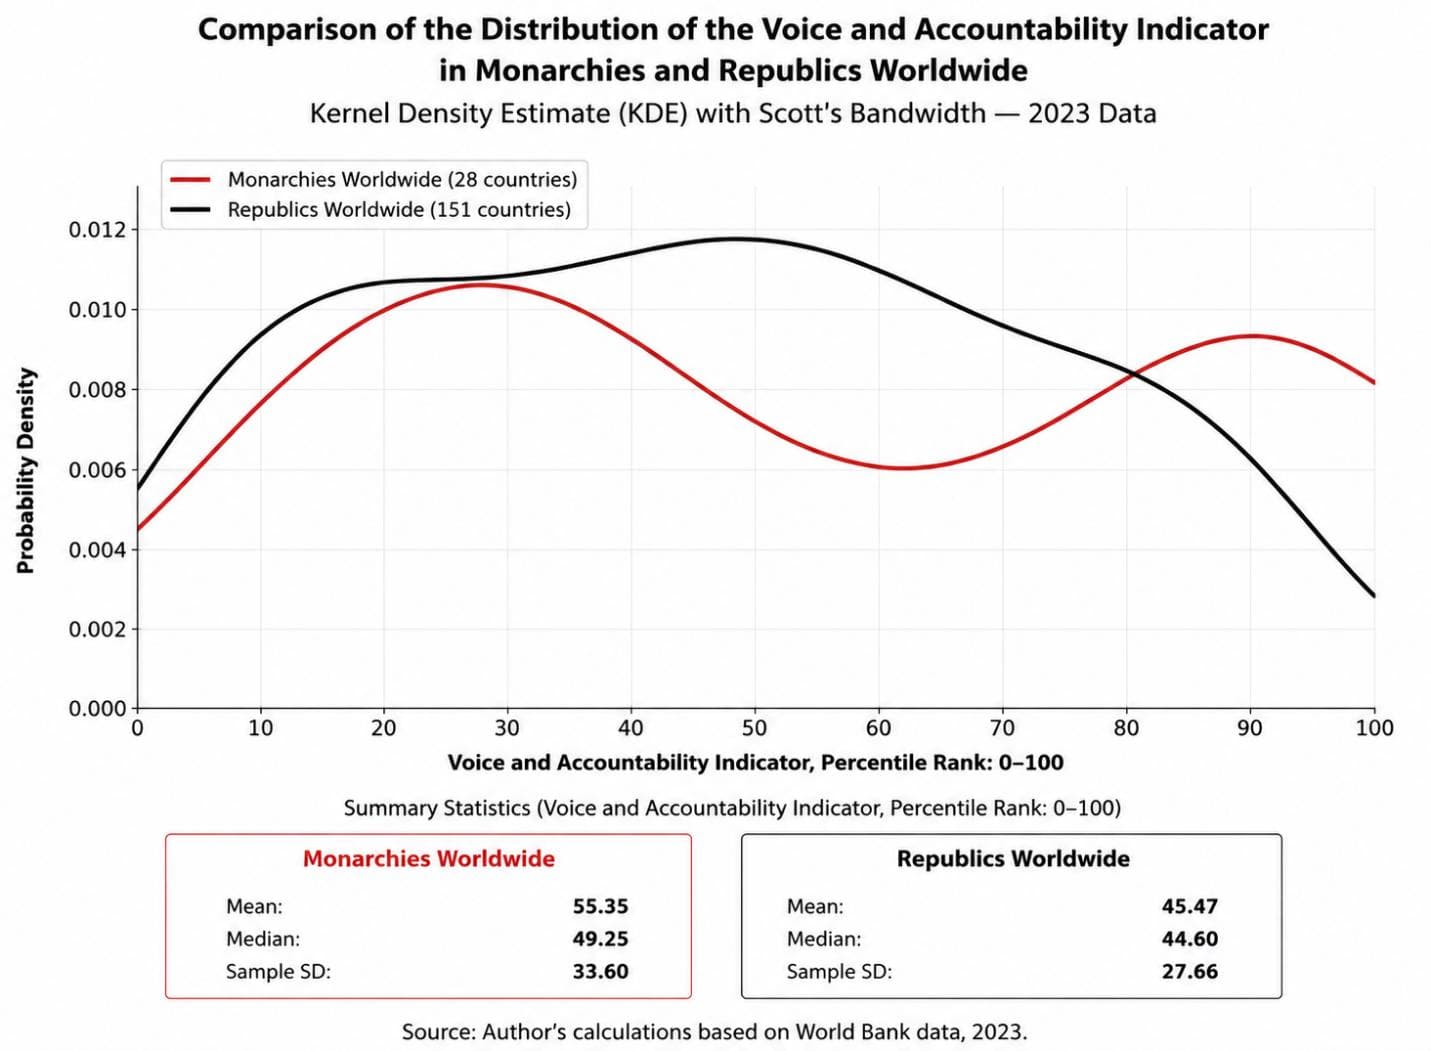
The kernel density estimate shows that the distribution of monarchies worldwide on the Voice and Accountability indicator is generally shifted toward higher scores, although there is also considerable variation among them. In contrast, republics worldwide span a broader range of scores, with greater concentration in the middle and lower levels of the indicator. This pattern is also consistent with the descriptive statistics: the mean and median scores for monarchies are 55.35 and 49.25, respectively, compared with 45.47 and 44.60 for republics. Thus, the 2023 data show that monarchies, on average, performed better than republics on the Voice and Accountability indicator, although the substantial dispersion within both groups indicates considerable variation across countries.
Comparison of the “Voice and Accountability” Indicator Between Constitutional and Non-Constitutional Monarchies Worldwide
Descriptive Statistics
Type of Monarchy |
Number of Countries |
Mean |
Median |
Standard Deviation |
Constitutional Monarchies |
15 |
73.26 |
87.70 |
29.87 |
Semi-Constitutional and Absolute Monarchies |
13 |
34.68 |
28.90 |
25.20 |
The mean Voice and Accountability score is 73.26 among constitutional monarchies and 34.68 among semi-constitutional and absolute monarchies. Thus, constitutional monarchies score an average of 38.58 percentile points higher than the second group.
The median reveals an even larger difference. The median is 87.70 among constitutional monarchies and 28.90 among semi-constitutional and absolute monarchies. In other words, the median country among constitutional monarchies scores 58.80 percentile points higher than the median country in the second group.
Although both groups exhibit considerable dispersion, the difference between them is large enough to remain clearly visible despite this variation.
Test of the Difference in Means
To assess the statistical significance of the difference in means, Welch’s t-test was used.
Statistical Measure |
Value |
Mean difference (constitutional minus semi-constitutional and absolute) |
38.58 |
Welch’s t statistic |
3.71 |
Approximate degrees of freedom |
25.99 |
Two-tailed p-value |
0.0010 |
Welch’s test shows that the difference in the mean Voice and Accountability score between the two types of monarchy is highly statistically significant (p = 0.001). The hypothesis of equal means can therefore be rejected with a high degree of confidence.
Mann–Whitney Test
To ensure that the result does not depend on the assumptions of the parametric test, the nonparametric Mann–Whitney test was also conducted.
Statistical Measure |
Value |
U statistic |
163 |
Two-tailed p-value |
0.0027 |
The Mann–Whitney test likewise finds a highly statistically significant difference between the two groups (p = 0.0027), confirming the result of Welch’s test.
Conclusion
In 2023, constitutional monarchies performed substantially better than semi-constitutional and absolute monarchies on the Voice and Accountability indicator. Both the mean and the median are considerably higher among constitutional monarchies, and both Welch’s t-test and the Mann–Whitney test confirm the difference with very strong statistical evidence.
This finding indicates that the type of monarchy matters greatly for this indicator. Unlike many of the preceding indicators, for which the difference between the two types of monarchy was not statistically significant, constitutional monarchies perform significantly better than semi-constitutional and absolute monarchies in the area of political and civil liberties.
This result also helps explain why the overall comparison between monarchies and republics worldwide did not produce a statistically significant difference. Combining the two very different groups of constitutional and non-constitutional monarchies into a single category lowers the overall mean for monarchies. The comparison of “all monarchies” with republics therefore appears to provide an incomplete picture for this indicator.
In other words, the data show that constitutional monarchies, which constitute a major group among modern monarchies, not only perform far better than non-constitutional monarchies on the Voice and Accountability indicator, but also score substantially above the worldwide average for republics. Thus, the findings in this section are not inconsistent with the “New or Modern Monarchy” hypothesis; rather, they suggest that, for this indicator, constitutional constraints are an important factor associated with the realization of political and civil liberties.
Comparison of the “Voice and Accountability” Indicator Between Commonwealth Realms and Republics Worldwide
Descriptive Statistics
Form of Government |
Number of Countries |
Mean |
Median |
Standard Deviation |
Commonwealth Realms |
14 |
74.89 |
72.55 |
15.20 |
Republics Worldwide |
151 |
45.47 |
44.60 |
27.66 |
The mean Voice and Accountability score is 74.89 among the Commonwealth realms and 45.47 among republics worldwide. Thus, the Commonwealth realms score an average of 29.42 percentile points higher than republics.
The median shows the same pattern. The median is 72.55 among the Commonwealth realms and 44.60 among republics, meaning that the median Commonwealth realm scores approximately 27.95 percentile points higher than the median republic worldwide.
The standard deviation is also substantially lower among the Commonwealth realms (15.20) than among republics (27.66), indicating that the Commonwealth realms have not only achieved higher scores but have also displayed more consistent performance on this indicator.
Test of the Difference in Means
To assess the statistical significance of the difference in means, Welch’s t-test was used.
Statistical Measure |
Value |
Mean difference (Commonwealth realm minus republic) |
29.42 |
Welch’s t statistic |
6.34 |
Approximate degrees of freedom |
22.02 |
Two-tailed p-value |
0.0000022 |
Welch’s test shows that the difference in the mean Voice and Accountability score between the Commonwealth realms and republics worldwide is highly statistically significant (p < 0.001). The hypothesis of equal means can therefore be rejected with a very high degree of confidence.
Mann–Whitney Test
To ensure that the result does not depend on the assumptions of the parametric test, the nonparametric Mann–Whitney test was also conducted.
Statistical Measure |
Value |
U statistic |
1705 |
Two-tailed p-value |
0.000153 |
The Mann–Whitney test likewise finds a highly statistically significant difference between the two groups (p < 0.001), confirming the result of Welch’s test.
Conclusion
In 2023, the Commonwealth realms achieved substantially higher Voice and Accountability scores, on average, than republics worldwide. Both the mean and the median are considerably higher among the Commonwealth realms, and both Welch’s t-test and the Mann–Whitney test confirm the difference with very strong statistical evidence.
This result indicates that among countries that continue to retain the British monarch as their head of state, the level of political and civil liberties is, on average, substantially higher than among republics worldwide. Therefore, unlike the comparison of “all monarchies” with republics, in which no statistically significant difference was found because constitutional and non-constitutional monarchies were combined, the comparison between the Commonwealth realms and republics provides substantially stronger evidence in the direction predicted by the “New or Modern Monarchy” hypothesis.
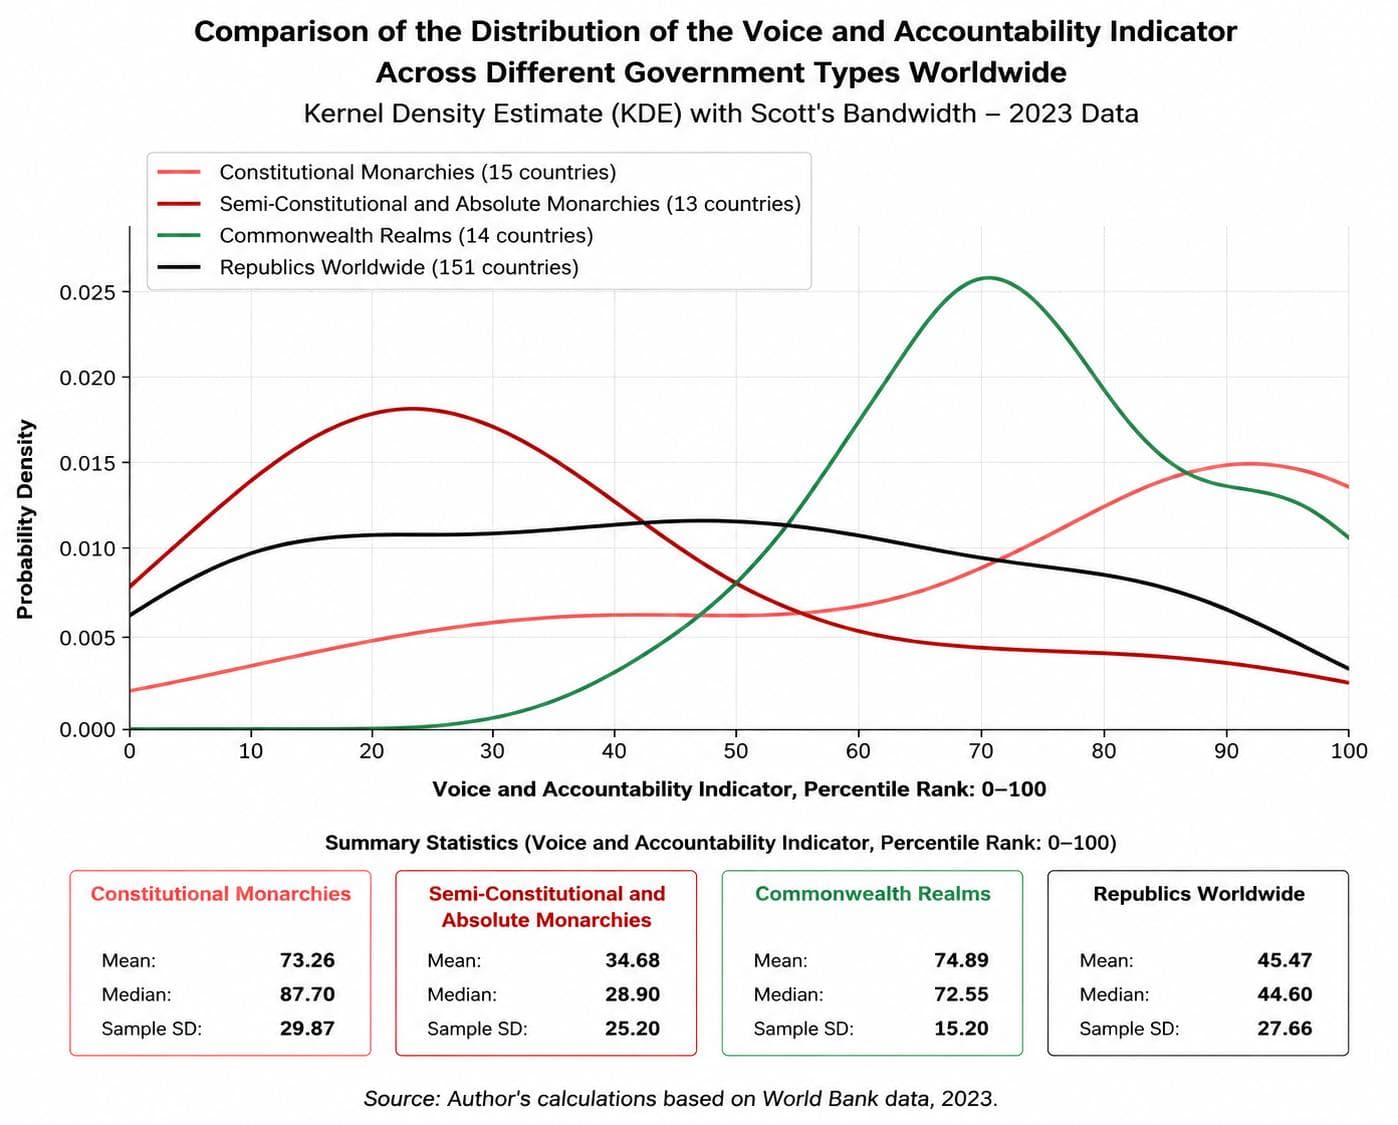
A closer look at the distribution of the Voice and Accountability indicator, together with the statistical results, reveals an important pattern. As expected, the distributions of constitutional monarchies and Commonwealth realms are concentrated largely on the right side of the chart, corresponding to higher levels of this indicator. By contrast, semi-constitutional and absolute monarchies have lower scores on average, which helps explain why the difference between monarchies as a whole and republics did not reach statistical significance.
However, these data do not allow us to conclude with confidence that the difference is caused simply by the non-constitutional character of these monarchies. The relatively wide dispersion of scores among semi-constitutional and absolute monarchies suggests that, unlike constitutional monarchies and Commonwealth realms, this group consists of a heterogeneous set of countries and that other factors may also contribute to their lower average score.
In other words, rather than establishing a causal relationship, the chart points to the possible presence of one or more hidden variables—factors that may be associated both with the type of monarchy and with performance on the Voice and Accountability indicator. The evidence in this section therefore shows only that semi-constitutional and absolute monarchies, as a group, perform less well than constitutional monarchies. Whether this difference is specifically attributable to the extent of the monarch’s powers, or whether other factors are involved, is a question that this study alone cannot answer conclusively.