

Monarchy & Republic in the Laboratory of History by N. Fakhr - HTML preview
Download the book in PDF, ePub for a complete version.
Comparison of the Human Development Index in Monarchies and Republics Across Continents and the Middle East
Comparison of the Human Development Index in Asian Monarchies and Republics
Descriptive Statistics
Type of Government |
Number of Countries |
Mean |
Median |
Standard Deviation |
Asian Monarchies |
13 |
0.816 |
0.823 |
0.096 |
Asian Republics |
32 |
0.716 |
0.725 |
0.121 |
The mean Human Development Index (HDI) score is 0.816 for Asian monarchies and 0.716 for Asian republics. Thus, Asian monarchies score approximately 0.101 points higher on average than the republics of the continent.
The median confirms the same pattern. The median HDI is 0.823 for monarchies and approximately 0.725 for republics, meaning that the median country among Asian monarchies scores about 0.099 points higher than the median country among Asian republics. The fact that both the mean and the median are higher indicates that the observed difference is not merely the result of a few highly developed monarchies, but is also evident at the center of the distributions.
The standard deviation is also lower among monarchies than among republics. Thus, in addition to their higher average HDI, Asian monarchies exhibit somewhat more consistent performance on this index.
Test of the Difference in Means
To assess the statistical significance of the difference in means, Welch’s t-test was used.
Statistical Measure |
Value |
Mean difference (Monarchies − Republics) |
0.101 |
Welch’s t statistic |
2.95 |
Approximate degrees of freedom |
27.93 |
Two-tailed p-value |
0.0063 |
95% confidence interval |
0.031 to 0.170 |
Hedges’ g |
0.87 |
Welch’s test indicates that the difference in mean HDI between Asian monarchies and republics is statistically significant (p = 0.0063). The 95% confidence interval lies entirely above zero, confirming that the direction of the difference favors monarchies.
Hedges’ g is 0.87, indicating a large effect. Thus, the observed difference is not only statistically significant but also substantial in practical terms.
Mann–Whitney Test
To ensure that the result does not depend solely on a comparison of means or on the assumptions of the parametric test, the nonparametric Mann–Whitney test was also performed.
Statistical Measure |
Value |
U statistic |
319 |
Two-tailed p-value |
0.0057 |
Rank-biserial correlation |
0.53 |
The Mann–Whitney test likewise indicates a statistically significant difference between the distributions of the two groups (p = 0.0057). The rank-biserial correlation of 0.53 also indicates a large effect, with monarchies generally occupying higher ranks.
Conclusion
In 2022, Asian monarchies had a higher Human Development Index than Asian republics in terms of both the mean and the median. Welch’s test and the Mann–Whitney test both confirm this difference with strong statistical evidence, and the effect size is also large.
This finding indicates that, on average, citizens of Asian monarchies enjoyed more favorable conditions in education, health, and standard of living, and consequently greater opportunities and capabilities to choose and shape the course of their lives. Therefore, the results of the Asian comparison are also consistent with the prediction of the “New or Modern Monarchy” hypothesis; however, this comparison alone does not establish a causal relationship between type of government and human development.
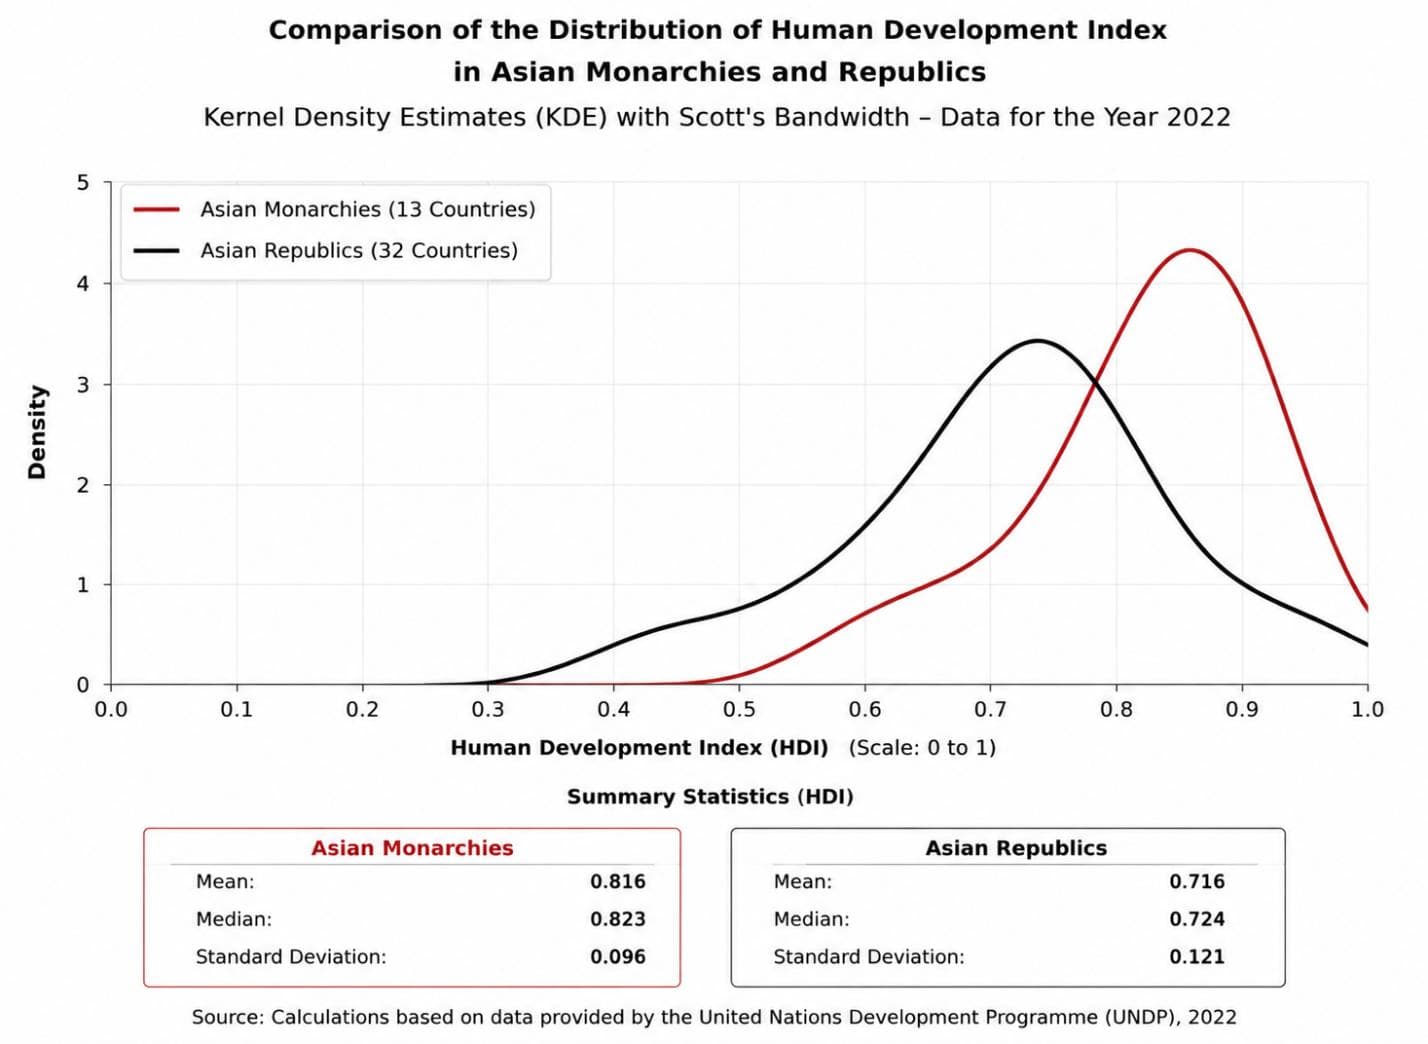
The kernel density estimate (KDE) shows that the distribution of Asian monarchies on the Human Development Index is noticeably shifted toward higher scores, with the greatest concentration among countries with high levels of human development. In contrast, Asian republics not only have lower scores on average but also exhibit greater dispersion, spanning a wider range of human development levels.
This pattern is consistent with the descriptive statistics: the mean and median HDI scores for Asian monarchies are 0.816 and 0.823, respectively, compared with 0.716 and 0.724 for Asian republics. Thus, the 2022 data indicate that, on average, Asian monarchies have a higher level of human development than the republics of the continent.
Comparison of the Human Development Index in European Monarchies and Republics
Descriptive Statistics
Type of Government |
Number of Countries |
Mean |
Median |
Standard Deviation |
European Monarchies |
10 |
0.936 |
0.942 |
0.024 |
European Republics |
33 |
0.868 |
0.879 |
0.063 |
The mean Human Development Index (HDI) score is 0.936 for European monarchies and 0.868 for European republics. Thus, European monarchies score 0.068 points higher on average than European republics.
The median confirms the same pattern. The median HDI is 0.942 for monarchies and 0.879 for republics, meaning that the median country among European monarchies scores 0.063 points higher than the median country among European republics.
The standard deviation is also substantially lower among monarchies (0.024) than among republics (0.063). This indicates that European monarchies not only have a very high level of human development but also exhibit more consistent performance.
Test of the Difference in Means
To assess the statistical significance of the difference in means, Welch’s t-test was used.
Statistical Measure |
Value |
Mean difference (Monarchies − Republics) |
0.068 |
Welch’s t statistic |
5.182 |
Approximate degrees of freedom |
38.76 |
Two-tailed p-value |
0.000007 |
Hedges’ g |
1.19 |
Welch’s test indicates that the difference in mean HDI between European monarchies and republics is highly statistically significant (p < 0.001).
Hedges’ g is 1.19, indicating a very large effect. Thus, the observed difference is not only statistically significant but also substantial in practical terms.
Mann–Whitney Test
To ensure that the result does not depend on the assumptions of the parametric test, the nonparametric Mann–Whitney test was also performed.
Statistical Measure |
Value |
U statistic |
280 |
Two-tailed p-value |
0.0010 |
Rank-biserial correlation |
0.697 |
The Mann–Whitney test also indicates a highly statistically significant difference between the two groups (p = 0.0010). The rank-biserial correlation of 0.697 indicates a large effect and a clear tendency for European monarchies to occupy higher ranks on this index.
Conclusion
In 2022, European monarchies performed better than European republics on the Human Development Index. Both the mean and median HDI scores are higher among monarchies, and both Welch’s test and the Mann–Whitney test confirm the difference with very strong statistical evidence.
This finding indicates that, on average, citizens of European monarchies enjoyed more favorable conditions in education, health, and standard of living, and that the observed advantage is substantial not only statistically but also in practical terms. Therefore, the European data for this index are also consistent with the prediction of the “New or Modern Monarchy” hypothesis.
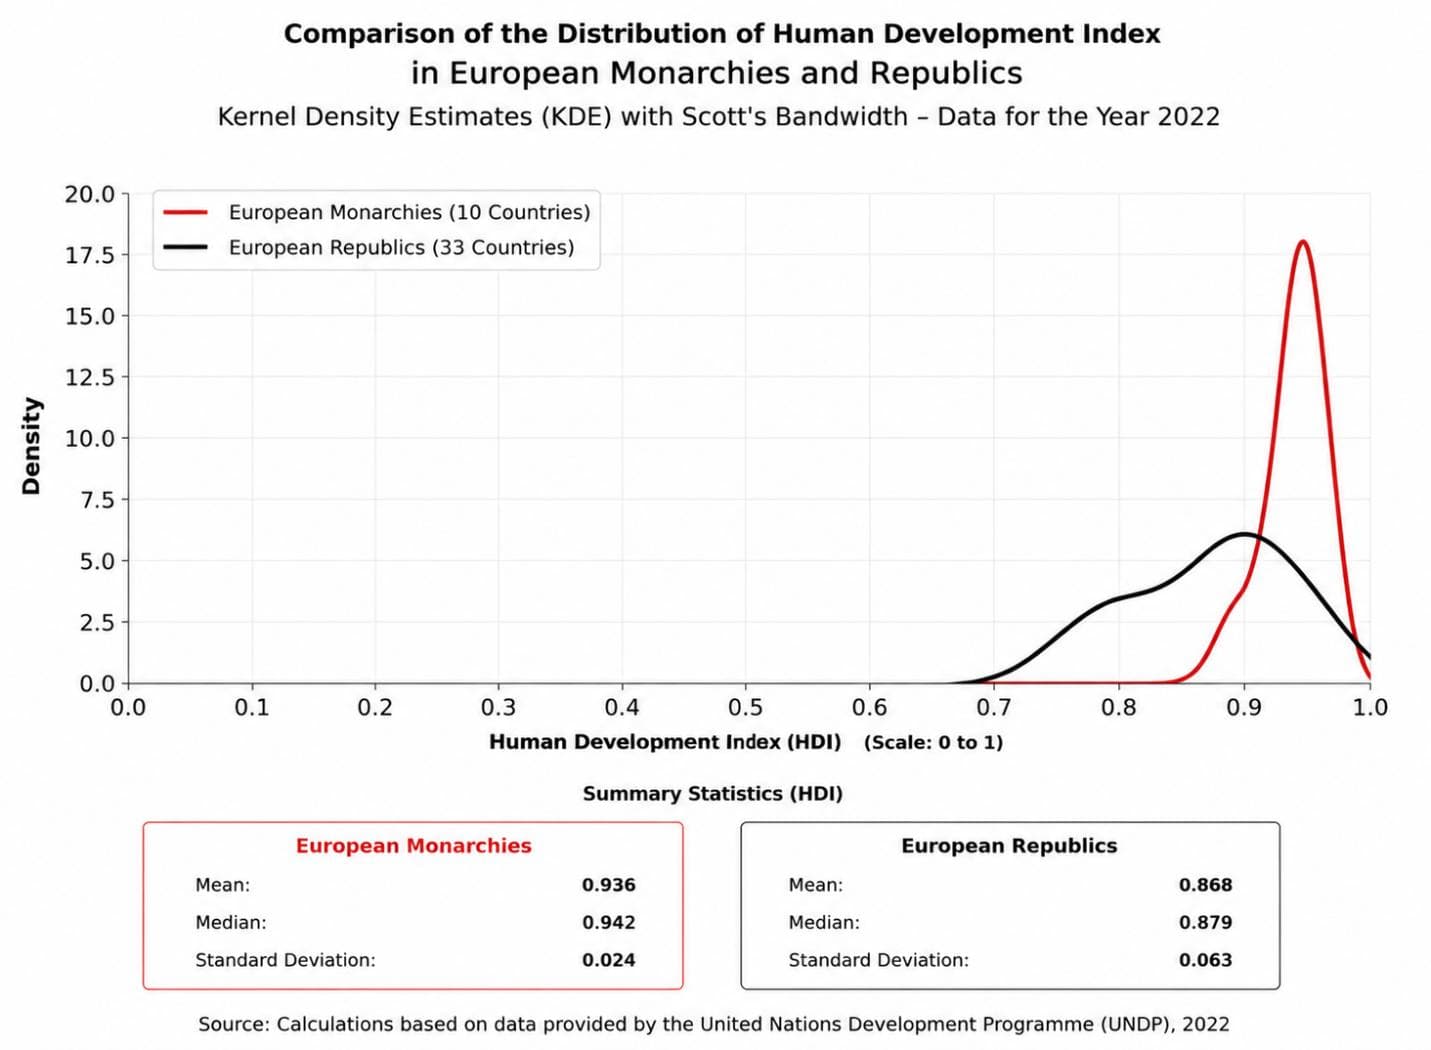
The kernel density estimate (KDE) plot shows that the distribution of European monarchies on the Human Development Index is concentrated almost entirely at the very high end of the index, with relatively little dispersion. This indicates a comparatively consistent level of very high human development across these countries. European republics, by contrast, also perform well overall, but their distribution is broader: alongside countries with very high human development, a number of republics are found at lower levels of the index.
This pattern is consistent with the descriptive statistics. The mean and median HDI values for European monarchies are 0.936 and 0.942, respectively, compared with 0.868 and 0.879 for European republics. Thus, the 2022 data indicate that European monarchies, on average, have a higher level of human development than the republics of the continent.
Comparison of the Human Development Index in European Monarchies and European Republics That Have Never Been Communist
Descriptive Statistics
Type of Government |
Number of Countries |
Mean |
Median |
Standard Deviation |
European Monarchies |
10 |
0.936 |
0.942 |
0.024 |
Never-Communist European Republics |
13 |
0.920 |
0.915 |
0.032 |
The mean Human Development Index is 0.936 among European monarchies and 0.920 among European republics that have never experienced communist rule. Thus, European monarchies score, on average, 0.016 points higher than this group of republics.
The median points in the same direction. The median is 0.942 among monarchies and 0.915 among never-communist republics, meaning that the median country among European monarchies scores 0.027 points higher than the median country among the never-communist republics.
The standard deviation is also lower among monarchies (0.024) than among the never-communist republics (0.032), indicating that European monarchies exhibit slightly more consistent performance on this index.
Test of the Difference in Means
To assess the statistical significance of the difference in means, Welch’s t-test was used.
Statistical Measure |
Value |
Mean difference (Monarchies − Republics) |
0.016 |
Welch’s t statistic |
1.361 |
Approximate degrees of freedom |
20.99 |
Two-tailed p-value |
0.188 |
Hedges’ g |
0.53 |
Welch’s test indicates that the difference in mean HDI between European monarchies and never-communist European republics is not statistically significant (p = 0.188). Although the mean difference favors monarchies, the evidence is insufficient to reject the hypothesis of equal means.
Hedges’ g is 0.53, indicating a medium-sized effect.
Mann–Whitney Test
To ensure that the result does not depend on the assumptions of the parametric test, the nonparametric Mann–Whitney test was also conducted.
Statistical Measure |
Value |
U statistic |
84 |
Two-tailed p-value |
0.251 |
The Mann–Whitney test likewise does not indicate a statistically significant difference between the two groups (p = 0.251), reinforcing the conclusion of Welch’s test.
Conclusion
In 2022, European monarchies had a higher average Human Development Index than European republics that had never experienced communist rule, and both the mean and median were higher among monarchies. However, neither Welch’s test nor the Mann–Whitney test found the difference to be statistically significant.
Comparison of the Human Development Index in Africa, the Americas, and Oceania
As with the previous indicators, this section compares monarchies and Commonwealth realms with republics in the same continent. Because the number of monarchies and Commonwealth realms is very small in some of these regions, the analysis is limited to descriptive statistics and no inferential statistical tests are conducted.
Africa
Type of Government |
Number of Countries |
Mean |
Median |
Standard Deviation |
African Monarchies |
3 |
0.610 |
0.610 |
0.072 |
African Republics |
50 |
0.552 |
0.537 |
0.110 |
In Africa, the mean Human Development Index among the three monarchies (0.610) is higher than the mean among the continent’s republics (0.552). The median points in the same direction.
The Americas
Type of Government |
Number of Countries |
Mean |
Median |
Standard Deviation |
Commonwealth Realms in the Americas |
9 |
0.791 |
0.793 |
0.071 |
Republics in the Americas |
26 |
0.751 |
0.761 |
0.081 |
In the Americas, Commonwealth realms also have a higher average Human Development Index than the republics of the continent. The mean is 0.791 among Commonwealth realms and 0.751 among republics.
Oceania
Type of Government |
Number of Countries |
Mean |
Median |
Standard Deviation |
Oceanian Monarchy |
1 |
0.739 |
0.739 |
— |
Commonwealth Realms in Oceania |
5 |
0.734 |
0.653 |
0.174 |
Oceanian Republics |
9 |
0.677 |
0.696 |
0.068 |
In Oceania, the region’s only independent monarchy, Tonga, also has an HDI score above the average for Oceanian republics. The mean among Commonwealth realms in Oceania (0.734) is likewise higher than the mean among the region’s republics (0.677). However, because the number of monarchies and Commonwealth realms is very limited, these results are strictly descriptive, and no statistical tests are conducted for this section.
Comparison of the Human Development Index in Middle Eastern Monarchies and Republics
Descriptive Statistics
Type of Government |
Number of Countries |
Mean |
Median |
Standard Deviation |
Middle Eastern Monarchies |
7 |
0.854 |
0.875 |
0.063 |
Middle Eastern Republics |
10 |
0.728 |
0.726 |
0.153 |
The mean Human Development Index is 0.854 among Middle Eastern monarchies and 0.728 among the region’s republics. Thus, monarchies score approximately 0.126 points higher on average than republics.
The median points in the same direction. The median is 0.875 among monarchies and approximately 0.726 among republics, meaning that the median country among Middle Eastern monarchies scores nearly 0.150 points higher than the median country among the region’s republics.
The standard deviation among republics is also more than twice that of monarchies. This indicates that human-development outcomes among Middle Eastern republics are considerably more dispersed, whereas monarchies are concentrated at a higher and relatively more consistent level.
Test of the Difference in Means
To assess the statistical significance of the difference in means, Welch’s t-test was used.
Statistical Measure |
Value |
Mean difference (Monarchies − Republics) |
0.126 |
Welch’s t statistic |
2.335 |
Approximate degrees of freedom |
12.80 |
Two-tailed p-value |
0.0365 |
95% confidence interval |
0.009 to 0.243 |
Hedges’ g |
0.96 |
Welch’s test indicates that the difference in mean HDI between Middle Eastern monarchies and republics is statistically significant at the 5% level (p = 0.037). The 95% confidence interval lies entirely above zero, although its lower bound is close to zero.
Hedges’ g is 0.96, indicating a large effect. Thus, the observed difference is substantial in practical terms as well as statistically significant.
Mann–Whitney Test
To ensure that the result does not depend solely on the comparison of means or on the assumptions of the parametric test, the nonparametric Mann–Whitney test was also conducted.
Statistical Measure |
Value |
U statistic |
54 |
Two-tailed p-value |
0.071 |
Rank-biserial correlation |
0.54 |
The Mann–Whitney test does not reach statistical significance at the 5% level (p = 0.071), although the p-value is relatively close to the conventional threshold. The rank-biserial correlation of 0.54 nevertheless indicates a large effect favoring monarchies.
Conclusion
In 2022, Middle Eastern monarchies had a higher Human Development Index than the region’s republics in terms of both the mean and the median. Welch’s test indicates that the difference is statistically significant at the 5% level, with a large effect size. The Mann–Whitney test does not reach the 5% significance threshold, but both the direction of the result and its effect size still favor monarchies.
Overall, the Middle Eastern data indicate that monarchies in the region were, on average, in a more favorable position across the key dimensions of human development—health, education, and standard of living. From the perspective adopted in this chapter, this result is also consistent with the prediction of the “New or Modern Monarchy” hypothesis.
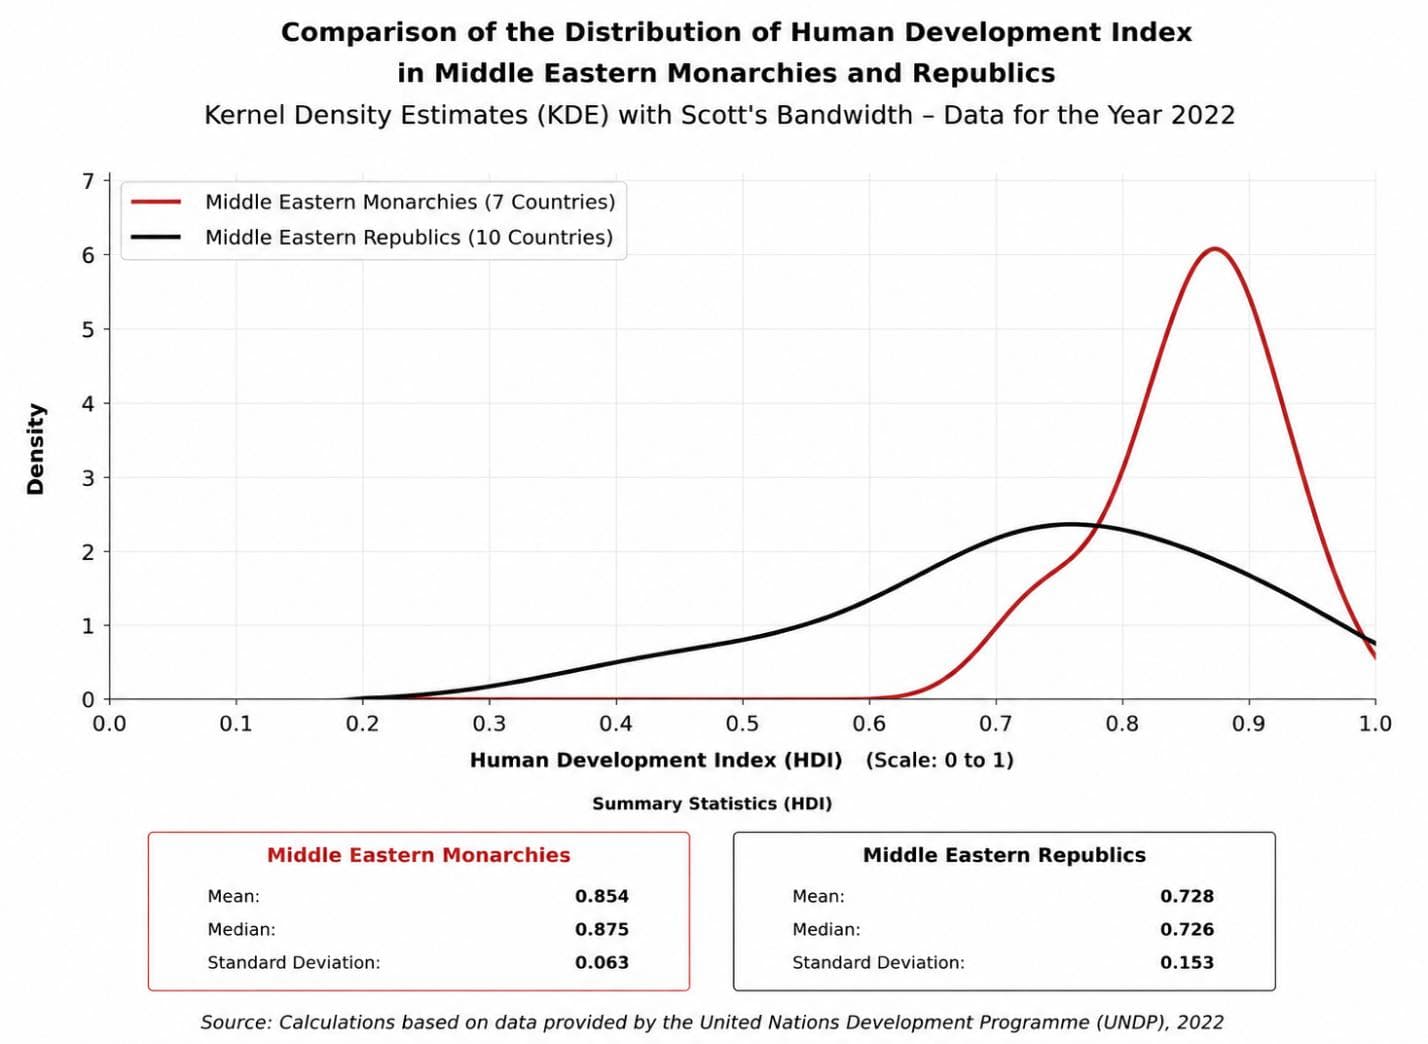
The kernel density estimate (KDE) plot shows that the distribution of Middle Eastern monarchies on the Human Development Index is noticeably shifted toward higher scores, with most of these countries falling within the “very high human development” category. Middle Eastern republics, by contrast, display considerably greater dispersion and span a much wider range of human development levels, from low to very high.
This pattern is also consistent with the descriptive statistics. The mean and median HDI values for Middle Eastern monarchies are 0.854 and 0.875, respectively, compared with 0.728 and 0.726 for the region’s republics. Thus, the 2022 data indicate that Middle Eastern monarchies, on average, have a higher level of human development than the region’s republics.
Status of the “New or Modern Monarchy” Hypothesis After the Twelfth Indicator
With the addition of the Human Development Index, the status of the “New or Modern Monarchy” hypothesis at this stage is as follows:
Test |
Indicator |
Result |
✓ |
GDP per Capita |
Consistent with the hypothesis |
✓ |
Purchasing Power per Capita |
Consistent with the hypothesis |
◐ |
Gini Coefficient |
Mixed evidence; difference favors the hypothesis |
✓ |
Political Stability and Absence of Violence |
Consistent with the hypothesis |
✓ |
Regulatory Quality |
Consistent with the hypothesis |
✓ |
Rule of Law |
Consistent with the hypothesis |
✓ |
Government Effectiveness |
Consistent with the hypothesis |
✓ |
Inflation |
Consistent with the hypothesis |
✓ |
Control of Corruption |
Consistent with the hypothesis |
✓ |
Corruption Perceptions |
Consistent with the hypothesis |
✓ |
Property Rights |
Consistent with the hypothesis |
✓ |
Human Development |
Consistent with the hypothesis |
At this stage, the “New or Modern Monarchy” hypothesis has been tested against twelve independent indicators. These indicators cover a range of the most important goals of government, from welfare and order to justice and now liberty. They have also been produced by reputable and independent international institutions, including the World Bank, the United Nations Development Programme (UNDP), Transparency International, and other international organizations.
For the Human Development Index, as with the Property Rights Index, monarchies have, on average, outperformed republics in the global, Asian, European, and Middle Eastern comparisons. Thus, the second indicator associated with the goal of “liberty” also points in the direction predicted by the hypothesis.
Overall, none of the twelve indicators examined so far has produced a result inconsistent with the “New or Modern Monarchy” hypothesis. As emphasized throughout this study, however, these findings do not establish a causal relationship between form of government and quality of governance. Rather, they indicate that the empirical evidence from all the tests conducted up to this point has been consistent with the predictions of the hypothesis.