

Monarchy & Republic in the Laboratory of History by N. Fakhr - HTML preview
Download the book in PDF, ePub for a complete version.
Human Development
In the previous section, we noted that governments can expand citizens’ liberty by recognizing their rights. However, simply possessing a right does not always mean that one has the practical ability to exercise it.
Suppose a girl has the legal right to education, but there is no school where she lives, or her family cannot afford to send her to school. In such a situation, although her right is legally recognized, she lacks the practical opportunity to exercise it, and her liberty to choose remains constrained.
Therefore, a government seeking to expand the liberty of its citizens should not merely recognize their rights; it should also help create the conditions and opportunities necessary for people to exercise those rights. Real liberty requires both the existence of a right and the practical ability to exercise that right.
One of the best-known measures relevant to this dimension of human well-being is the Human Development Index (HDI), published by the United Nations Development Programme (UNDP).
The index combines three fundamental dimensions:
- Life expectancy (health)
- Education
- Standard of living
The United Nations Development Programme does not equate human development simply with increases in wealth and income. Rather, it relates human development to the expansion of people’s capabilities and opportunities to lead lives they have reason to value. The Human Development Index measures three fundamental dimensions of this process: a long and healthy life, access to knowledge, and a decent standard of living. Since this book relates liberty to the expansion of people’s range of real choices, the HDI can serve as an appropriate measure of the conditions and capabilities that expand people’s practical ability to exercise liberty.
As we continue testing the “New or Modern Monarchy” hypothesis, we now examine whether monarchies and republics differ in their performance in providing citizens with the conditions and capabilities that enable them to pursue different paths in life.
The data in this section are for 2022 (Appendix RDS-L01). A higher HDI value indicates more favorable conditions in education, health, and standard of living.
Comparison of the Human Development Index in Monarchies and Republics Worldwide
Descriptive Statistics
Type of Government |
Number of Countries |
Mean |
Median |
Standard Deviation |
Monarchies |
27 |
0.835 |
0.875 |
0.124 |
Republics |
150 |
0.698 |
0.727 |
0.153 |
The mean Human Development Index is 0.835 for monarchies and 0.698 for republics. Thus, the mean for monarchies is approximately 0.137 points higher than that for republics.
The medians show the same pattern. The median HDI is 0.875 among monarchies and 0.727 among republics, meaning that the median country among monarchies scores approximately 0.149 points higher than the median country among republics. The fact that both the mean and the median are higher indicates that the observed difference is not merely the result of a few exceptionally highly developed monarchies; it is also evident at the center of the distributions.
The standard deviation is also somewhat lower among monarchies than among republics. Thus, in addition to their higher overall level, the performance of monarchies on this index is somewhat more consistent.
Test of the Difference in Means
To assess the statistical significance of the difference in means, Welch’s t-test was used.
Statistical Measure |
Value |
Mean difference (Monarchy − Republic) |
0.137 |
Welch’s t statistic |
5.07 |
Approximate degrees of freedom |
41.72 |
Two-tailed p-value |
0.0000087 |
95% confidence interval |
0.082 to 0.191 |
Hedges’ g |
0.91 |
Welch’s test shows that the difference in mean HDI between monarchies and republics worldwide is highly statistically significant (p < 0.001). The 95% confidence interval lies entirely above zero, confirming that the direction of the difference favors monarchies.
Hedges’ g is 0.91, indicating a large effect. The observed difference is therefore not only statistically significant but also substantial in practical terms.
Mann–Whitney Test
To ensure that the result does not depend solely on a comparison of means or on the assumptions of a parametric test, the nonparametric Mann–Whitney test was also conducted.
Statistical Measure |
Value |
U statistic |
3089.5 |
Two-tailed p-value |
0.000014 |
Rank-biserial correlation |
0.53 |
The Mann–Whitney test likewise confirms a difference between the distributions of the two groups with very strong statistical evidence (p < 0.001). The rank-based effect size of 0.53 also indicates a large difference, with monarchies generally occupying higher ranks.
Conclusion
In 2022, monarchies worldwide had a higher Human Development Index than republics in terms of both the mean and the median. Welch’s t-test and the Mann–Whitney test both confirm this difference with very strong statistical evidence, and the effect sizes are also large.
This result indicates that monarchies, on average, were in a more favorable position across the three fundamental dimensions of human development—health, education, and standard of living—dimensions that expand individuals’ capacity to enjoy a wider range of real options in life. From this perspective, the Human Development Index also yields a result consistent with the prediction of the “New or Modern Monarchy” hypothesis. As with the other comparisons in this book, however, this finding alone does not establish a causal relationship between regime type and human development.
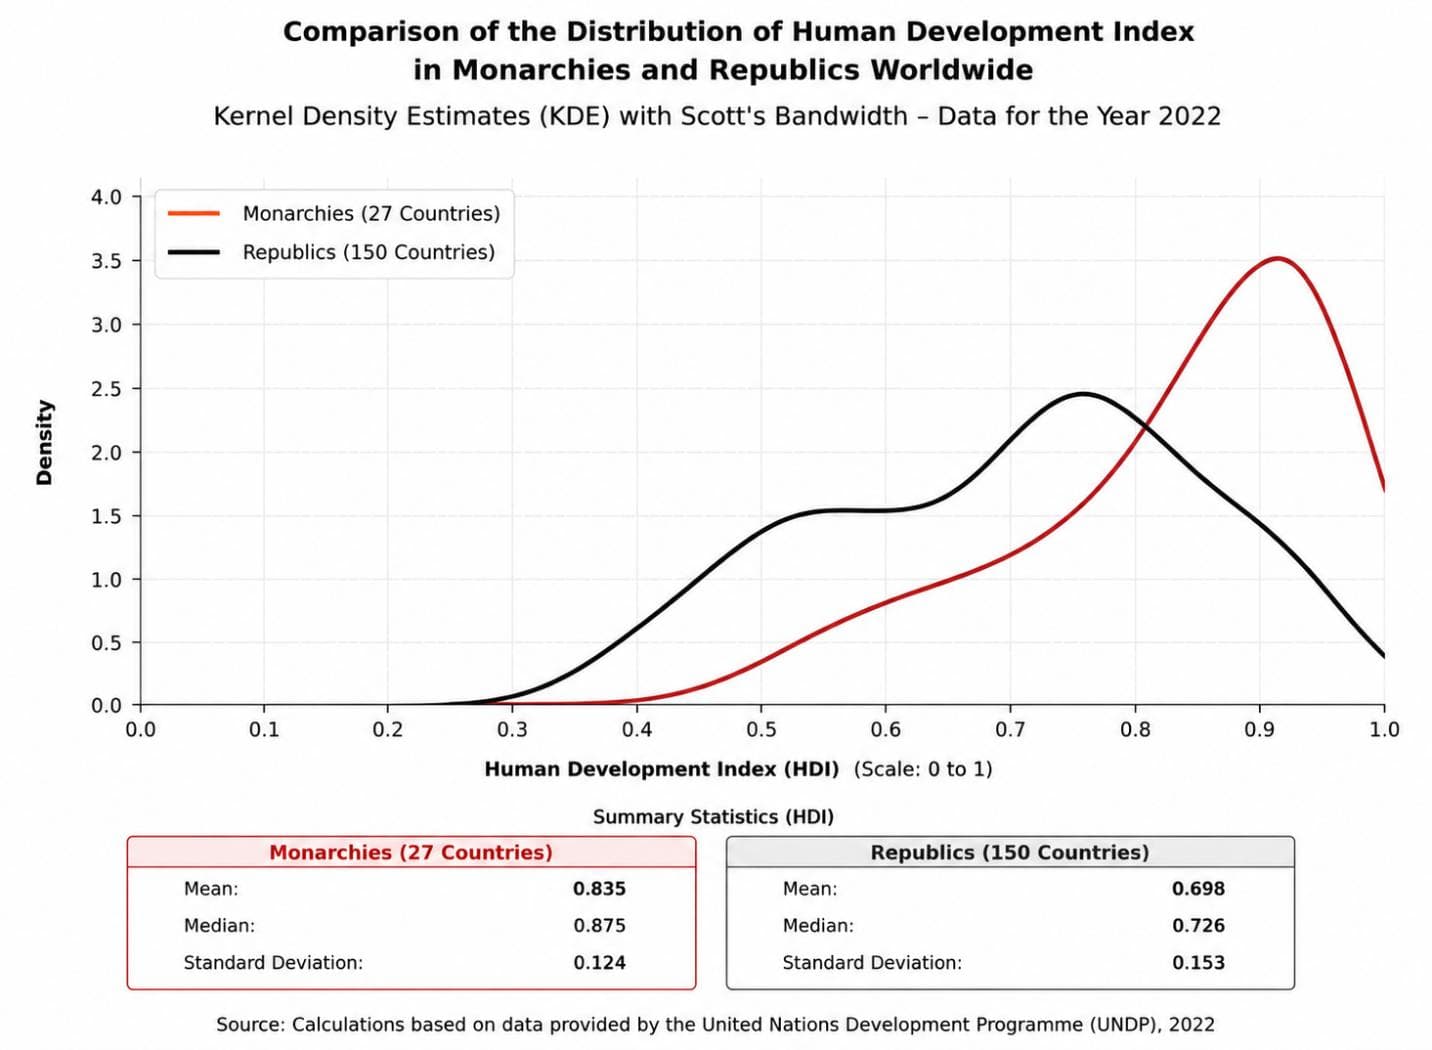
The kernel density estimate (KDE) shows that the distribution of monarchies worldwide on the Human Development Index is noticeably shifted toward higher scores, with the greatest concentration among countries with high and very high levels of human development. In contrast, the distribution of republics is not only concentrated at lower levels but also exhibits greater dispersion, spanning a wider range of HDI values.
This pattern is consistent with the descriptive statistics: the mean and median HDI scores for monarchies are 0.835 and 0.875, respectively, compared with 0.698 and 0.726 for republics. Thus, the 2022 data indicate that, on average, monarchies performed better than republics on the Human Development Index
Comparison of the Human Development Index in Constitutional and Non-Constitutional Monarchies Worldwide
Descriptive Statistics
Type of Monarchy |
Number of Countries |
Mean |
Median |
Standard Deviation |
Constitutional monarchies |
15 |
0.854 |
0.920 |
0.137 |
Semi-constitutional and absolute monarchies |
12 |
0.811 |
0.835 |
0.106 |
The mean Human Development Index is 0.854 among constitutional monarchies and 0.811 among semi-constitutional and absolute monarchies. Thus, constitutional monarchies score, on average, 0.043 points higher than the second group.
The medians point in the same direction. The median is 0.920 among constitutional monarchies and 0.835 among semi-constitutional and absolute monarchies. In other words, the median country among constitutional monarchies scores 0.085 points higher than the median country in the second group.
The standard deviations of the two groups are relatively similar (0.137 and 0.106, respectively), indicating no substantial difference in the dispersion of their scores.
Test of the Difference in Means
To assess the statistical significance of the difference in means, Welch’s t-test was used.
Statistical Measure |
Value |
Mean difference (Constitutional − Semi-constitutional and Absolute) |
0.043 |
Welch’s t statistic |
0.910 |
Approximate degrees of freedom |
24.99 |
Two-tailed p-value |
0.3713 |
Welch’s test shows that the difference in mean HDI between the two types of monarchy is not statistically significant (p = 0.371). Based on the available data, therefore, we cannot conclude that the type of monarchy alone is associated with a statistically significant difference in this index.
Mann–Whitney Test
To ensure that the result does not depend on the assumptions of the parametric test, the nonparametric Mann–Whitney test was also conducted.
Statistical Measure |
Value |
U statistic |
120.5 |
Two-tailed p-value |
0.1431 |
The Mann–Whitney test leads to the same conclusion, finding no statistically significant difference between the two groups (p = 0.143).
Conclusion
In 2022, constitutional monarchies had a higher average Human Development Index than semi-constitutional and absolute monarchies, and both the mean and the median were higher. However, neither Welch’s test nor the Mann–Whitney test confirms that this difference is statistically significant.
Thus, as with most of the previous indicators, the Human Development Index provides insufficient statistical evidence of a significant difference between the two types of monarchy. The results indicate that both groups of monarchies, regardless of the extent to which the monarch’s powers are constitutionally limited, have relatively high levels of human development, and the observed difference is insufficient to support a definitive conclusion. As elsewhere in this book, this finding reports an observational relationship and should not be interpreted as evidence of causation.
Comparison of the Human Development Index in Commonwealth Realms and Republics Worldwide
Descriptive Statistics
Type of Government |
Number of Countries |
Mean |
Median |
Standard Deviation |
Commonwealth realms |
14 |
0.770 |
0.783 |
0.126 |
Republics |
150 |
0.698 |
0.727 |
0.153 |
The mean Human Development Index is 0.770 among Commonwealth realms and 0.698 among republics worldwide. Thus, Commonwealth realms score, on average, 0.072 points higher than republics.
The medians point in the same direction. The median is 0.783 among Commonwealth realms and 0.727 among republics, meaning that the median Commonwealth realm scores approximately 0.056 points higher than the median republic.
The standard deviation is also slightly lower among Commonwealth realms (0.126) than among republics (0.153), although the dispersion of the two groups is relatively similar.
Test of the Difference in Means
To assess the statistical significance of the difference in means, Welch’s t-test was used.
Statistical Measure |
Value |
Mean difference (Commonwealth − Republic) |
0.072 |
Welch’s t statistic |
2.001 |
Approximate degrees of freedom |
16.81 |
Two-tailed p-value |
0.0618 |
Hedges’ g |
0.47 |
Welch’s test shows that although the mean HDI is higher among Commonwealth realms than among republics worldwide, the difference is not statistically significant at the conventional 5% level (p = 0.0618). Nevertheless, the p-value is relatively close to the significance threshold, and Hedges’ g (0.47) indicates a medium-sized effect.
Mann–Whitney Test
To ensure that the result does not depend on the assumptions of the parametric test, the nonparametric Mann–Whitney test was also conducted.
Statistical Measure |
Value |
U statistic |
1326.5 |
Two-tailed p-value |
0.1043 |
Rank-biserial correlation |
0.26 |
The Mann–Whitney test likewise does not find the difference between the two groups statistically significant at the 5% level (p = 0.1043). The rank-biserial correlation of 0.26 indicates a small-to-medium effect.
Conclusion
In 2022, Commonwealth realms had a higher average Human Development Index than republics worldwide, with the same advantage also appearing in the median. However, neither Welch’s test nor the Mann–Whitney test confirms that the difference is statistically significant at the 5% level.
Thus, although the direction of the difference is consistent with the prediction of the “New or Modern Monarchy” hypothesis, the statistical evidence in this comparison is insufficient for a definitive conclusion and should be interpreted more cautiously than the results of some of the previous indicators.
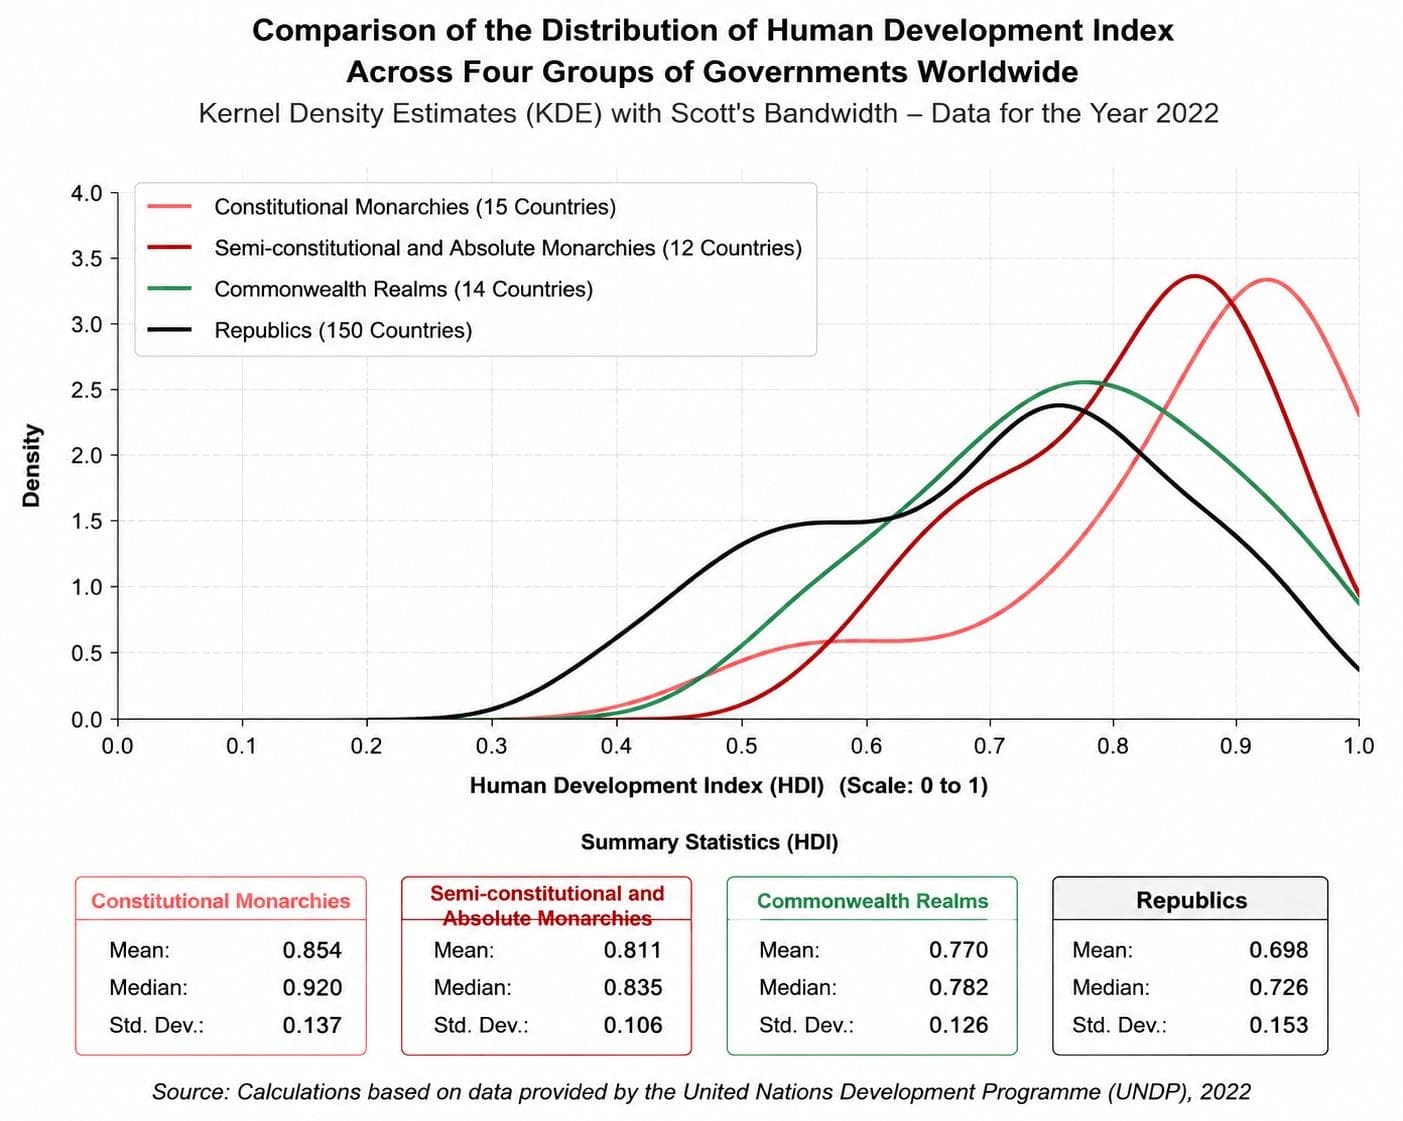
The kernel density estimate (KDE) shows that constitutional monarchies have, overall, the highest level of human development, with their distribution more heavily concentrated at very high HDI scores than those of the other groups. Semi-constitutional and absolute monarchies, although positioned at a somewhat lower level, also perform better on average than Commonwealth realms and republics. Commonwealth realms occupy an intermediate position, while the distribution of republics worldwide is shifted toward lower scores and exhibits greater dispersion.
Overall, this pattern indicates that all three monarchy-related groups have higher average Human Development Index scores than republics.