

Monarchy & Republic in the Laboratory of History by N. Fakhr - HTML preview
Download the book in PDF, ePub for a complete version.
Corruption Perceptions
In the previous section, we examined countries’ performance using the World Bank’s Control of Corruption indicator. That indicator assesses the extent to which governments are able to limit the abuse of public power and control corruption.
We now examine the same issue from a different perspective. The Corruption Perceptions Index (CPI), published annually by Transparency International, assesses the perceived level of public-sector corruption based on evaluations by experts and businesspeople. The index reflects perceptions of corruption in the public sector and the abuse of public power for private gain, and is one of the most widely recognized international measures of public-sector corruption.
If the “New or Modern Monarchy” hypothesis is correct, modern monarchies would be expected, contrary to the conventional image of historical monarchies, to be associated with lower levels of corruption and abuse of public power and to perform better in this respect than republics in their respective regions.
The data used in this section are from the 2023 Corruption Perceptions Index (Appendix RDS-J01). A higher score on this index indicates lower perceived corruption and therefore better performance in preventing the abuse of public power.
Global Comparison of the “Corruption Perceptions” Indicator between Monarchies and Republics
Descriptive Statistics
Type of Government |
Number of Countries |
Mean |
Median |
Standard Deviation |
Monarchies |
24 |
57.79 |
59.00 |
18.86 |
Republics |
141 |
39.24 |
36.00 |
16.94 |
The mean Corruption Perceptions Index score is 57.79 among the world’s monarchies and 39.24 among the world’s republics. Thus, monarchies score, on average, 18.55 points higher than republics; in other words, perceived corruption is lower among monarchies than among republics.
The medians point in the same direction. The median score is 59 among monarchies and 36 among republics. Thus, the median monarchy scores 23 points higher than the median republic. This indicates that the observed advantage of monarchies is not confined to a few exceptional countries but is also evident across the broader distribution of the data.
Dispersion is also relatively similar in the two groups. The standard deviation is 18.86 among monarchies and 16.94 among republics. The difference between the two group means therefore cannot be attributed simply to a difference in the dispersion of their scores.
Test of the Difference in Means
To assess whether the difference between the two group means is statistically significant, Welch’s t-test was used.
Statistical Measure |
Value |
Mean difference (Monarchies − Republics) |
18.55 |
Welch’s t-statistic |
4.52 |
Approximate degrees of freedom |
29.65 |
Two-tailed p-value |
0.00009 |
95% confidence interval |
10.16 to 26.94 |
Hedges’ g |
1.07 |
Welch’s test indicates that the difference in mean Corruption Perceptions Index scores between monarchies and republics worldwide is highly statistically significant (p < 0.001). The entire 95% confidence interval also lies above zero, supporting the observed higher mean score among monarchies.
Hedges’ g is 1.07, indicating a large effect size. Thus, the observed difference is not only statistically significant but also substantial in magnitude.
Mann–Whitney U Test
To ensure that the conclusion does not depend solely on the assumptions of the parametric test, the nonparametric Mann–Whitney U test was also conducted.
Statistical Measure |
Value |
Mann–Whitney U statistic |
2613.5 |
Two-tailed p-value |
0.00002 |
Rank-biserial correlation |
0.54 |
The Mann–Whitney U test also confirms a difference between the two groups with very strong statistical evidence (p < 0.001). The rank-biserial correlation of 0.54 indicates a large effect size, showing that Corruption Perceptions Index scores among monarchies generally occupy higher ranks than those among republics.
Conclusion
In 2023, the world’s monarchies performed substantially better than the world’s republics on the Corruption Perceptions Index. Both the mean and median scores were considerably higher among monarchies, and both Welch’s t-test and the Mann–Whitney U test provide very strong statistical evidence of a difference between the two groups. The large effect sizes from both analyses further indicate that the observed difference is substantial in magnitude, rather than merely statistically significant.
Overall, the data examined in this study show that monarchies had lower levels of perceived public-sector corruption than republics. As in the other chapters of this book, this finding represents an observational association and does not, by itself, establish a causal relationship between the form of government and the level of corruption.
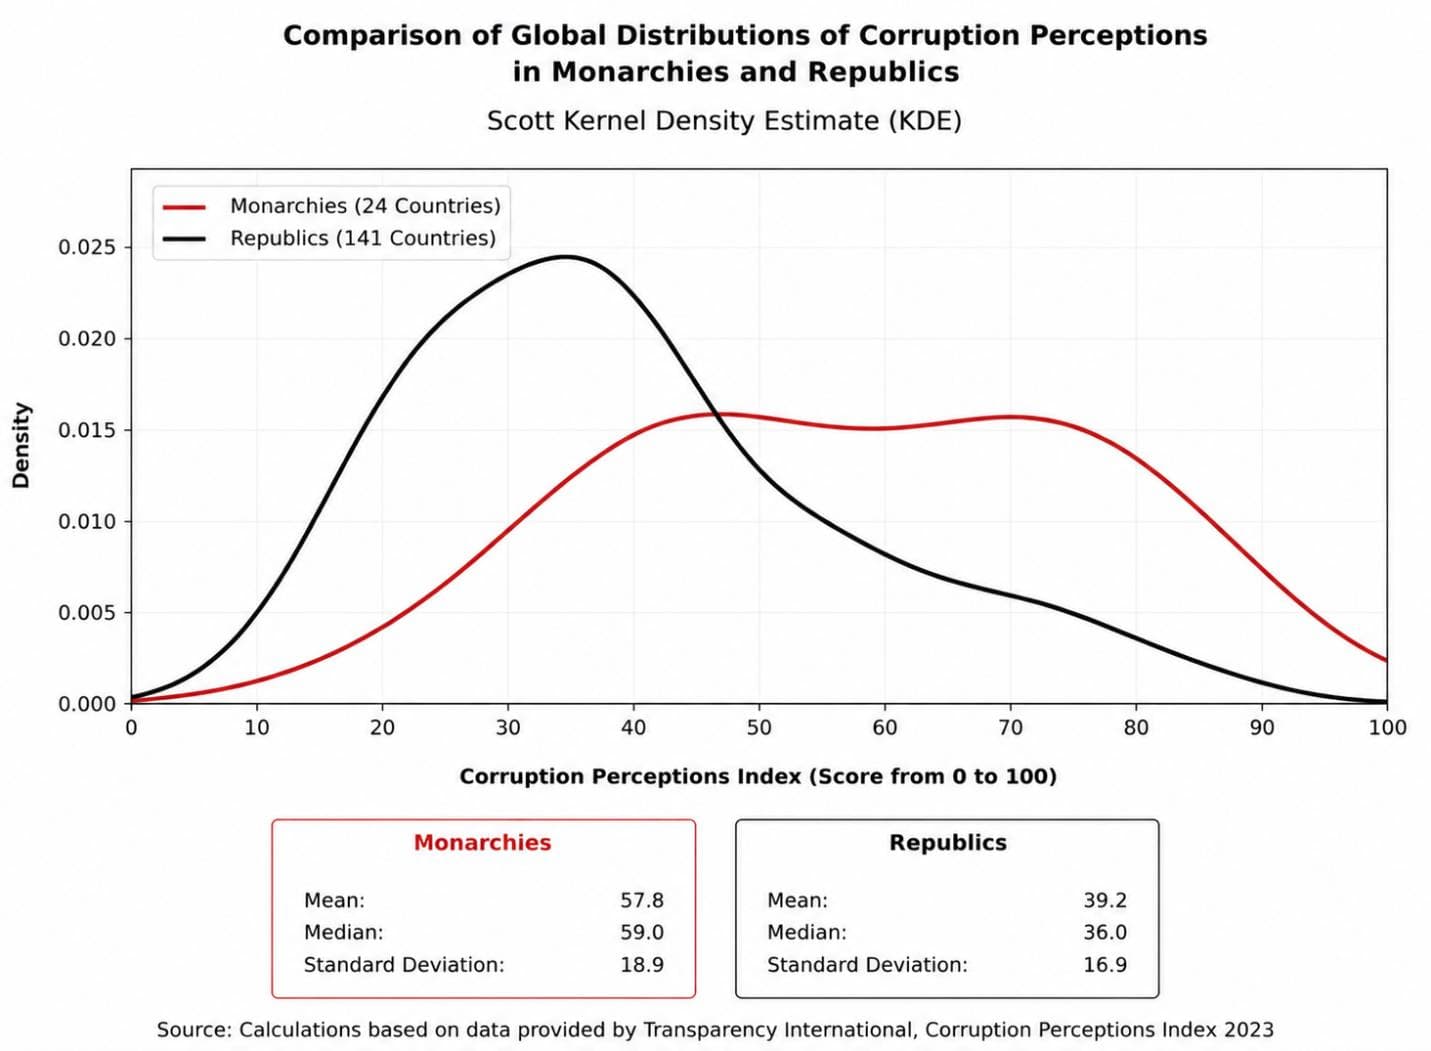
The kernel density estimate (KDE) plot shows that the distribution of monarchies worldwide on the Corruption Perceptions Index is generally shifted toward higher scores, with most monarchies concentrated at relatively favorable levels of the index. In contrast, the distribution of republics is concentrated mainly at lower scores. Although republics exhibit a wide range of performance, their highest density occurs at levels below those of monarchies. Overall, this pattern indicates that monarchies tend to perform more favorably than republics in terms of perceived public-sector corruption
Comparison of the Corruption Perceptions Index in Constitutional and Non-Constitutional Monarchies Worldwide
Descriptive Statistics
Type of Monarchy |
Number of Countries |
Mean |
Median |
Standard Deviation |
Constitutional Monarchies |
14 |
63.00 |
72.00 |
20.33 |
Semi-Constitutional and Absolute Monarchies |
10 |
50.50 |
49.00 |
12.19 |
The mean Corruption Perceptions Index score is 63.00 for constitutional monarchies and 50.50 for semi-constitutional and absolute monarchies. Thus, constitutional monarchies score, on average, 12.50 points higher on this index.
The medians point in the same direction. The median score is 72 for constitutional monarchies and 49 for the second group, meaning that the median constitutional monarchy scores 23 points higher than the median semi-constitutional or absolute monarchy.
The standard deviation is also higher among constitutional monarchies (20.33) than in the second group (12.19), indicating greater variation in performance among constitutional monarchies.
Test of the Difference in Means
To assess the statistical significance of the difference in means, Welch’s t-test was used.
Statistical Measure |
Value |
Mean difference (constitutional minus semi-constitutional and absolute) |
12.50 |
Welch’s t-statistic |
1.80 |
Approximate degrees of freedom |
21.60 |
Two-tailed p-value |
0.086 |
Hedges’ g |
0.66 |
Welch’s test indicates that the difference in means between the two types of monarchy is not statistically significant at the 5% level (p = 0.086), although the p-value is relatively close to the conventional significance threshold.
Hedges’ g is 0.66, indicating a moderate-to-large effect. Thus, although the observed difference does not reach conventional statistical significance, its magnitude cannot be regarded as small.
Mann–Whitney Test
To compare the distributions of the two groups, the nonparametric Mann–Whitney test was also conducted.
Statistical Measure |
Value |
U statistic |
100 |
Two-tailed p-value |
0.084 |
Rank-biserial correlation |
0.43 |
The Mann–Whitney test leads to a similar conclusion. The difference between the two groups is not statistically significant at the 5% level (p = 0.084), although the p-value is relatively close to the conventional threshold. The rank-biserial correlation of 0.43 indicates a moderate effect in favor of constitutional monarchies.
Conclusion
In 2023, constitutional monarchies performed better than semi-constitutional and absolute monarchies in terms of both the mean and median Corruption Perceptions Index scores. However, neither Welch’s test nor the Mann–Whitney test found the difference statistically significant at the conventional 5% level, although both p-values were relatively close to that threshold and the effect sizes were moderate or larger.
Therefore, as with several other indicators, the main and clearest difference observed in this study on the Corruption Perceptions Index is between monarchies and republics, rather than necessarily between the two types of monarchy. This finding is also consistent with the broader pattern observed in the preceding chapters of the book.
Comparison of the Corruption Perceptions Index in Commonwealth Realms and Republics Worldwide
Descriptive Statistics
Type of Government |
Number of Countries |
Mean |
Median |
Standard Deviation |
Commonwealth Realms |
9 |
58.11 |
58.00 |
18.14 |
Republics Worldwide |
141 |
39.24 |
36.00 |
16.94 |
The mean Corruption Perceptions Index score is 58.11 among the Commonwealth realms and 39.24 among republics worldwide. Thus, the Commonwealth realms score, on average, 18.87 points higher than republics.
The medians point in the same direction. The median score is 58 among the Commonwealth realms and 36 among republics, meaning that the median country in the Commonwealth realm group scores 22 points higher than the median republic.
The standard deviations of the two groups are also relatively similar. Therefore, the observed difference cannot simply be attributed to differences in the dispersion of the data.
Test of the Difference in Means
To assess the statistical significance of the difference in means, Welch’s t-test was used.
Statistical Measure |
Value |
Mean difference (Commonwealth realms minus republics) |
18.87 |
Welch’s t-statistic |
3.04 |
Approximate degrees of freedom |
8.91 |
Two-tailed p-value |
0.0142 |
95% confidence interval |
4.79 to 32.95 |
Hedges’ g |
1.10 |
Welch’s test indicates that the difference in mean Corruption Perceptions Index scores between the Commonwealth realms and republics worldwide is statistically significant at the 5% level (p = 0.014). The 95% confidence interval lies entirely above zero, confirming that the direction of the difference favors the Commonwealth realms.
Hedges’ g is 1.10, indicating a large effect. Thus, the observed difference is not only statistically significant but also substantial in practical terms.
Mann–Whitney Test
To compare the overall distributions of the two groups, the nonparametric Mann–Whitney test was also conducted.
Statistical Measure |
Value |
U statistic |
1004 |
Two-tailed p-value |
0.0035 |
Rank-biserial correlation |
0.58 |
The Mann–Whitney test also indicates a statistically significant difference between the two groups (p < 0.01). The rank-biserial effect size of 0.58 indicates a large difference, showing that Corruption Perceptions Index scores are generally higher among the Commonwealth realms than among republics worldwide.
Conclusion
In 2023, the Commonwealth realms had higher Corruption Perceptions Index scores than republics worldwide in terms of both the mean and the median. Both Welch’s test and the Mann–Whitney test confirm that the difference is statistically significant, and the effect sizes are large.
Overall, the data indicate that perceived public-sector corruption was lower in the Commonwealth realms than in republics worldwide. As with the other comparisons in this book, however, this finding represents an observational association and does not by itself establish a causal relationship between the form of government and the level of corruption.
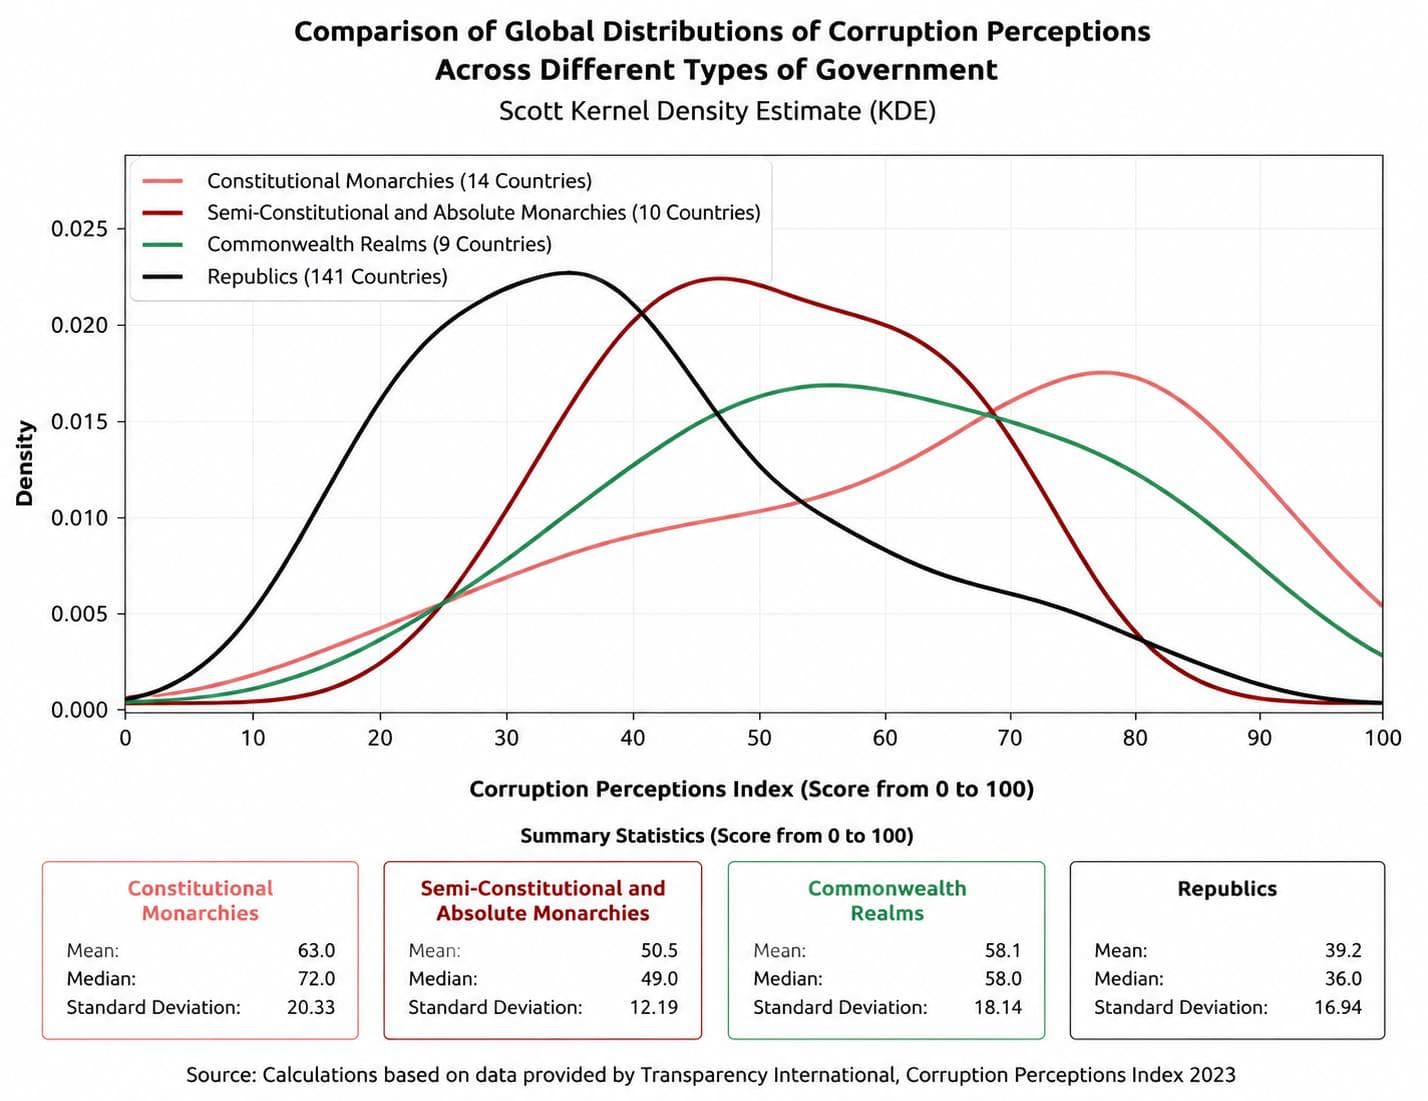
The kernel density estimate (KDE) plot shows that constitutional monarchies are most heavily concentrated at the higher end of the Corruption Perceptions Index, with their distribution clearly shifted toward higher scores. Commonwealth realms are also concentrated mainly at relatively high scores, followed by semi-constitutional and absolute monarchies, which occupy a more intermediate position. In contrast, the distribution of republics is concentrated primarily at lower scores and is more widely dispersed, indicating considerable heterogeneity in their performance on the index. Overall, this pattern suggests that, among the four forms of government, constitutional monarchies have the most favorable performance on the Corruption Perceptions Index.