

Monarchy & Republic in the Laboratory of History by N. Fakhr - HTML preview
Download the book in PDF, ePub for a complete version.
Comparison of the “Control of Corruption” Indicator between Monarchies and Republics across Continents and the Middle East
Comparison of the “Control of Corruption” Indicator between Monarchies and Republics in Asia
Descriptive Statistics
Type of Government |
Number of Countries |
Mean |
Median |
Standard Deviation |
Asian Monarchies |
13 |
66.75 |
66.50 |
23.85 |
Asian Republics |
33 |
30.90 |
26.40 |
24.85 |
The mean percentile rank for Control of Corruption is 66.75 among Asian monarchies and 30.90 among Asian republics. Thus, Asian monarchies outperform Asian republics by an average of approximately 35.84 percentile points in controlling corruption.
The medians confirm the same pattern. The median Control of Corruption percentile rank is 66.50 for monarchies and 26.40 for republics. In other words, the median country among Asian monarchies ranks approximately 40.10 percentile points higher than the median country among Asian republics. This substantial difference indicates that the advantage of monarchies is not driven merely by a few exceptional countries, but is also evident across the broader distribution of the data.
The dispersion of the data is quite similar in the two groups. The standard deviation is 23.85 among monarchies and 24.85 among republics, suggesting that the observed difference primarily reflects a difference in the overall level of performance rather than a difference in the degree of dispersion.
Test of the Difference in Means
To assess whether the difference between the two group means is statistically significant, Welch’s t-test was used.
Statistical Measure |
Value |
Mean difference (Monarchies − Republics) |
35.84 |
Welch’s t-statistic |
4.54 |
Approximate degrees of freedom |
22.90 |
Two-tailed p-value |
0.00015 |
95% confidence interval |
19.49 to 52.20 |
Hedges’ g |
1.43 |
Welch’s test indicates that the difference in mean Control of Corruption between Asian monarchies and republics is highly statistically significant (p < 0.001). The 95% confidence interval also lies entirely above zero, further supporting the higher average performance of monarchies.
Hedges’ g is 1.43, indicating a very large effect size. Thus, the observed difference is not only statistically significant but also substantial in magnitude.
Mann–Whitney U Test
To compare the overall distributions of the two groups without relying on assumptions of normality, the nonparametric Mann–Whitney U test was also conducted.
Statistical Measure |
Value |
Mann–Whitney U statistic |
362 |
Two-tailed p-value |
0.00034 |
Rank-biserial correlation |
0.69 |
The Mann–Whitney test likewise provides very strong evidence of a difference between the two groups (p < 0.001). The rank-biserial correlation of 0.69 indicates a large effect, showing that Control of Corruption percentile ranks are generally and substantially higher among Asian monarchies than among Asian republics.
Conclusion
In 2023, Asian monarchies performed substantially better than Asian republics on the Control of Corruption indicator. Both the mean and the median are considerably higher among monarchies, and both Welch’s t-test and the Mann–Whitney U test confirm the difference with very strong statistical evidence. Moreover, the large effect sizes indicate that the difference is not only statistically significant but also substantial in practical terms.
Overall, the Asian data in this study indicate that the continent’s monarchies have a better record than its republics in controlling corruption and limiting the misuse of public power. As in other sections of this book, however, this finding represents an observational association and does not, by itself, establish a causal relationship between the form of government and the level of corruption control.
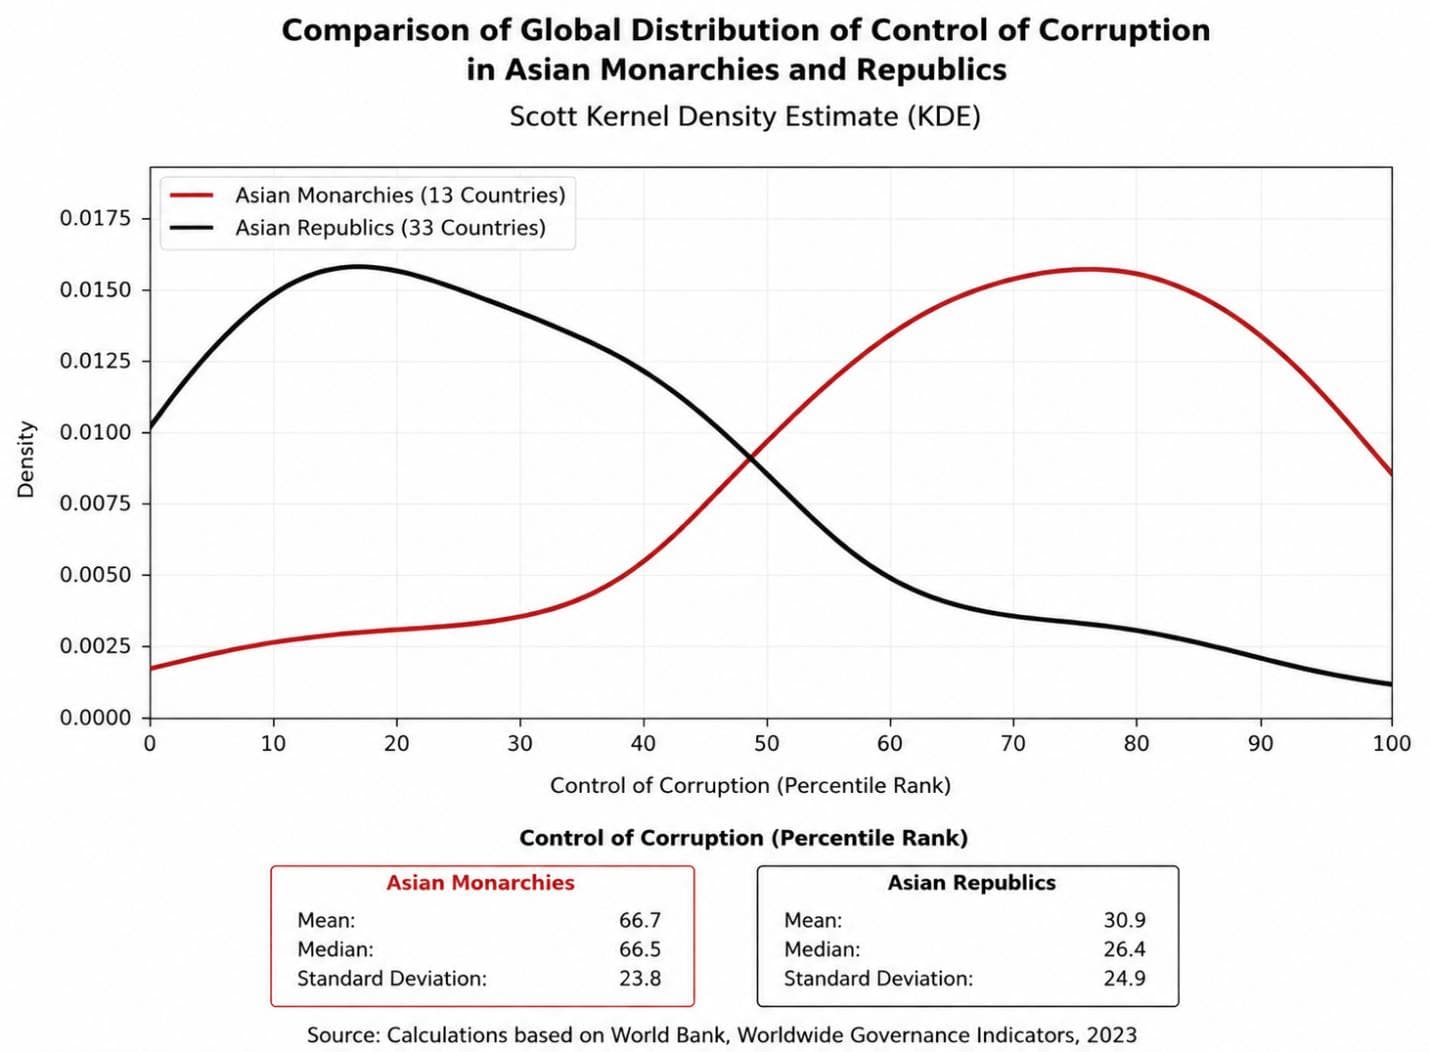
The kernel density estimate (KDE) shows that the distribution of Asian monarchies is clearly shifted toward higher values of the Control of Corruption indicator, with the greatest concentration in the upper half of the scale. In contrast, Asian republics are concentrated primarily at lower levels of the indicator and display greater dispersion, indicating greater heterogeneity in their performance on corruption control.
Comparison of the “Control of Corruption” Indicator between Monarchies and Republics in Europe
Descriptive Statistics
Type of Government |
Number of Countries |
Mean |
Median |
Standard Deviation |
European Monarchies |
11 |
91.98 |
95.30 |
8.09 |
European Republics |
34 |
63.87 |
62.00 |
22.52 |
The mean percentile rank for Control of Corruption is 91.98 among European monarchies and 63.87 among European republics. Thus, European monarchies outperform European republics by an average of approximately 28.11 percentile points in controlling corruption.
The medians confirm the same pattern. The median Control of Corruption percentile rank is 95.30 for European monarchies and 62.00 for European republics. In other words, the median country among European monarchies ranks approximately 33.30 percentile points higher than the median country among European republics. This difference indicates that the advantage of monarchies is not confined to a few exceptional countries, but is also evident across the broader distribution of the data.
The standard deviation among European monarchies (8.09) is also substantially lower than among European republics (22.52). This indicates that European monarchies not only have higher levels of corruption control but also display considerably less variation in their performance.
Test of the Difference in Means
To assess whether the difference between the two group means is statistically significant, Welch’s t-test was used.
Statistical Measure |
Value |
Mean difference (Monarchies − Republics) |
28.11 |
Welch’s t-statistic |
6.15 |
Approximate degrees of freedom |
42.34 |
Two-tailed p-value |
0.00000023 |
95% confidence interval |
18.89 to 37.33 |
Hedges’ g |
1.37 |
Welch’s test indicates that the difference in mean Control of Corruption between European monarchies and republics is highly statistically significant (p < 0.001). The 95% confidence interval lies entirely above zero, further supporting the higher average performance of monarchies.
Hedges’ g is 1.37, indicating a very large effect size. Thus, the observed difference is not only statistically significant but also substantial in magnitude.
Mann–Whitney U Test
To compare the overall distributions of the two groups, the nonparametric Mann–Whitney U test was also conducted.
Statistical Measure |
Value |
Mann–Whitney U statistic |
327 |
Two-tailed p-value |
0.000229 |
Rank-biserial correlation |
0.75 |
The Mann–Whitney test likewise provides very strong evidence of a difference between the two groups (p < 0.001). The rank-biserial correlation of approximately 0.75 indicates a very large effect, showing a pronounced advantage for European monarchies across the distribution of this indicator.
Conclusion
In 2023, European monarchies performed substantially better than European republics on the Control of Corruption indicator. Both the mean and the median are considerably higher among monarchies, and both Welch’s t-test and the Mann–Whitney U test confirm the difference with very strong statistical evidence. Moreover, the very large effect sizes indicate that the difference is not only statistically significant but also substantial in practical terms.
The much lower standard deviation among European monarchies also indicates that these countries combine higher levels of corruption control with substantially less variation in performance.
Overall, the European data in this study indicate that European monarchies have a better record than European republics in controlling corruption and limiting the misuse of public power. As in other sections of this book, however, this finding represents an observational association and does not, by itself, establish a causal relationship between the form of government and the level of corruption control.
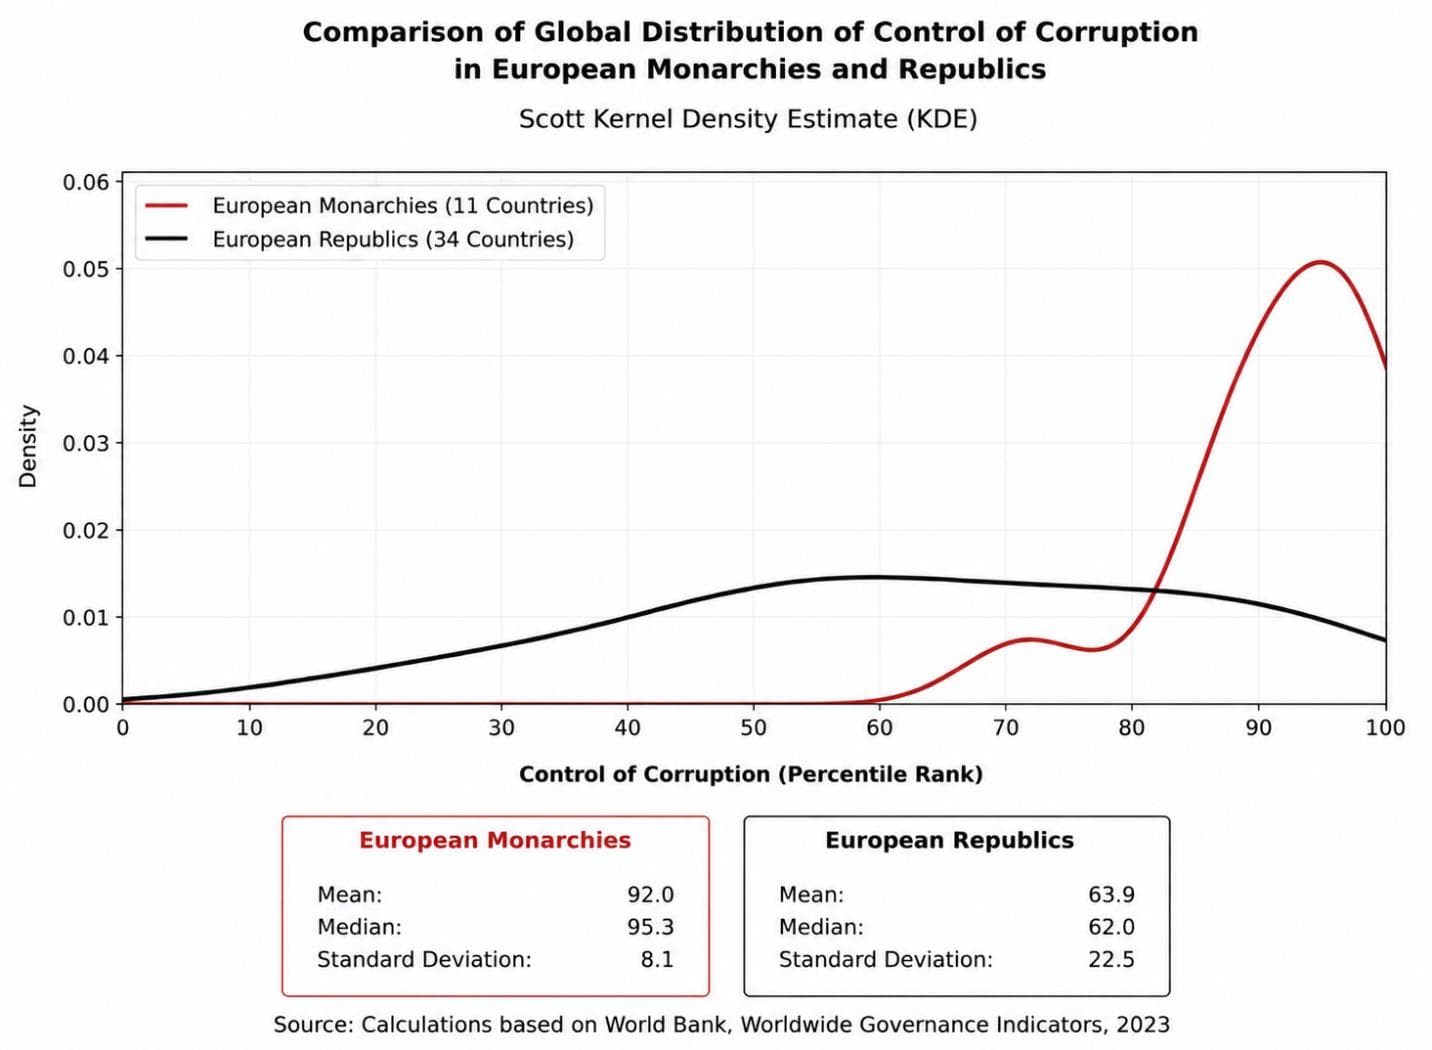
The kernel density estimate (KDE) plot shows that the distribution of European monarchies is concentrated almost entirely at very high levels of the Control of Corruption indicator, with relatively little dispersion, suggesting fairly consistent performance across these countries. In contrast, European republics not only have lower values on average but also exhibit a much wider distribution, ranging from republics with very strong performance to countries with relatively weak performance in controlling corruption.
Comparison of the “Control of Corruption” Indicator between European Monarchies and European Republics with No History of Communist Rule
Descriptive Statistics
Type of Government |
Number of Countries |
Mean |
Median |
Standard Deviation |
European Monarchies |
11 |
91.98 |
95.30 |
8.09 |
European Republics with No History of Communist Rule |
13 |
80.95 |
84.00 |
14.98 |
The mean percentile rank for Control of Corruption is 91.98 among European monarchies and 80.95 among European republics with no history of communist rule. Thus, European monarchies perform, on average, approximately 11.04 percentile points better in controlling corruption.
The medians point in the same direction. The median is 95.30 among European monarchies and 84.00 among the non-communist republics. In other words, the median monarchy ranks approximately 11.30 percentile points higher than the median republic in this restricted comparison.
The standard deviation is also considerably lower among European monarchies (8.09) than among the non-communist republics (14.98), indicating that the monarchies combine higher performance with greater consistency.
Test of the Difference in Means
To assess whether the difference between the two group means is statistically significant, Welch’s t-test was used.
Statistical Measure |
Value |
Mean difference (Monarchies − Republics) |
11.04 |
Welch’s t-statistic |
2.290 |
Approximate degrees of freedom |
18.99 |
Two-tailed p-value |
0.0336 |
95% confidence interval |
0.95 to 21.12 |
Hedges’ g |
0.864 |
Welch’s test indicates that the difference in mean Control of Corruption between the two groups is statistically significant (p = 0.0336). The 95% confidence interval lies entirely above zero, indicating higher average performance among European monarchies.
Hedges’ g is 0.864, indicating a large effect size. Thus, the observed difference is not only statistically significant but also substantial in magnitude.
Mann–Whitney U Test
To compare the overall distributions of the two groups, the nonparametric Mann–Whitney U test was also conducted.
Statistical Measure |
Value |
Mann–Whitney U statistic |
105 |
Two-tailed p-value |
0.0557 |
Rank-biserial correlation |
0.469 |
Unlike Welch’s test, the Mann–Whitney test does not reach statistical significance at the conventional 5% level (p = 0.0557), although the result is very close to the threshold. The rank-biserial correlation of 0.469 indicates a relatively large effect and a general tendency for monarchies to occupy higher ranks.
Conclusion
Once European republics with a history of communist rule are excluded, the gap between monarchies and republics becomes substantially smaller than in the comparison with all European republics. Nevertheless, European monarchies continue to have higher mean and median Control of Corruption scores.
Welch’s test finds this difference statistically significant, whereas the Mann–Whitney U test falls just short of the 5% significance threshold. The observed difference nevertheless remains substantial, with a relatively large effect size.
The results therefore suggest that part of the overall difference between European monarchies and republics is associated with the weaker performance of republics with a communist historical legacy. Even after these countries are removed, however, European monarchies still record better Control of Corruption performance than European republics without such a history.
This comparison is particularly noteworthy because the European republics included here, unlike many Eastern European republics, have no history of communist rule, and many have had competitive elections, democratic institutions, and a free press for decades or even more than a century. Since freedom of the press is commonly regarded in political-science literature as an important mechanism for monitoring public power and restraining corruption, one might expect these republics to perform at least as well as, or perhaps better than, European monarchies. Yet the data examined here show that European monarchies still have higher average Control of Corruption scores, with the difference reaching statistical significance under Welch’s test.
Comparison of the “Control of Corruption” Indicator in Monarchies and Republics in Africa, the Americas, and Oceania
To complete the regional comparisons, descriptive statistics for Control of Corruption in monarchies or Commonwealth realms in Africa, the Americas, and Oceania are compared with republics in the same regions. Because the number of monarchies and Commonwealth realms is small in some of these regions, this section is limited to descriptive statistics.
Africa
Type of Government |
Number of Countries |
Mean |
Median |
Standard Deviation |
African Monarchies |
3 |
30.50 |
33.00 |
4.77 |
African Republics |
50 |
30.93 |
24.30 |
22.88 |
In Africa, the mean Control of Corruption score is almost identical in the two groups, with republics having a slightly higher mean. However, the median is clearly higher among monarchies, while their much lower standard deviation indicates more uniform performance. Overall, the descriptive statistics do not indicate a clear advantage for either form of government in this region.
The Americas
Type of Government |
Number of Countries |
Mean |
Median |
Standard Deviation |
Commonwealth Realms in the Americas |
9 |
68.97 |
67.00 |
15.50 |
Republics in the Americas |
26 |
39.66 |
36.20 |
26.64 |
In the Americas, the Commonwealth realms perform substantially better than republics in terms of both the mean and the median. Their lower standard deviation also indicates that their performance in controlling corruption is not only higher but more consistent.
Oceania
Type of Government |
Number of Countries |
Mean |
Median |
Standard Deviation |
Monarchy and Commonwealth Realms in Oceania |
6 |
64.97 |
61.35 |
28.78 |
Republics in Oceania |
9 |
65.51 |
66.00 |
9.81 |
In Oceania, republics have slightly higher means and medians than the monarchy/Commonwealth group. However, the difference in means is very small. The substantially higher standard deviation in the monarchy/Commonwealth group indicates much greater variation in performance. Overall, the descriptive statistics for Oceania do not reveal a pronounced difference between the two groups.
Comparison of the “Control of Corruption” Indicator between Monarchies and Republics in the Middle East
Descriptive Statistics
Type of Government |
Number of Countries |
Mean |
Median |
Standard Deviation |
Middle Eastern Monarchies |
7 |
70.13 |
66.50 |
11.96 |
Middle Eastern Republics |
10 |
25.94 |
17.65 |
26.31 |
The mean percentile rank for Control of Corruption is 70.13 among Middle Eastern monarchies and 25.94 among the region’s republics. Thus, the mean for monarchies is approximately 44.19 percentile points higher.
The medians also show a striking difference: 66.50 among monarchies and 17.65 among republics. This indicates that the observed advantage is not driven merely by one or two exceptional monarchies, but is also clearly visible in the central positions of the two distributions.
The standard deviation among the republics is more than twice that of the monarchies. This indicates substantially greater heterogeneity among Middle Eastern republics, whereas the monarchies are clustered at a higher and relatively more consistent level of performance.
Test of the Difference in Means
To assess the statistical significance of the difference between the two group means, Welch’s t-test was used.
Statistical Measure |
Value |
Mean difference (Monarchies − Republics) |
44.19 |
Welch’s t-statistic |
4.67 |
Approximate degrees of freedom |
13.35 |
Two-tailed p-value |
0.00041 |
95% confidence interval |
23.79 to 64.59 |
Hedges’ g |
1.93 |
Welch’s test indicates that the difference in mean Control of Corruption between Middle Eastern monarchies and republics is highly statistically significant. The p-value is below 0.001, and the entire 95% confidence interval lies above zero.
Hedges’ g is 1.93, indicating a very large effect size. Thus, the difference between the two groups is not only statistically significant but also exceptionally large in magnitude.
Mann–Whitney U Test
To avoid relying solely on the assumptions of a parametric test, the distributions of the two groups were also compared using the nonparametric Mann–Whitney U test.
Statistical Measure |
Value |
Mann–Whitney U statistic |
62 |
Two-tailed p-value |
0.00679 |
Rank-biserial correlation |
0.77 |
The Mann–Whitney test also indicates a statistically significant difference between the two groups. The rank-biserial correlation of 0.77 indicates a very large effect size and a pronounced tendency for Middle Eastern monarchies to occupy higher Control of Corruption ranks.
Conclusion
Middle Eastern monarchies perform substantially better than the region’s republics on the Control of Corruption indicator. Their mean is more than 44 percentile points higher, while their median is nearly 49 percentile points higher. Both Welch’s t-test and the Mann–Whitney U test support the existence of a difference, and the effect sizes are very large.
The much lower standard deviation among monarchies also indicates that their stronger performance is not confined to a few exceptional cases, but is more consistent across the group. In contrast, Middle Eastern republics combine much lower mean and median scores with substantially greater dispersion.
Overall, the 2023 data indicate that Middle Eastern monarchies have a considerably better record than the region’s republics in controlling corruption and limiting the abuse of public power. This finding represents an observational association and does not, by itself, establish a causal relationship between the form of government and corruption control.
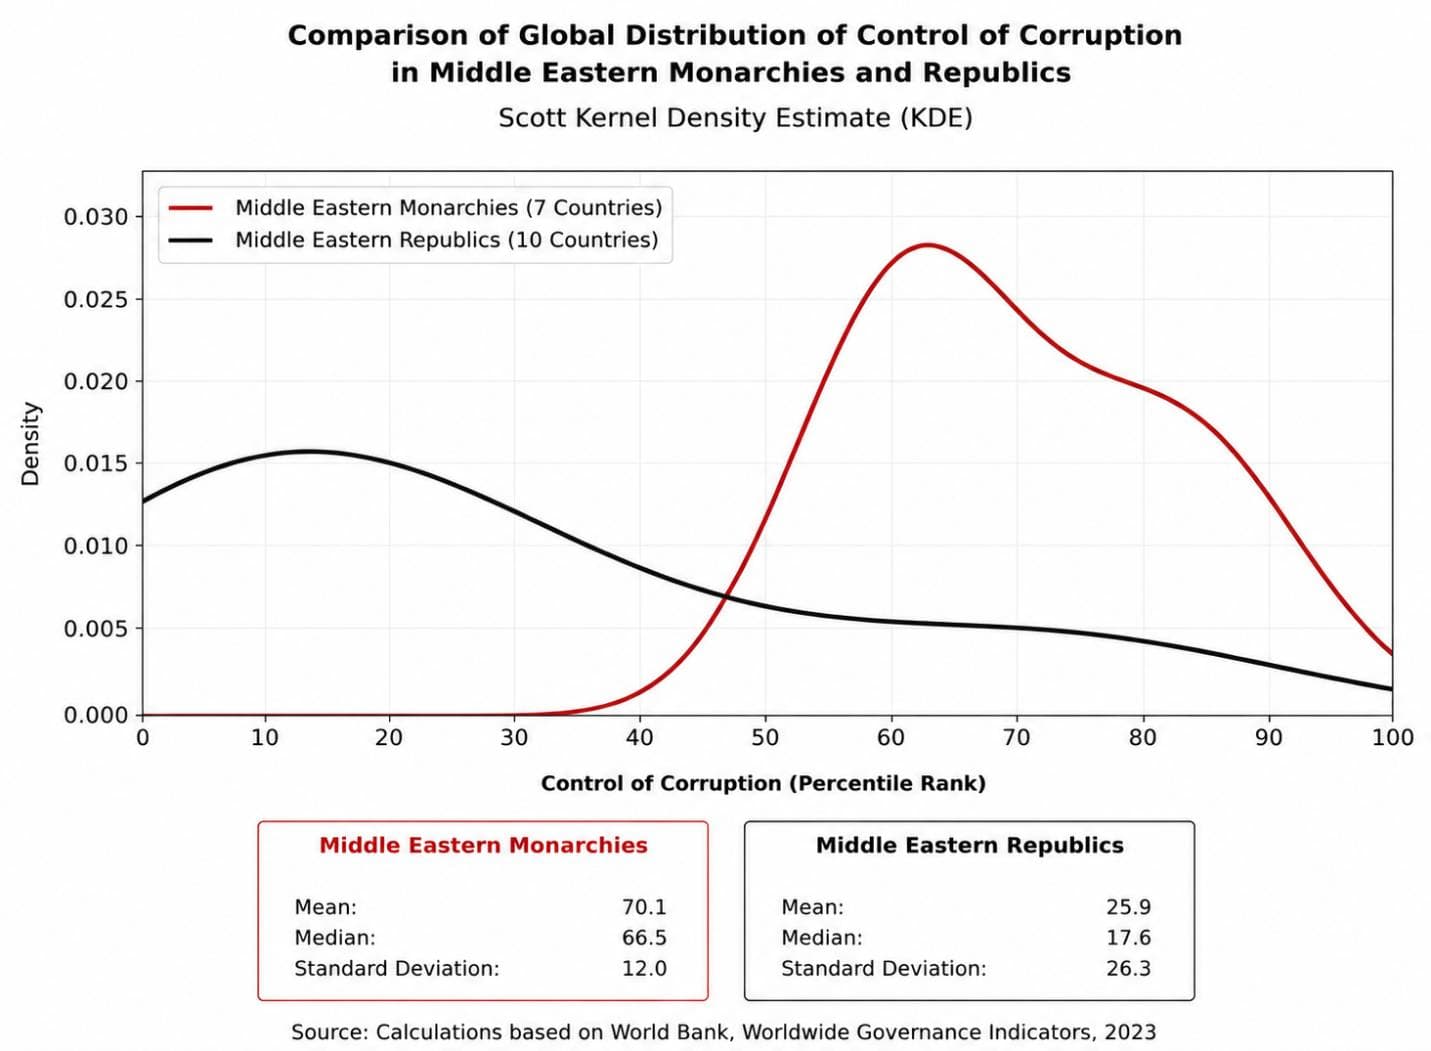
The kernel density estimate (KDE) shows that the distribution of Middle Eastern monarchies is clearly concentrated at higher levels of the Control of Corruption indicator, with the greatest density occurring in the upper half of the range. In contrast, Middle Eastern republics are predominantly concentrated at lower levels of the indicator and also display considerably greater dispersion, reflecting substantial variation in their performance in controlling corruption. The clear separation between the two curves indicates a pronounced difference in the distributional patterns of the two groups.
Status of the “New or Modern Monarchy” Hypothesis After the Ninth Indicator
With the addition of the Control of Corruption chapter, the table is updated as follows:
Test |
Indicator |
Result |
✓ |
GDP per Capita |
Consistent with the hypothesis |
✓ |
Purchasing Power per Capita |
Consistent with the hypothesis |
◐ |
Gini Coefficient |
Mixed evidence; difference favors the hypothesis |
✓ |
Political Stability and Absence of Violence |
Consistent with the hypothesis |
✓ |
Regulatory Quality |
Consistent with the hypothesis |
✓ |
Rule of Law |
Consistent with the hypothesis |
✓ |
Government Effectiveness |
Consistent with the hypothesis |
✓ |
Inflation |
Consistent with the hypothesis |
✓ |
Control of Corruption |
Consistent with the hypothesis |
At this stage, the “New or Modern Monarchy” hypothesis has been evaluated across nine independent indicators, and the results of all nine are consistent with its predictions. This does not mean that the hypothesis has been conclusively proven. Rather, it means that none of the indicators examined so far has provided evidence sufficient to reject it, while the empirical evidence accumulated thus far continues to support it.