

Monarchy & Republic in the Laboratory of History by N. Fakhr - HTML preview
Download the book in PDF, ePub for a complete version.
The Record of Justice
The fourth major objective of government is the establishment of justice. Justice is one of the most fundamental expectations people have of government. Citizens may agree or disagree with particular laws, but what most strongly creates a sense of injustice is the discriminatory enforcement of those same laws. If the law is enforced against some groups but ignored for others, or if those with power and wealth can use their influence to evade the law, public trust in government is undermined and justice is effectively eroded.
One of the most important responsibilities of any government, therefore, is to prevent the abuse of public power and ensure the equal application of the law to all citizens. The lower the level of administrative and political corruption, the fewer the opportunities to circumvent laws, enforce them selectively, or grant unfair privileges. For this reason, a government’s success in controlling corruption can be regarded as one of the most important indicators of justice in governance.
Control of Corruption
To evaluate government performance in this area, this study uses the World Bank’s Control of Corruption indicator. This indicator measures the extent to which public power is protected from being exercised for private gain and the extent to which governments have succeeded in controlling administrative and political corruption. The World Bank reports this indicator as a Percentile Rank, with higher percentile ranks indicating better performance in controlling corruption. The data used in this chapter are for 2023. (Appendix RDS-I01)
Global Comparison of the Control of Corruption Indicator in Monarchies and Republics
Descriptive Statistics
Type of Government |
Number of Countries |
Mean |
Median |
Sample Standard Deviation |
Monarchies |
28 |
72.01 |
85.10 |
25.93 |
Republics |
152 |
41.83 |
38.95 |
27.26 |
The mean percentile rank for Control of Corruption is 72.01 among monarchies and 41.83 among republics. Thus, monarchies performed, on average, about 30.18 percentile points better than republics in controlling corruption.
The medians point in the same direction. The median is 85.10 for monarchies and 38.95 for republics, meaning that the median monarchy ranks more than 46 percentile points above the median republic in controlling corruption. This difference indicates that the observed gap is not confined to a comparison of means; it is also clearly visible in the central positions of the two distributions.
The dispersion of the data is relatively similar in the two groups. The standard deviation is 25.93 among monarchies and 27.26 among republics. Thus, the substantial differences in the means and medians are observed despite broadly similar levels of within-group dispersion.
Test of the Difference in Means
To determine whether the difference between the two group means is statistically significant, Welch’s t-test was used.
Statistical Measure |
Value |
Mean difference (Monarchies − Republics) |
30.18 |
Welch’s t |
5.61 |
Approximate degrees of freedom |
38.83 |
Two-tailed p-value |
0.0000018 |
95% confidence interval for the mean difference |
19.30 to 41.05 |
Hedges’ g |
1.11 |
Welch’s test shows that the difference in mean Control of Corruption scores between the two groups is highly statistically significant (p < 0.001). The entire 95% confidence interval also lies above zero. The data in this study therefore show that monarchies performed substantially better than republics on the Control of Corruption indicator.
Hedges’ g is 1.11, indicating a large effect size. The observed difference is therefore not only statistically significant but also substantial in magnitude.
Mann–Whitney Test
To compare the two groups without relying solely on differences in means, the nonparametric Mann–Whitney U test was also conducted.
Statistical Measure |
Value |
Mann–Whitney U |
3349 |
Two-tailed p-value |
0.0000015 |
Rank-biserial correlation |
0.57 |
The Mann–Whitney test likewise provides very strong evidence of a difference between the two groups (p < 0.001). The rank-biserial correlation of 0.57 also indicates a large effect, showing that Control of Corruption ranks are generally and substantially higher among monarchies than among republics.
Conclusion
In 2023, the world’s monarchies performed substantially better than republics on the Control of Corruption indicator. Both the mean and the median were considerably higher among monarchies, and both Welch’s t-test and the Mann–Whitney U test provide very strong statistical evidence of a difference between the two groups. The large effect sizes further indicate that the observed difference is not merely statistically significant but also substantial in magnitude.
Overall, the global data examined in this study show that monarchies have a better record than republics in controlling corruption and limiting the abuse of public power for private gain. As with the other analyses in this book, however, this finding represents an observed association and does not, by itself, establish a causal relationship between the form of government and the level of corruption control.
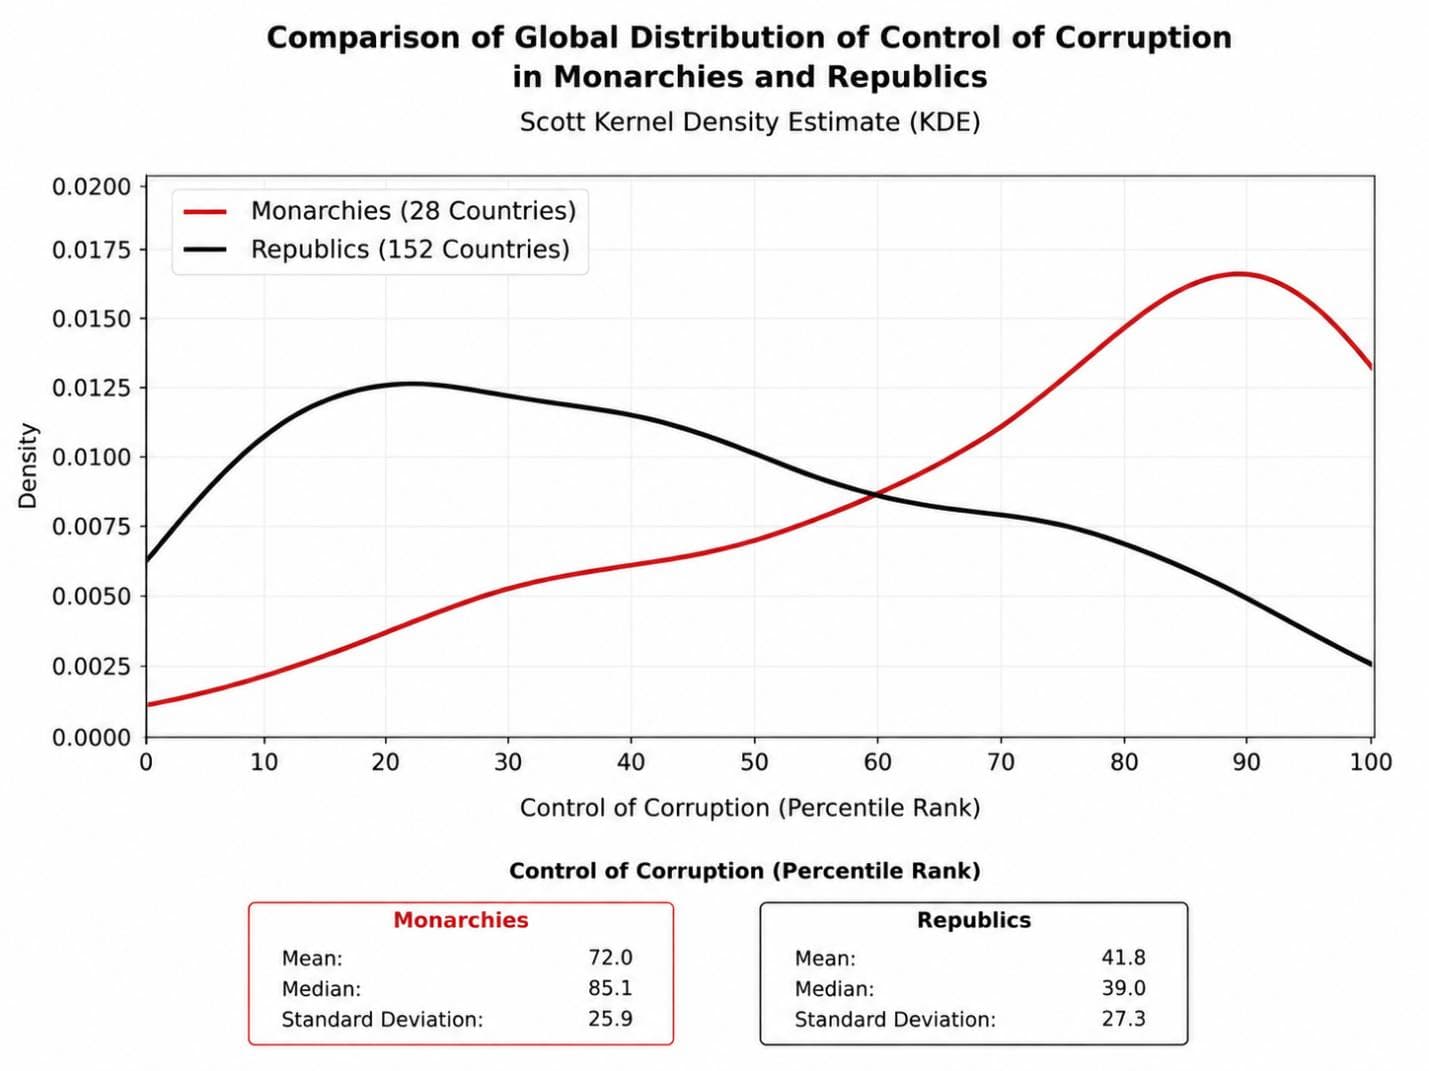
The kernel density estimate shows that the distribution of the Control of Corruption indicator among the world’s monarchies is concentrated primarily at higher percentile ranks, with a large proportion of these countries located at the upper end of the indicator. In contrast, the distribution of republics is more widely dispersed and is concentrated mainly at lower percentile ranks, although a number of republics have also achieved very high levels of corruption control. This pattern indicates that, overall, monarchies have performed better in controlling corruption, while republics exhibit greater heterogeneity in their performance on this indicator.
Comparison of the Control of Corruption Indicator in Constitutional and Non-Constitutional Monarchies Worldwide
Descriptive Statistics
Type of Monarchy |
Number of Countries |
Mean |
Median |
Sample Standard Deviation |
Constitutional Monarchies |
15 |
74.46 |
89.20 |
28.69 |
Semi-Constitutional and Absolute Monarchies |
13 |
69.18 |
75.00 |
23.17 |
The mean percentile rank for Control of Corruption is 74.46 among constitutional monarchies and 69.18 among semi-constitutional and absolute monarchies. Thus, constitutional monarchies have a mean approximately 5.28 percentile points higher than that of the second group.
The difference between the medians is larger than the difference between the means. The median Control of Corruption rank is 89.20 among constitutional monarchies and 75.00 among semi-constitutional and absolute monarchies. In other words, the median country among constitutional monarchies ranks approximately 14.20 percentile points higher.
However, there is substantial dispersion within both groups. The standard deviation is 28.69 among constitutional monarchies and 23.17 among semi-constitutional and absolute monarchies. The greater dispersion in the first group mainly indicates that, alongside several very high-performing constitutional monarchies, the group also contains some countries with substantially weaker performance.
Test of the Difference in Means
To determine whether the difference between the two group means is statistically significant, Welch’s t-test was used.
Statistical Measure |
Value |
Mean difference (Constitutional − Semi-Constitutional and Absolute) |
5.28 |
Welch’s t |
0.54 |
Approximate degrees of freedom |
25.89 |
Two-tailed p-value |
0.595 |
95% confidence interval for the mean difference |
−14.88 to 25.43 |
Hedges’ g |
0.19 |
Welch’s test shows that the difference in mean Control of Corruption between the two groups is not statistically significant (p = 0.595). The 95% confidence interval also includes zero and is relatively wide. The available data therefore do not provide sufficient evidence to conclude that either type of monarchy has a higher population mean than the other.
Hedges’ g is 0.19, indicating a small effect. Thus, the observed difference in means is not only statistically non-significant but also limited in magnitude.
Mann–Whitney Test
Because the difference between the group medians is larger than the difference between their means, and because the data exhibit substantial dispersion, the nonparametric Mann–Whitney U test was also conducted.
Statistical Measure |
Value |
Mann–Whitney U |
124.5 |
Exact two-tailed p-value |
0.235 |
Rank-biserial correlation |
0.28 |
The Mann–Whitney test likewise does not indicate a statistically significant difference between the distributions of the two groups (p = 0.235). The rank-based effect size of 0.28 suggests a small-to-moderate difference in favor of constitutional monarchies, but the statistical evidence is insufficient to establish this difference conclusively.
Conclusion
In 2023, constitutional monarchies performed better than semi-constitutional and absolute monarchies in terms of both the mean and, particularly, the median Control of Corruption rank. The respective means were 74.46 and 69.18, while the medians were 89.20 and 75.00.
Despite this descriptive advantage, neither Welch’s test nor the Mann–Whitney test indicates a statistically significant difference between the two groups. The effect size for the difference in means is also small. Based on this sample, therefore, there is insufficient evidence to conclude that either constitutional monarchies or semi-constitutional and absolute monarchies systematically outperform the other in controlling corruption.
Overall, the clearest difference on this indicator appears between monarchies and republics, rather than between the two types of monarchy.
Comparison of the Control of Corruption Indicator in Commonwealth Realms and Republics Worldwide
This section compares the performance of Commonwealth realms with that of republics worldwide on the Control of Corruption indicator. As in the preceding analyses, the data are based on the World Bank’s 2023 Control of Corruption percentile ranks; higher values therefore indicate better performance in controlling corruption.
Descriptive Statistics
Type of Government |
Number of Countries |
Mean |
Median |
Sample Standard Deviation |
Commonwealth Realms |
14 |
68.94 |
67.70 |
20.75 |
Republics Worldwide |
152 |
41.83 |
38.95 |
27.26 |
The mean Control of Corruption percentile rank is 68.94 among Commonwealth realms and 41.83 among republics worldwide. Thus, Commonwealth realms performed, on average, approximately 27.11 percentile points better than republics in controlling corruption.
The medians show the same pattern. The median Control of Corruption rank is 67.70 among Commonwealth realms and 38.95 among republics worldwide. Thus, the median Commonwealth realm ranks approximately 28.75 percentile points above the median republic. This indicates that the observed difference is not confined to the comparison of means; it is also clearly visible in the central positions of the two distributions.
The standard deviation is also lower among Commonwealth realms (20.75) than among republics (27.26), indicating that performance among Commonwealth realms is less dispersed as well as higher on average.
Test of the Difference in Means
To determine whether the difference between the two group means is statistically significant, Welch’s t-test was used.
Statistical Measure |
Value |
Mean difference (Commonwealth Realms − Republics) |
27.11 |
Welch’s t |
4.54 |
Approximate degrees of freedom |
17.42 |
Two-tailed p-value |
0.00027 |
95% confidence interval for the mean difference |
14.53 to 39.68 |
Hedges’ g |
1.01 |
Welch’s test shows that the difference in mean Control of Corruption between Commonwealth realms and republics worldwide is highly statistically significant (p < 0.001). The entire 95% confidence interval lies above zero, providing further evidence that the mean is higher among Commonwealth realms.
Hedges’ g is 1.01, indicating a large effect. Thus, the observed difference is not only statistically significant but also substantial in magnitude.
Mann–Whitney Test
To compare the distributions of the two groups without relying solely on differences in means, the nonparametric Mann–Whitney U test was also conducted.
Statistical Measure |
Value |
Mann–Whitney U |
1654 |
Two-tailed p-value |
0.00061 |
Rank-biserial correlation |
0.55 |
The Mann–Whitney test also provides very strong evidence of a difference between the two groups (p < 0.001). The rank-biserial correlation of 0.55 indicates a large effect, showing that Control of Corruption ranks are generally higher among Commonwealth realms than among republics worldwide.
Conclusion
In 2023, Commonwealth realms performed substantially better than republics worldwide on the Control of Corruption indicator. Both the mean and the median were considerably higher among Commonwealth realms, and both Welch’s t-test and the Mann–Whitney U test provide very strong statistical evidence of a difference between the two groups. The large effect sizes further indicate that the observed difference is substantial in magnitude.
Overall, the data examined in this study show that Commonwealth realms have a better record than republics worldwide in controlling corruption and limiting the abuse of public power for private gain. As with the other analyses in this book, however, this finding represents an observed association and does not, by itself, establish a causal relationship between the form of government and the level of corruption control.
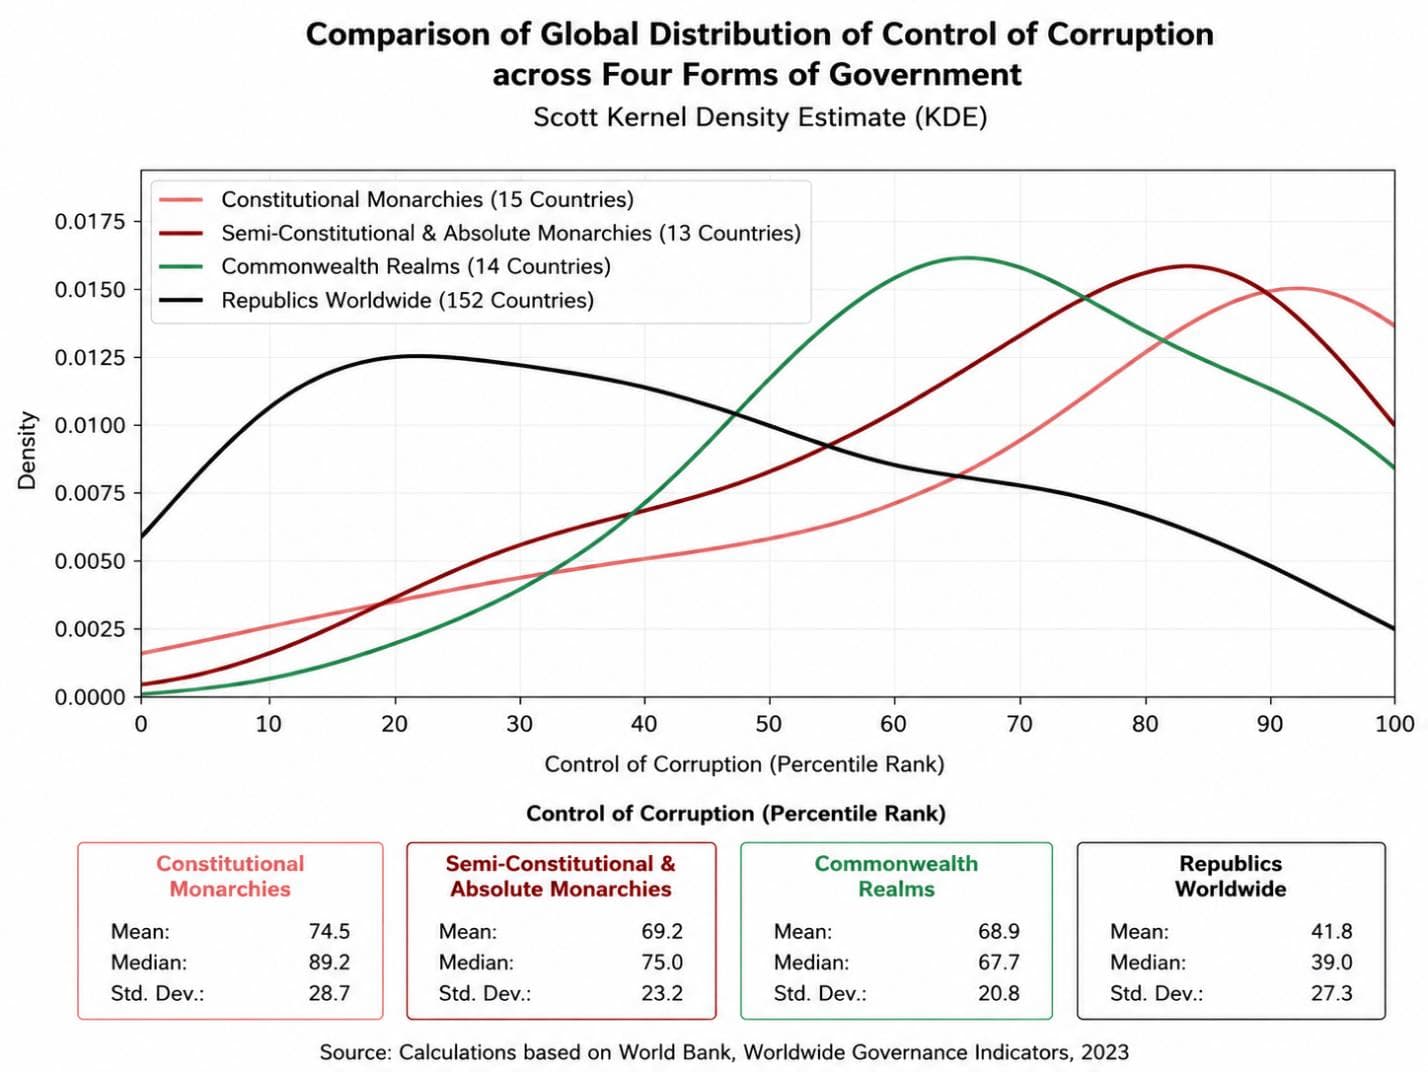
The kernel density estimate (KDE) shows that constitutional monarchies are the most concentrated at the higher percentile ranks of the Control of Corruption indicator, with their distribution clustered toward the upper end of the scale. Semi-constitutional and absolute monarchies, as well as the Commonwealth realms, are also concentrated predominantly at relatively high levels of corruption control, although their distributions are more dispersed than that of constitutional monarchies. In contrast, the distribution for republics is broader and is concentrated mainly at lower percentile ranks, indicating greater heterogeneity in their performance on corruption control.