

Monarchy & Republic in the Laboratory of History by N. Fakhr - HTML preview
Download the book in PDF, ePub for a complete version.
Comparison of the Inflation Indicator between Monarchies and Republics Across Continents and in the Middle East
Comparison of Inflation between Monarchies and Republics in Asia
This comparison examines the average annual inflation rate over the 2019–2023 period in Asian monarchies and republics. Available data covered 13 monarchies and 31 republics in Asia.
Descriptive Statistics
Type of Government |
Number of Countries |
Five-Year Average Inflation (%) |
Median (%) |
Standard Deviation |
Asian monarchies |
13 |
1.85 |
1.64 |
1.23 |
Asian republics |
31 |
13.08 |
6.80 |
23.61 |
The five-year average inflation rate was 1.85% in Asian monarchies and 13.08% in Asian republics. Thus, average inflation in Asian republics was approximately 11.23 percentage points higher than in Asian monarchies.
The medians show the same pattern. Median inflation was 1.64% among monarchies and 6.80% among republics. Thus, even after reducing the influence of extremely high values, the typical Asian republic experienced substantially higher inflation than the typical Asian monarchy.
Test of the Difference in Means
A Welch’s t-test was used to determine whether the difference in mean inflation between the two groups was statistically significant.
Statistical Measure |
Value |
Difference in means (monarchies minus republics) |
−11.23 |
Welch’s t-statistic |
−2.64 |
Approximate degrees of freedom |
30.38 |
Two-tailed p-value |
0.013 |
95% confidence interval |
−19.91 to −2.54 |
Hedges’ g |
−0.55 |
Welch’s test indicates that the difference in mean inflation between the two groups is statistically significant (p = 0.013). Moreover, the entire 95% confidence interval lies below zero, supporting the finding that average inflation was lower among Asian monarchies than among the continent’s republics.
Hedges’ g is −0.55, indicating an effect of moderate magnitude. In other words, the observed difference is not only statistically significant but also meaningful in terms of its size.
Robust Test of Distributional Differences
Because several republics had exceptionally high inflation rates, the nonparametric Mann–Whitney U test was also conducted.
Statistical Measure |
Value |
Mann–Whitney U statistic |
35 |
Two-tailed p-value |
0.00002 |
Rank-biserial correlation effect size |
0.83 |
The Mann–Whitney test also shows very strong statistical evidence of a difference between the two groups (p < 0.001). The rank-based effect size of 0.83 indicates a very large difference between their inflation distributions, with inflation values in Asian monarchies generally falling below those observed in Asian republics in pairwise comparisons.
Conclusion
During the 2019–2023 period, Asian monarchies had lower inflation than Asian republics in terms of both the mean and the median. Unlike the global comparison, in which extreme hyperinflation episodes prevented the Welch test from reaching statistical significance, the difference in means within Asia was statistically significant (p = 0.013). In addition, the Mann–Whitney test revealed a highly significant difference in the overall distributions (p < 0.001).
Overall, the Asian data examined in this study indicate that Asian monarchies performed better than Asian republics in maintaining price stability and controlling inflation. As in the other analyses in this book, this finding represents an observed association and does not, by itself, establish a causal relationship between the type of government and the inflation rate.
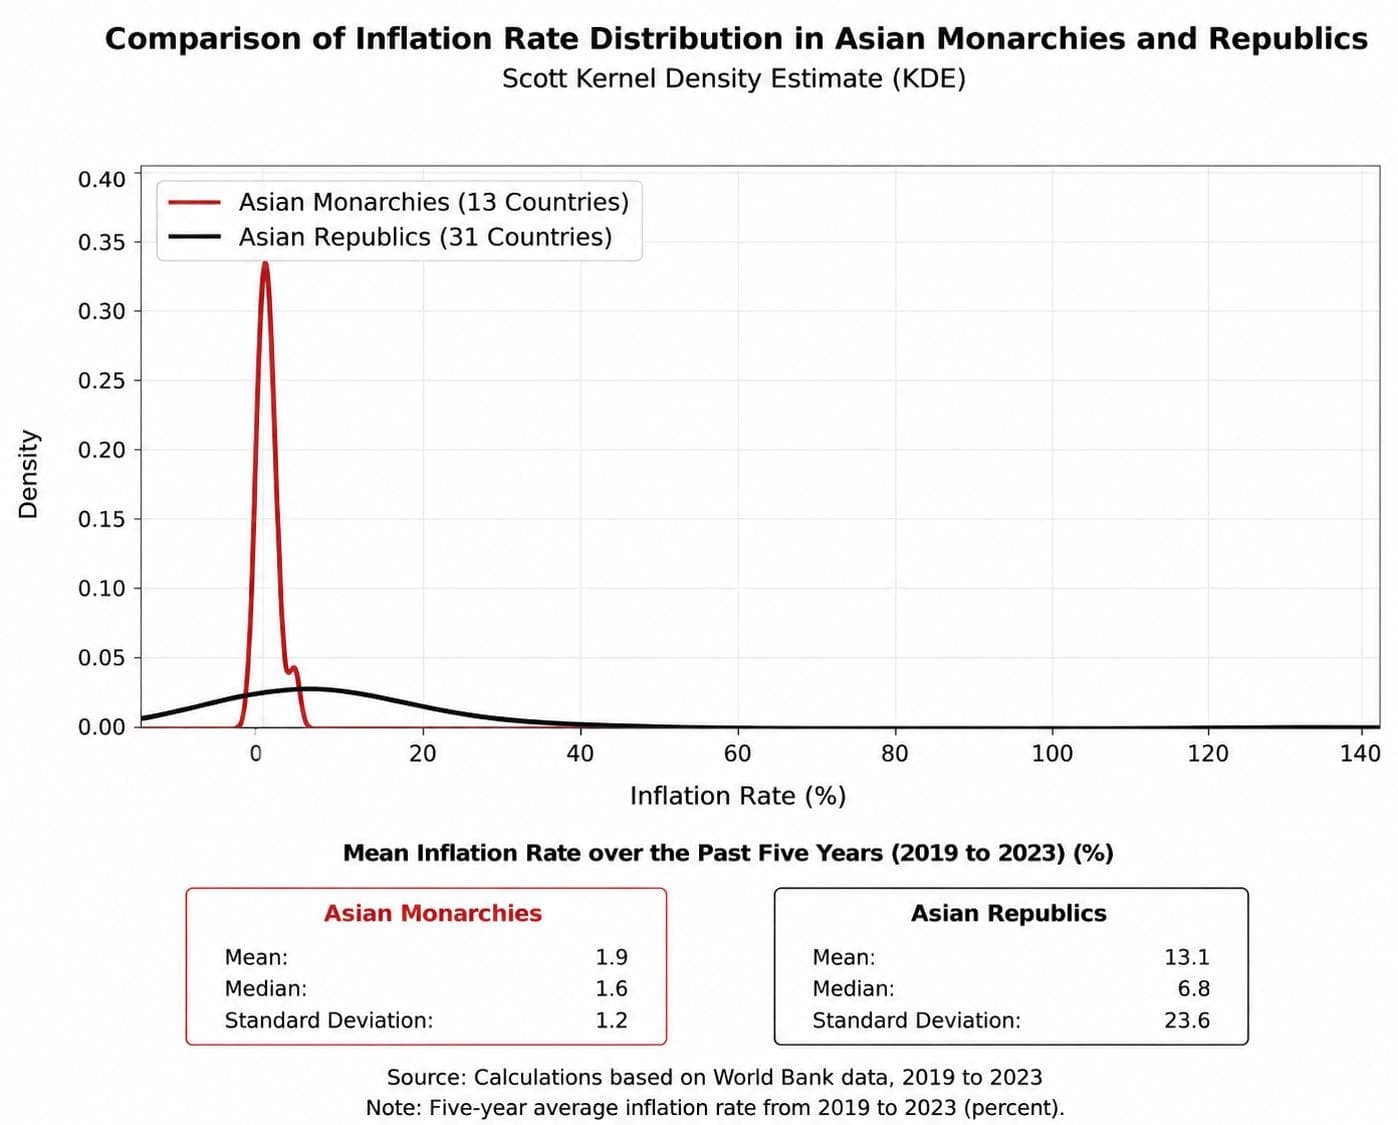
The kernel density estimate shows that the distribution of the five-year average inflation rate among Asian monarchies is concentrated predominantly at low rates and within a relatively narrow range. In contrast, while Asian republics are also concentrated around low and moderate inflation rates, their distribution is considerably more dispersed, with a long tail extending toward very high inflation rates. This pattern indicates that Asian monarchies generally experienced lower and more stable inflation, whereas several cases of very high inflation among republics substantially increased the dispersion of inflation outcomes within that group.
Comparison of the Inflation Indicator between Monarchies and Republics in Europe
The available data cover 9 European monarchies and 34 European republics.
Descriptive Statistics
Type of Government |
Number of Countries |
Five-Year Average Inflation (%) |
Median (%) |
Standard Deviation |
European monarchies |
9 |
3.50 |
3.62 |
0.54 |
European republics |
34 |
5.29 |
4.70 |
2.43 |
The five-year average inflation rate was 3.50% in European monarchies and 5.29% in European republics. Thus, average inflation in the republics was approximately 1.79 percentage points higher than in the monarchies.
The medians point in the same direction: median inflation was 3.62% among monarchies and 4.70% among republics, meaning that the median inflation rate in European republics was approximately 1.08 percentage points higher.
Another notable difference concerns the dispersion of the data. The standard deviation among monarchies was only 0.54, compared with 2.43 among republics. Thus, European monarchies not only had lower inflation on average, but their inflation outcomes were also considerably more homogeneous and stable.
Test of the Difference in Means
A Welch’s t-test was used to determine whether the difference in mean inflation between the two groups was statistically significant.
Statistical Measure |
Value |
Difference in means (monarchies minus republics) |
−1.79 |
Welch’s t-statistic |
−3.94 |
Approximate degrees of freedom |
40.64 |
Two-tailed p-value |
0.00031 |
95% confidence interval |
−2.71 to −0.87 |
Hedges’ g |
−0.80 |
Welch’s test indicates that the difference in mean inflation between the two groups is highly statistically significant (p < 0.001). The entire 95% confidence interval also lies below zero, providing strong evidence that average inflation was lower among European monarchies than among the continent’s republics.
Hedges’ g is −0.80, which is at the threshold of a large effect. Thus, the observed difference is not only statistically significant but also substantial in terms of its magnitude.
Robust Mann–Whitney Test
To ensure that the result was not dependent solely on a comparison of means, the nonparametric Mann–Whitney U test was also conducted.
Statistical Measure |
Value |
U statistic |
87 |
Exact two-tailed p-value |
0.049 |
Rank-biserial correlation |
0.43 |
The exact Mann–Whitney test reaches statistical significance at the conventional 5% threshold (p = 0.049). However, this value is very close to the significance threshold, and the asymptotic approximation yields a value of approximately 0.051. The evidence from this test should therefore be regarded as borderline.
The rank-based effect size of 0.43 indicates a moderate difference between the two groups, with inflation values in European monarchies generally occupying lower ranks than those in European republics.
Conclusion
During the 2019–2023 period, European monarchies had lower inflation than European republics in terms of both the mean and the median. Average inflation was 3.50% among monarchies and 5.29% among republics, and Welch’s test provides very strong statistical evidence of a difference between the two groups.
Monarchies also exhibited substantially less dispersion, indicating that their inflation outcomes during this period were not only lower but also more stable and consistent across countries.
The exact Mann–Whitney test also places the difference between the two groups just within the conventional threshold of statistical significance, although its evidence is weaker and more borderline than that provided by Welch’s test. Overall, the European data examined in this study indicate that European monarchies recorded a better inflation-control performance than European republics over this five-year period.
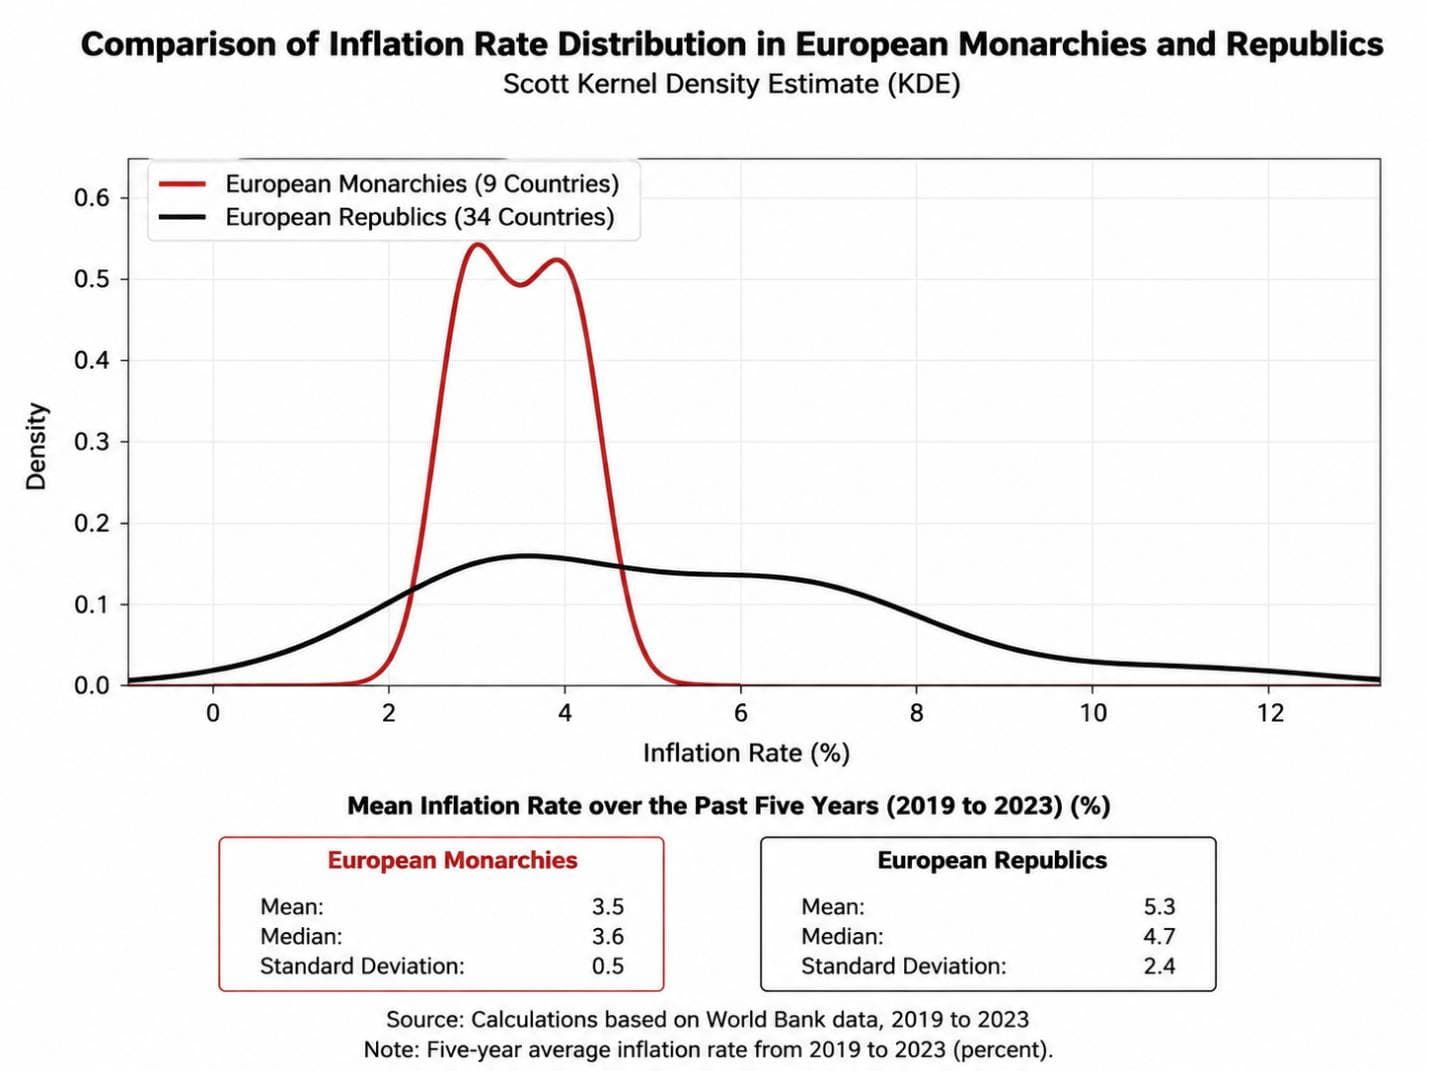
The kernel density estimate shows that the distribution of the five-year average inflation rate in both European monarchies and republics is concentrated primarily at relatively low inflation rates. However, the distribution for monarchies is more tightly concentrated within a narrower range. In contrast, European republics exhibit greater dispersion, with some countries experiencing higher inflation rates, causing the distribution to extend further toward larger values.
This pattern indicates that European monarchies generally experienced greater stability in inflation rates, although the difference between the two groups is considerably smaller than that observed in the comparison for Asia.
Comparison of Inflation in European Monarchies and European Republics That Have Never Been Communist
This comparison examines the five-year average inflation rate from 2019 to 2023. The data include 9 European monarchies and 13 European republics that have never experienced communist rule.
Descriptive Statistics
Form of Government |
Number of Countries |
Five-Year Average Inflation (%) |
Median (%) |
Standard Deviation |
European Monarchies |
9 |
3.50 |
3.62 |
0.54 |
European Republics (Never Communist) |
13 |
3.17 |
3.02 |
1.03 |
The five-year average inflation rate was 3.50% in European monarchies and 3.17% in European republics that have never experienced communist rule. Thus, in this comparison, the average inflation rate in monarchies was approximately 0.33 percentage points higher than in the non-communist republics.
The medians point in the same direction: 3.62% in the monarchies compared with 3.02% in the non-communist republics.
At the same time, the standard deviation among monarchies (0.54) was approximately half that of the non-communist republics (1.03). Thus, although the average inflation rates of the two groups were very similar, inflation outcomes among the monarchies were more uniform and less dispersed.
Test of the Difference in Means
Welch’s t-test was used to determine whether the difference in mean inflation between the two groups was statistically significant.
Statistical Measure |
Value |
Difference in means (Monarchies − Republics) |
+0.33 |
Welch’s t-statistic |
0.98 |
Approximate degrees of freedom |
18.95 |
Two-tailed p-value |
0.339 |
95% confidence interval |
−0.38 to +1.04 |
Hedges’ g |
0.37 |
Welch’s test indicates that the difference in mean inflation between the two groups is not statistically significant (p = 0.339). The 95% confidence interval also includes zero. Therefore, the data in this sample do not provide sufficient evidence of a genuine difference in mean inflation between the two groups.
Hedges’ g is 0.37, indicating a small-to-moderate effect size.
Mann–Whitney U Test
The non-parametric Mann–Whitney U test was also used to compare the distributions of the two groups.
Statistical Measure |
Value |
U statistic |
79 |
Two-tailed p-value |
0.182 |
Rank-biserial correlation |
−0.35 |
The Mann–Whitney test likewise does not indicate a statistically significant difference between the two groups (p = 0.182). Thus, neither the comparison of means nor the comparison of the overall distributions provides sufficient statistical evidence that either group outperformed the other.
Conclusion
After excluding European republics with a history of communist rule, the difference observed in the previous comparison effectively disappears. The average inflation rates of European monarchies (3.50%) and European republics that have never experienced communist rule (3.17%) are very similar, and neither statistical test finds a significant difference between them.
Therefore, among European countries without a history of communist rule, the data examined in this study do not indicate that the form of government—monarchy or republic—was associated with a statistically significant difference in inflation performance during 2019–2023. Nevertheless, the monarchies exhibited less dispersion in inflation rates, indicating more uniform inflation outcomes across the group than among the non-communist republics.
Comparison of Inflation in Monarchies and Republics in Africa, the Americas, and Oceania
Continent and Form of Government |
Number of Countries |
Mean Inflation |
Median |
Standard Deviation |
Africa — Monarchies |
2 |
4.59% |
4.59% |
2.23 |
Africa — Republics |
49 |
85.05% |
5.74% |
507.97 |
Americas — Commonwealth Realms |
9 |
2.92% |
2.67% |
1.51 |
Americas — Republics |
25 |
204.37% |
5.23% |
973.71 |
Oceania — Monarchy of Tonga |
1 |
4.50% |
4.50% |
— |
Oceania — Commonwealth Realms |
5 |
3.80% |
3.67% |
0.72 |
Oceania — Republics |
9 |
3.58% |
3.47% |
1.25 |
The extremely high mean inflation rates among the republics of Africa and the Americas are heavily influenced by cases of extreme inflation. For this reason, the medians in these two continents provide a more informative picture of the typical country than the means.
As with the previous indicators, the very small number of monarchies in Africa, the Americas, and Oceania makes inferential comparisons between forms of government of limited value. The analysis of these three continents is therefore restricted to descriptive statistics. In the Americas, where there are no independent monarchies, the Commonwealth realms are compared with the republics. In Oceania, the region’s only independent monarchy, Tonga, is considered alongside the Commonwealth realms.
Africa
The only two monarchies represented in the data, Lesotho and Morocco, had a five-year average inflation rate of 4.59%. Among the 49 African republics, the corresponding mean was 85.05%. However, the republican mean is heavily influenced by several cases of extremely high inflation, particularly Sudan, making the medians more informative for comparing the typical experience of the two groups.
Median inflation was 4.59% among the monarchies and 5.74% among the republics. Thus, even when the influence of extreme values is reduced by focusing on the median, the two African monarchies recorded lower typical inflation than the republics of the continent. With only two monarchies, however, this difference cannot support broad statistical conclusions.
The Americas
The Commonwealth realms had a five-year average inflation rate of only 2.92%, compared with 204.37% among the continent’s 25 republics. This enormous difference is driven primarily by Venezuela’s exceptionally high inflation and, to a lesser extent, by several other republics. The mean alone is therefore not an appropriate measure of the typical difference between the two groups.
The medians, however, point in the same direction: median inflation was 2.67% among the Commonwealth realms and 5.23% among the republics. Thus, even without relying on extreme inflation cases, the median republic experienced almost twice the inflation of the median Commonwealth realm. The standard deviation among the Commonwealth realms was also only 1.51, indicating much greater uniformity in their inflation outcomes.
Oceania
Oceania presents a different picture, and the differences are much smaller. Tonga, the region’s only independent monarchy, had an average inflation rate of 4.50%. Among the five Commonwealth realms, average inflation was 3.80%, compared with 3.58% among the region’s nine republics.
The medians are similarly close: 3.67% among the Commonwealth realms and 3.47% among the republics. Thus, unlike in Africa and the Americas, the descriptive advantage in terms of lower inflation lies slightly with the republics, although the difference relative to the Commonwealth realms is very small. At the same time, the standard deviation was 0.72 among the Commonwealth realms, compared with 1.25 among the republics, indicating less dispersion in inflation outcomes among the Commonwealth realms.
Overall Assessment
Taken together, these three continents do not present a uniform pattern. In Africa, the monarchies recorded lower typical inflation than the republics, while in the Americas the Commonwealth realms did so; in Oceania, by contrast, the republics had slightly lower inflation than the Commonwealth realms.
Given the very small number of monarchies in these regions, however, these findings are descriptive rather than inferential and should not be assigned the same statistical weight as the global, Asian, European, or Middle Eastern comparisons.
Comparison of the Inflation Indicator in Middle Eastern Monarchies and Republics
This comparison examines the five-year average inflation rate from 2019 to 2023. The available data cover 7 monarchies and 9 republics in the Middle East.
Descriptive Statistics
Form of Government |
Number of Countries |
Five-Year Mean Inflation (%) |
Median (%) |
Standard Deviation |
Middle Eastern Monarchies |
7 |
1.35 |
1.45 |
0.81 |
Middle Eastern Republics |
9 |
28.02 |
14.51 |
41.16 |
The five-year average inflation rate was 1.35% in Middle Eastern monarchies and 28.02% in Middle Eastern republics. Thus, average inflation among the republics was approximately 26.66 percentage points higher than among the monarchies.
The medians confirm the same pattern. Median inflation was 1.45% among the monarchies and 14.51% among the republics. Thus, even when the influence of extremely high values is reduced by focusing on the median, the typical Middle Eastern republic experienced substantially higher inflation than the typical monarchy in the region.
The standard deviation among the republics (41.16) was also dramatically higher than among the monarchies (0.81), indicating far greater dispersion in inflation rates across the region’s republics.
Test of the Difference in Means
Welch’s t-test was used to determine whether the difference between the two group means was statistically significant.
Statistical Measure |
Value |
Mean difference (Monarchies − Republics) |
−26.66 |
Welch’s t-statistic |
−1.94 |
Approximate degrees of freedom |
8.01 |
Two-tailed p-value |
0.088 |
95% confidence interval |
−58.30 to +4.98 |
Hedges’ g |
−0.81 |
Although average inflation was substantially higher among Middle Eastern republics, Welch’s test did not find the difference statistically significant at the conventional 5% level (p = 0.088). The main reason is the presence of several republics with very high inflation rates, which greatly increases the dispersion of the data.
Nevertheless, Hedges’ g was −0.81, indicating a large effect. The observed difference is therefore substantial in magnitude, even though the small sample sizes and very high variability among the republics prevent the difference in means from reaching conventional statistical significance.
Mann–Whitney U Test
To reduce sensitivity to extreme values, the nonparametric Mann–Whitney U test was also conducted.
Statistical Measure |
Value |
U statistic |
3 |
Two-tailed p-value |
0.0012 |
Rank-biserial correlation |
0.90 |
The Mann–Whitney test provides very strong evidence of a difference between the two groups (p = 0.0012). The rank-biserial effect size of 0.90 also indicates a very large separation between their inflation distributions, with Middle Eastern monarchies generally occupying substantially lower inflation ranks than the region’s republics.
Conclusion
During the 2019–2023 period, Middle Eastern monarchies had substantially lower inflation than Middle Eastern republics in terms of both the mean and the median. Although Welch’s test did not find the difference in means statistically significant at the 5% level—largely because of several extremely high inflation observations among the republics and the resulting high variance—the large effect size and the Mann–Whitney test both point to a pronounced difference between the two groups.
Overall, the Middle Eastern data in this study indicate that, during 2019–2023, the region’s monarchies recorded a better performance than its republics in maintaining price stability and containing inflation. As elsewhere in this book, however, this finding describes an observed association and does not, by itself, establish a causal relationship between the form of government and the inflation rate.
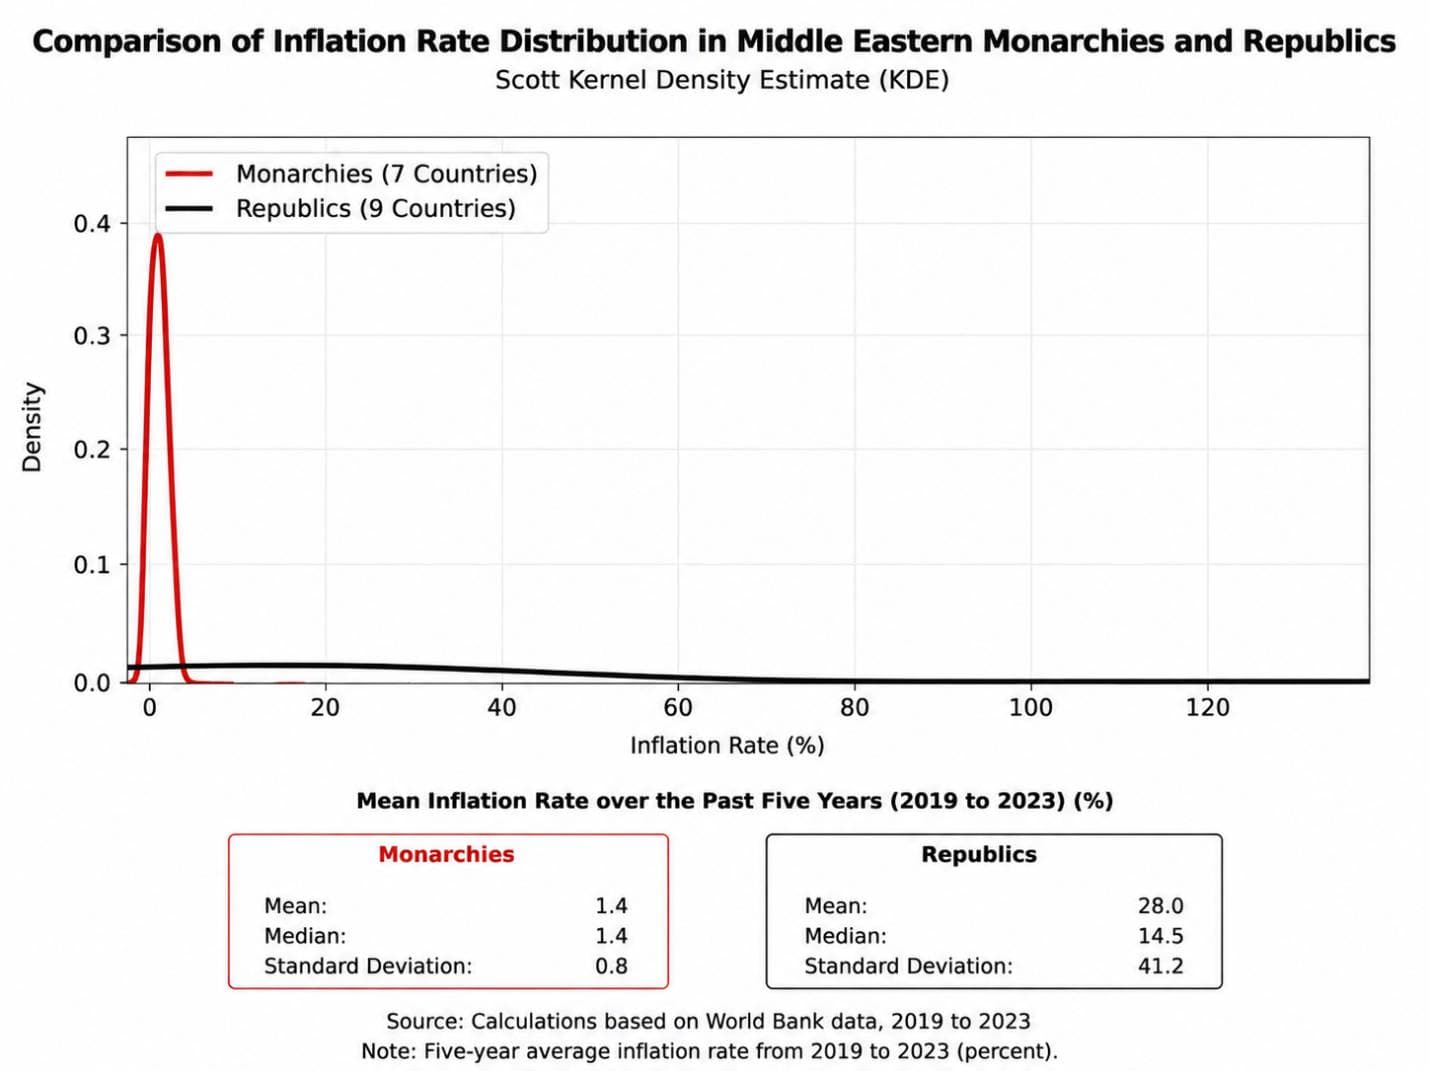
The kernel density estimate (KDE) shows that the distribution of the five-year average inflation rate among Middle Eastern monarchies is concentrated entirely at low inflation rates, with very little dispersion. In contrast, the republics in the region exhibit substantially greater dispersion and include several countries with very high inflation rates, extending the tail of the distribution toward much higher values. This pattern indicates that, overall, Middle Eastern monarchies experienced lower and more stable inflation, whereas the region’s republics were characterized by greater inflation volatility.
Status of the “New or Modern Monarchy” Hypothesis After the Eighth Indicator
Based on the findings obtained so far in this book, the inflation chapter also provides overall support for the hypothesis. Although no statistically significant difference was found in some subgroup comparisons—such as European republics with no history of communist rule—the overall evidence from the global comparison, Asia, and the Middle East was favorable to the hypothesis. The status of the hypothesis can therefore be updated as follows:
Test |
Indicator |
Result |
✓ |
GDP per Capita |
Consistent with the hypothesis |
✓ |
Purchasing Power per Capita |
Consistent with the hypothesis |
◐ |
Gini Coefficient |
Mixed evidence; difference favors the hypothesis |
✓ |
Political Stability and Absence of Violence |
Consistent with the hypothesis |
✓ |
Regulatory Quality |
Consistent with the hypothesis |
✓ |
Rule of Law |
Consistent with the hypothesis |
✓ |
Government Effectiveness |
Consistent with the hypothesis |
✓ |
Inflation |
Consistent with the hypothesis |