

Monarchy & Republic in the Laboratory of History by N. Fakhr - HTML preview
Download the book in PDF, ePub for a complete version.
Inflation
One of the most important responsibilities of government is to maintain order in the economy. Stable rules, fiscal discipline, a reasonable degree of monetary-policy independence, and restraint from short-term populist decisions all contribute to price stability. Inflation can therefore be regarded as one of the most important outcomes of economic order in governance.
Conversely, when governments resort to undisciplined monetary and fiscal policies to finance budget deficits, cover political expenditures, or pursue short-term objectives, the usual result is higher inflation and reduced economic stability. The ability to control inflation can therefore serve as an important indicator of the quality of economic governance.
If the “New or Modern Monarchy” hypothesis is correct, and if this system can promote greater economic discipline by encouraging a longer-term decision-making horizon and reducing short-term political incentives, monarchies would be expected, on average, to experience lower inflation than republics. Conversely, if contemporary monarchies remain vulnerable to the autocracy and mismanagement associated with many historical monarchies, their average inflation rate would be expected to exceed that of republics.
To increase the robustness of the results and reduce the influence of short-term fluctuations, this analysis uses each country’s average inflation rate over the five-year period from 2019 to 2023, rather than the inflation rate for a single year. A multi-year average reduces the disproportionate influence of temporary shocks, such as economic crises or short-lived price surges, and provides a more accurate picture of the longer-term performance of different systems of government in maintaining price stability. Accordingly, throughout the remainder of this section, “inflation” refers to the five-year average inflation rate for 2019–2023 (Appendix RDS-H01).
Global Comparison of Inflation in Monarchies and Republics
Descriptive Statistics
Form of Government |
Number of Countries |
Five-Year Mean Inflation (%) |
Standard Deviation |
Monarchies |
25 |
2.77 |
1.45 |
Republics |
148 |
66.85 |
494.19 |
The five-year mean inflation rate is 2.77% for monarchies and 66.85% for republics. At first glance, this difference appears enormous. However, the exceptionally large standard deviation among republics indicates that their mean is heavily influenced by a small number of countries experiencing extremely high inflation. As with many distributions containing extreme outliers, the mean alone therefore does not provide a complete picture of the difference between the two groups.
Welch’s t-test
The two-tailed Welch’s t-test produced:
t = −1.577, df = 147.02, p = 0.1168
Thus, the difference between the group means is not statistically significant at the 5% level according to Welch’s test. The principal reason is the exceptionally high dispersion among republics.
Mann–Whitney U Test
To compare the two distributions without relying on the assumption of normally distributed data, a Mann–Whitney U test was also conducted:
U = 704, p < 0.000001
This result is highly statistically significant and indicates that inflation values among monarchies are systematically lower than those among republics.
If the directional hypothesis—that inflation is lower in monarchies than in republics—had been specified in advance, the corresponding one-tailed value would be approximately:
p = 0.00000038
Interpretation
To reduce the influence of fluctuations specific to any single year, this analysis compares the average inflation rate over the five-year period from 2019 to 2023. The indicator could be calculated for 25 monarchies and 148 republics.
The five-year mean inflation rate is only 2.77% among monarchies, compared with 66.85% among republics. This very large difference in means, however, must be interpreted cautiously because the republic group contains several countries with extremely high inflation rates that pull the mean sharply upward.
For this reason, the medians provide a more representative picture of the center of the two distributions. The five-year median inflation rate is 2.99% among monarchies and 5.33% among republics. Thus, even after reducing the influence of extreme observations, the median republic experienced an inflation rate approximately 1.8 times that of the median monarchy.
Because of the exceptionally high dispersion among republics, Welch’s t-test does not find the difference in group means statistically significant at the 5% level (t = −1.577, p = 0.1168). This result illustrates why comparisons based solely on means can be misleading when distributions are highly skewed and contain extreme outliers.
For this reason, the Mann–Whitney U test was also applied. Because this test is based on the ranks of observations, it is substantially less sensitive to extreme values. Its result indicates that the distribution of inflation among monarchies is significantly lower than that among republics (U = 704, p < 0.000001).
Taken together, the descriptive evidence and the nonparametric test indicate that monarchies typically experienced lower and more stable inflation than republics during the period examined. For this indicator, given the extreme skewness of the data and the presence of exceptionally high inflation in some republics, the Mann–Whitney test provides a more informative picture of the typical difference between the two groups than a comparison based solely on their means.
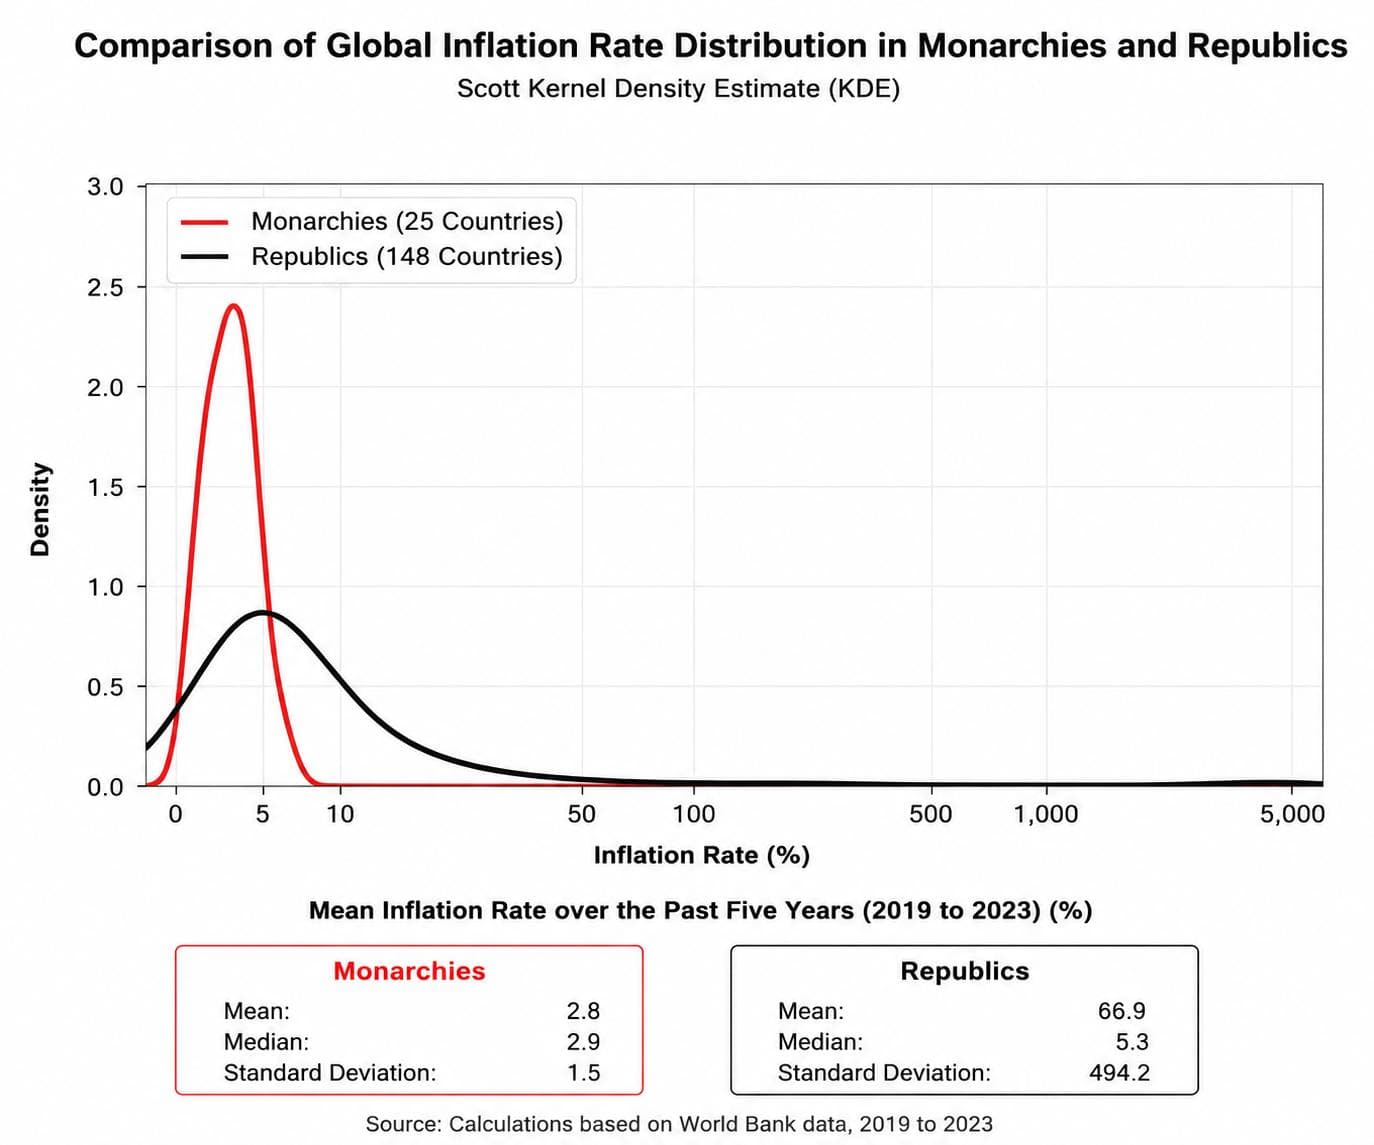
نمودار نشان میدهد که میانگین تورم پنجساله در پادشاهیهای جهان عمدتاً در سطوح پایین و در محدودۀ نسبتاً فشردهای متمرکز است، در حالی که توزیع جمهوریها پراکندگی بسیار بیشتری دارد و به سمت نرخهای بسیار بالا کشیده شده است. بنابراین، پادشاهیها نهتنها تورم متوسط کمتری داشتهاند، بلکه از ثبات بیشتری نیز برخوردار بودهاند؛ در مقابل، وجود چند مورد تورم شدید و ابرتورم در میان جمهوریها سبب افزایش چشمگیر میانگین و انحراف معیار این گروه شده است.
Comparison of Inflation in Constitutional Monarchies and Semi-Constitutional and Absolute Monarchies
This comparison examines the average inflation rate over the period 2019–2023 across the two types of monarchy. Among countries for which World Bank data were available, 14 countries were classified as constitutional monarchies and 11 countries as semi-constitutional and absolute monarchies.
Descriptive Statistics
Type of Monarchy |
Number of Countries |
Five-Year Mean Inflation (%) |
Median (%) |
Standard Deviation |
Constitutional Monarchies |
14 |
3.18 |
3.07 |
1.29 |
Semi-Constitutional and Absolute Monarchies |
11 |
2.25 |
1.84 |
1.54 |
The five-year mean inflation rate was 3.18% in constitutional monarchies and 2.25% in semi-constitutional and absolute monarchies. Thus, the latter group experienced inflation that was, on average, approximately 0.93 percentage points lower.
The medians show a similar pattern: median inflation was 3.07% in constitutional monarchies and 1.84% in semi-constitutional and absolute monarchies. The consistency between the means and medians suggests that the observed difference is not simply the result of one or more unusually high values.
Test of the Difference in Means
Welch’s t-test was used to determine whether the difference in mean inflation between the two groups was statistically significant.
Statistical Measure |
Value |
Mean difference: Constitutional − Semi-Constitutional and Absolute |
0.93 |
Welch’s t |
1.60 |
Approximate degrees of freedom |
19.42 |
Two-tailed p-value |
0.125 |
95% CI for the mean difference |
−0.28 to 2.14 |
Hedges’ g |
0.64 |
Mean inflation in constitutional monarchies was approximately 0.93 percentage points higher than in semi-constitutional and absolute monarchies. However, Welch’s test indicates that this difference is not statistically significant at the 95% confidence level (p = 0.125). The confidence interval for the difference in means also includes zero; therefore, the available data do not allow us to conclude with confidence that the true mean inflation rates of the two types of monarchy differ.
Hedges’ g = 0.64, which in magnitude suggests a moderate effect. However, given the relatively small number of countries in each group and the resulting uncertainty of the estimate, this difference is not statistically confirmed. In other words, the data suggest lower inflation among semi-constitutional and absolute monarchies, but the evidence is insufficient for a definitive conclusion.
Conclusion
During the period examined, semi-constitutional and absolute monarchies had lower inflation than constitutional monarchies in terms of both the mean and the median. However, the difference between the group means did not reach statistical significance. Therefore, at this stage, neither type of monarchy can be considered conclusively superior in controlling inflation, although the observed difference favors semi-constitutional and absolute monarchies. This is an observational comparison of country performance and, by itself, does not establish a causal relationship between the type of monarchy and inflation.
Comparison of Inflation in Commonwealth Realms and Republics Worldwide
This comparison examines average inflation rates over the period 2019–2023 in Commonwealth realms and republics worldwide. The available data cover 14 Commonwealth realms and 148 republics.
Descriptive Statistics
Form of Government |
Number of Countries |
Five-Year Mean Inflation (%) |
Median (%) |
Standard Deviation |
Commonwealth Realms |
14 |
3.23 |
3.14 |
1.33 |
Republics |
148 |
66.85 |
5.33 |
494.19 |
The five-year mean inflation rate was 3.23% in Commonwealth realms and 66.85% in republics. On this basis, average inflation among republics was approximately 63.62 percentage points higher than among Commonwealth realms.
However, the exceptionally large standard deviation among republics indicates that the group mean is heavily influenced by a small number of republics experiencing extremely high inflation or hyperinflation.
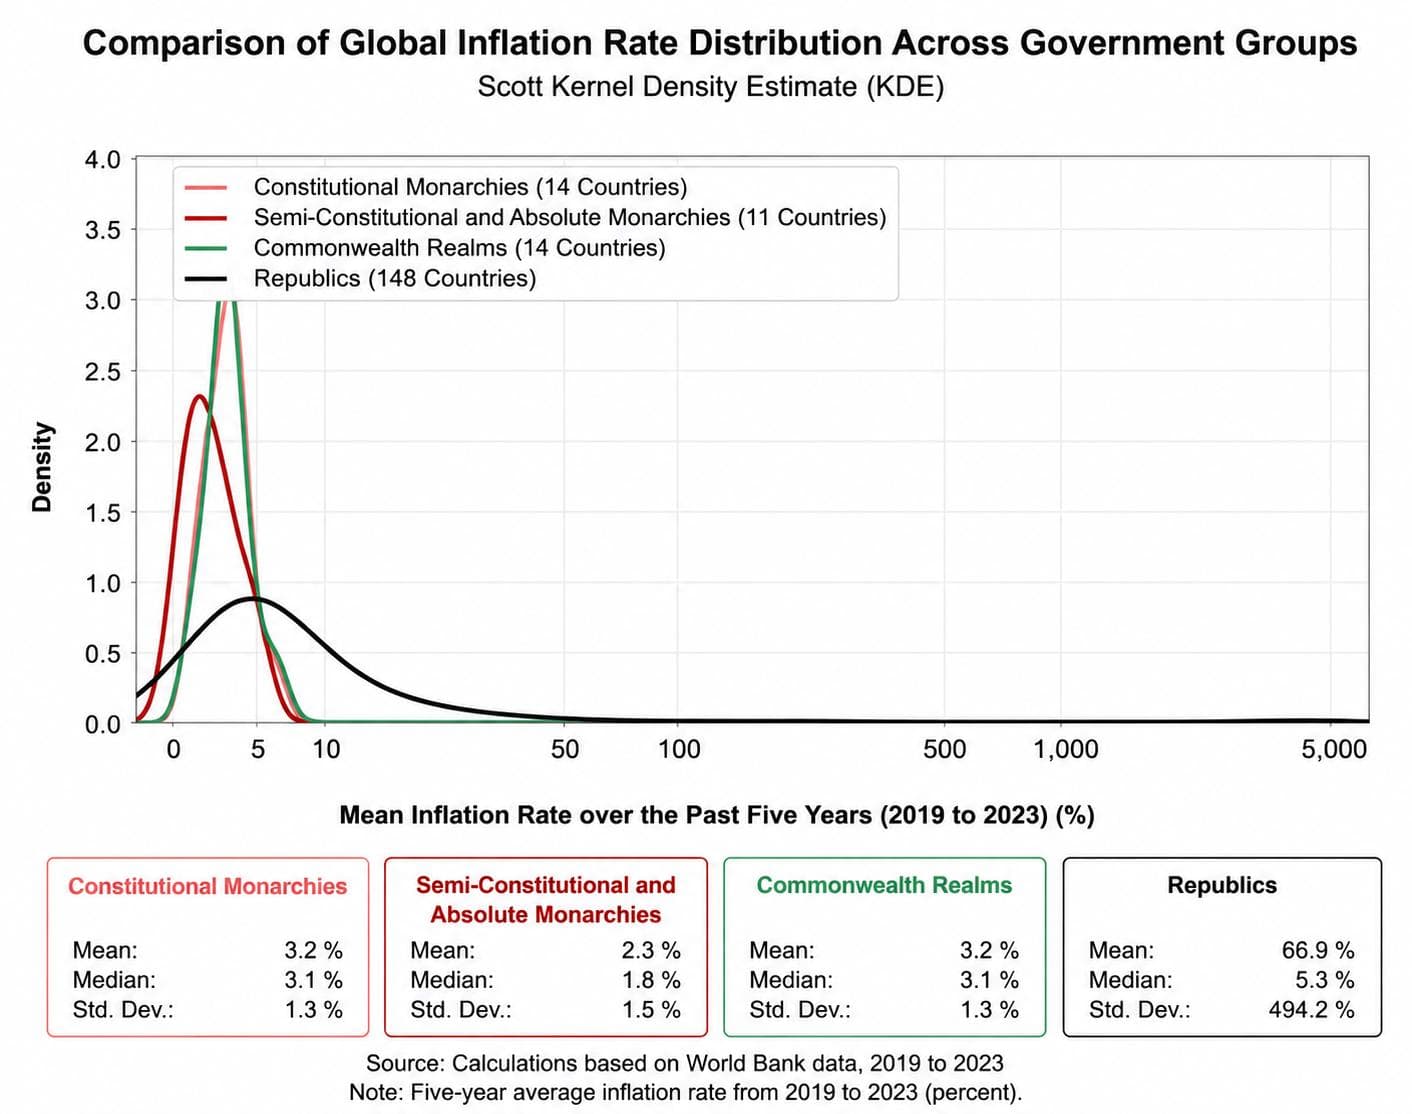
The kernel density estimate shows that all three groups—constitutional monarchies, semi-constitutional and absolute monarchies, and Commonwealth realms—are concentrated within the range of low inflation rates, with substantial overlap among their distributions. Among these three groups, semi-constitutional and absolute monarchies are slightly shifted toward lower inflation rates, while constitutional monarchies and Commonwealth realms display very similar distributional patterns.
In contrast, the distribution for republics is considerably more dispersed and, owing to the presence of countries with extremely high inflation, exhibits a long right tail extending toward much larger values. Overall, this pattern suggests that inflation outcomes across the three monarchy-related groups have been more concentrated and stable, whereas republics have experienced substantially greater variation in inflation rates.