

Monarchy & Republic in the Laboratory of History by N. Fakhr - HTML preview
Download the book in PDF, ePub for a complete version.
Government Effectiveness
We now turn to an indicator that may capture the “protective” dimension of government more clearly than almost any other. If the “New or Modern Monarchy” hypothesis is correct, governments with greater institutional stability would be expected to maintain higher-quality public services even during periods of crisis and to prevent political and economic turmoil from excessively disrupting the lives of citizens, particularly the most vulnerable groups.
To assess this dimension, the World Bank provides an indicator known as Government Effectiveness. This indicator evaluates the quality of public services, the effectiveness of the civil service, the quality of policy implementation, the relative independence of public services from political pressures, and the credibility of the government’s commitment to implementing its policies. Put simply, the indicator reflects the extent to which a government is capable of continuing to provide essential services to its citizens without serious disruption, even under difficult circumstances.
From the perspective of the “New or Modern Monarchy” hypothesis, this indicator is particularly important. Just as responsible parents seek, as far as possible, to shield their children from the pressures and difficulties of life, a government that does not see its role merely as the exercise of power, but rather regards itself as a guardian of the welfare and security of its citizens, would be expected to make its greatest effort during times of crisis to preserve the quality of public services and protect the most vulnerable segments of society.
Like the other World Bank governance indicators examined in this book, Government Effectiveness is reported as a percentile rank. Thus, a country with a percentile rank of 80 has performed better in government effectiveness than approximately 80 percent of the countries in the world.
We can now examine the average percentile rank of Government Effectiveness among the world’s monarchies and republics and determine whether the results are consistent with the predictions of the “New or Modern Monarchy” hypothesis.
The data used in this section are from the World Bank for 2023 (Appendix RDS-G01).
Comparison of the “Government Effectiveness” Indicator Between Monarchies and Republics Worldwide
Indicator: Government Effectiveness
Data year: 2023
Source: World Bank data
For this indicator, a higher value represents better government performance in terms of the quality of public services, the quality of the civil service, policy implementation, and the effectiveness of the executive system.
Data Check
Group |
Countries with Available Data |
Monarchies |
28 |
Republics |
151 |
1. Descriptive Statistics
Group |
n |
Mean |
Median |
Sample SD |
Monarchies |
28 |
74.63 |
80.20 |
24.02 |
Republics |
151 |
42.03 |
40.35 |
26.93 |
Interpretation of Descriptive Statistics
The mean Government Effectiveness score is 74.63 for monarchies and 42.03 for republics.
The medians are:
- Monarchies: 80.20
- Republics: 40.35
These differences indicate that, in this dataset, monarchies exhibit higher levels of government effectiveness both in terms of the mean and the central tendency of the distribution.
The substantial gap between the medians also indicates that the observed difference is not merely driven by a few exceptionally high-performing countries, but is also evident in the main body of the distributions.
2. Welch’s Test for the Difference in Means
Hypotheses
Null hypothesis (H₀):
The mean Government Effectiveness score is equal in monarchies and republics.
Alternative hypothesis (H₁):
The mean Government Effectiveness score differs between the two groups.
Welch’s Test Results
Item |
Value |
Mean — Monarchies |
74.63 |
Mean — Republics |
42.03 |
Difference in means |
32.60 |
t-statistic |
6.44 |
Approximate degrees of freedom |
39.8 |
p-value |
< 0.001 |
Interpretation of Welch’s Test
The p-value is far below the conventional 5% significance level. The null hypothesis is therefore rejected.
This result indicates that the difference in mean Government Effectiveness between monarchies and republics worldwide is statistically significant.
In other words, within this dataset, monarchies have a higher average Government Effectiveness score than republics.
3. Mann–Whitney U Test
To examine differences in the overall distributions without relying on an assumption of normality, the Mann–Whitney U test was also conducted.
Mann–Whitney U Test Results
Item |
Value |
U statistic |
approximately 3,420 |
p-value |
< 0.001 |
Interpretation of the Mann–Whitney U Test
This test likewise indicates that the distributions of Government Effectiveness scores differ significantly between monarchies and republics.
The agreement between the results of these two independent statistical tests suggests that the observed difference is not limited to a difference in means, but is also evident in the overall pattern of the distributions.
Summary
Group |
Mean Government Effectiveness |
Monarchies |
74.63 |
Republics |
42.03 |
Test |
Result |
Welch’s t-test |
Significant difference (p < 0.001) |
Mann–Whitney U |
Significant difference (p < 0.001) |
Final Result
Among countries with available data in 2023, monarchies have, on average, higher Government Effectiveness scores than republics, and the difference is statistically significant in both statistical tests.
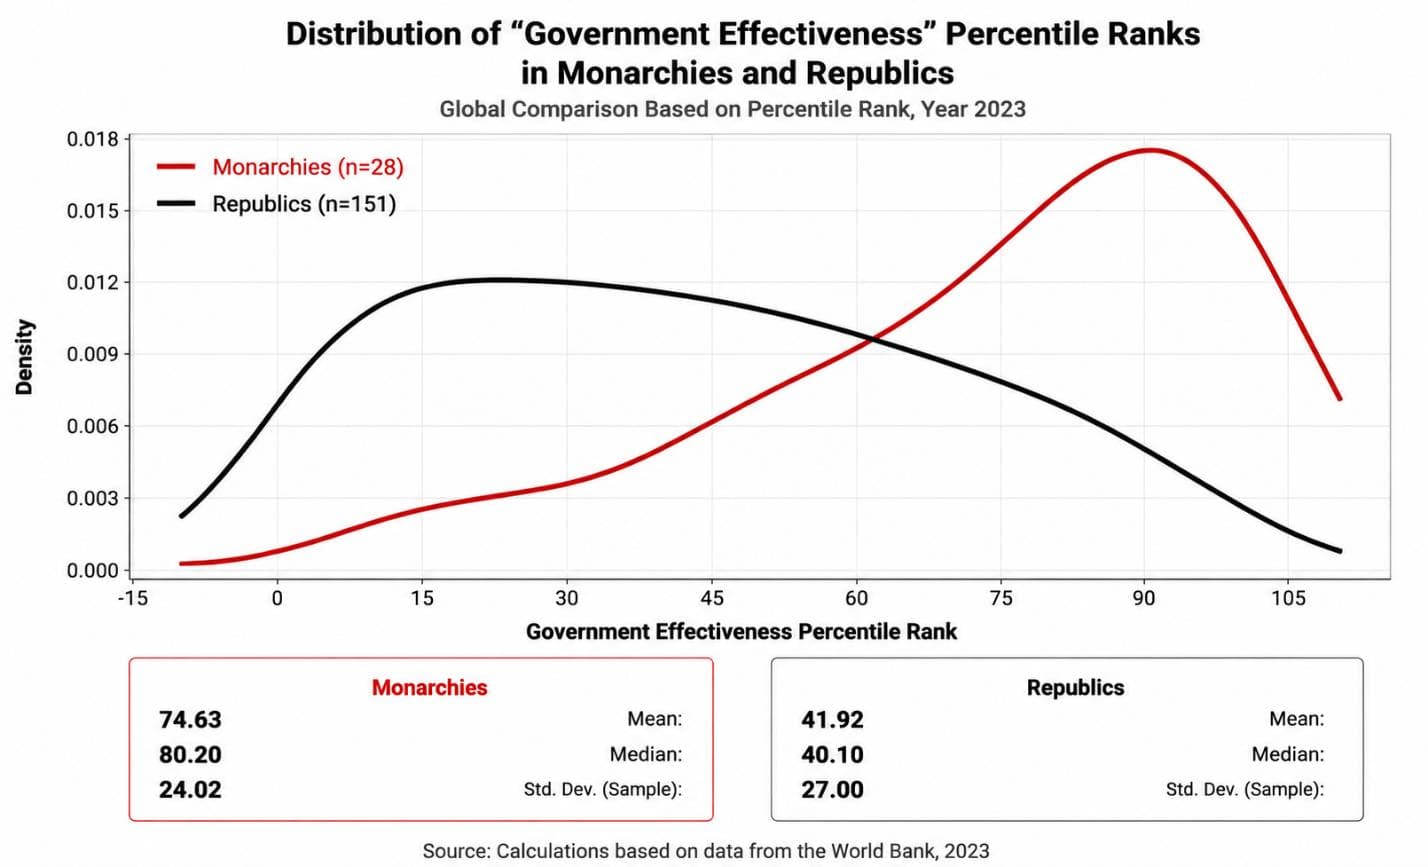
The distribution curve for monarchies is noticeably shifted toward the right side of the chart, indicating that these countries are concentrated at higher percentile ranks on the Government Effectiveness indicator. In contrast, the distribution for republics is concentrated more heavily in the left half of the chart and also shows greater dispersion.
The limited overlap between the two curves indicates that, although both groups include countries with relatively weak or strong performance, monarchies as a whole tend to occupy substantially higher levels of government effectiveness. This visual pattern is consistent with the statistical test results and suggests that the observed difference between the two groups is not driven merely by a few exceptional countries, but is also evident in the overall distribution of the data.
Comparison of the “Government Effectiveness” Indicator Between Constitutional and Non-Constitutional Monarchies Worldwide
To examine differences in performance among types of monarchy, monarchies were divided into two groups: constitutional monarchies and semi-constitutional and absolute monarchies. Descriptive statistics for the two groups, based on their 2023 percentile ranks on the Government Effectiveness indicator, are presented below:
Type of Monarchy |
Number of Countries |
Mean Percentile Rank |
Median |
Sample SD |
Constitutional monarchies |
15 |
78.14 |
84.40 |
24.36 |
Semi-constitutional and absolute monarchies |
13 |
70.58 |
74.50 |
23.93 |
The mean percentile rank for Government Effectiveness is 78.14 among constitutional monarchies and 70.58 among semi-constitutional and absolute monarchies. Thus, the mean for the first group is approximately 7.56 percentile points higher than that of the second group. The median is also higher among constitutional monarchies: 84.40 compared with 74.50. The degree of dispersion is very similar in the two groups, with a standard deviation of approximately 24 percentile points in each.
Test of the Difference Between Means
To determine whether the observed difference between the two groups is statistically significant, Welch’s t-test was used.
Statistical Measure |
Value |
Difference between group means |
7.56 |
Welch’s t-statistic |
0.826 |
Approximate degrees of freedom |
25.56 |
p-value |
0.416 |
95% CI for the difference between means |
−11.26 to 26.37 |
Hedges’ g |
0.30 |
The p-value is 0.416, which is greater than the 0.05 significance level. Therefore, the null hypothesis of equal means cannot be rejected, and the observed difference between constitutional monarchies and semi-constitutional and absolute monarchies is not statistically significant.
The 95% confidence interval extends from approximately 11.26 percentile points in favor of the second group to 26.37 percentile points in favor of the first group, and includes zero. Thus, the available data do not provide sufficient evidence to establish a consistent difference between the mean scores of the two groups.
Hedges’ g is 0.30, indicating a small effect size. This suggests that although constitutional monarchies have a numerical advantage in both the mean and the median, the difference is relatively small compared with the within-group variation.
Summary
On the Government Effectiveness indicator, constitutional monarchies have higher mean and median scores than semi-constitutional and absolute monarchies. However, the statistical test indicates that the difference is not significant, and the effect size is small. On the basis of these data, therefore, we cannot conclude that either type of monarchy is systematically more effective than the other.
At the same time, this result indicates that the relatively strong performance of monarchies as a whole compared with republics is not confined to only one type of monarchy, since both groups of monarchies have relatively high mean percentile ranks on the Government Effectiveness indicator. This comparison, however, concerns the observed performance of the two groups and does not by itself establish a causal relationship.
Comparison of the “Government Effectiveness” Indicator Between Commonwealth Realms and Republics Worldwide
To examine the performance of Commonwealth realms, the percentile ranks on the Government Effectiveness indicator for 14 Commonwealth realms were compared with those of republics worldwide. Descriptive statistics for the two groups are presented below.
Type of Government |
Number of Countries |
Mean Percentile Rank |
Median |
Sample SD |
Commonwealth realms |
14 |
58.24 |
58.75 |
23.48 |
Republics worldwide |
402 |
48.59 |
48.10 |
29.34 |
The mean percentile rank for Government Effectiveness among Commonwealth realms is 58.24, compared with 48.59 among republics worldwide. Thus, the mean for Commonwealth realms is approximately 9.65 percentile points higher than that of republics. The median is also higher among Commonwealth realms (58.75) than among republics (48.10). The standard deviation is somewhat lower among Commonwealth realms, suggesting slightly less variation in performance within this group.
Test of the Difference Between Means
To assess the statistical significance of this difference, Welch’s t-test was used.
Statistical Measure |
Value |
Difference between group means |
9.65 |
Welch’s t-statistic |
1.497 |
Approximate degrees of freedom |
14.45 |
p-value |
0.156 |
95% CI for the difference between means |
−4.14 to 23.43 |
Hedges’ g |
0.33 |
The p-value (p = 0.156) is greater than the 0.05 significance level. Therefore, the null hypothesis of equal means cannot be rejected, and the observed difference between Commonwealth realms and republics worldwide is not statistically significant.
The 95% confidence interval extends from approximately 4.14 percentile points in favor of republics to 23.43 percentile points in favor of Commonwealth realms and includes zero. The available data therefore do not provide sufficient evidence to establish a consistent difference between the two groups.
Hedges’ g is 0.33, which falls within the range of a small effect. Thus, although Commonwealth realms perform better on average than republics worldwide, the magnitude of the difference is relatively limited.
Summary
Commonwealth realms show higher mean and median Government Effectiveness scores than republics worldwide, but the statistical test indicates that this difference is not significant at the 5% level, and the effect size is small. On the basis of the available data, therefore, we cannot conclude that Commonwealth realms systematically outperform republics worldwide on this indicator. This comparison concerns the observed performance of the two groups and does not, by itself, establish a causal relationship.
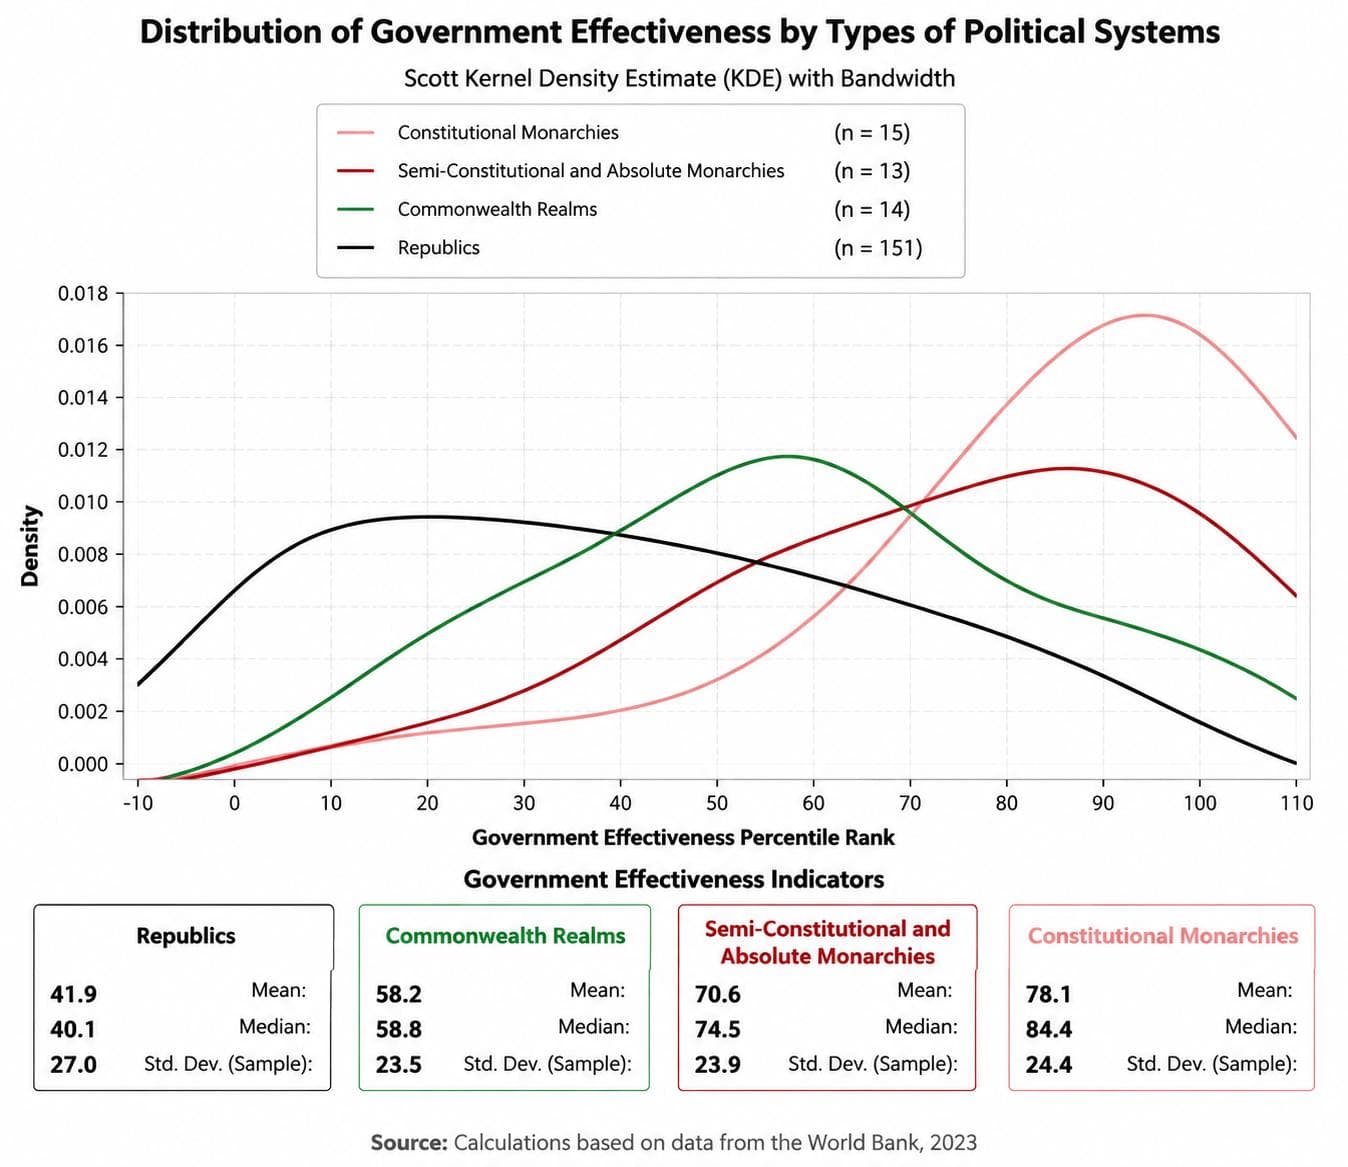
The kernel density estimate shows that the distribution of the Government Effectiveness indicator for constitutional monarchies is generally concentrated at higher levels of the index, with the greatest density of observations occurring among high effectiveness scores. Semi-constitutional and absolute monarchies, although somewhat more dispersed, are also concentrated primarily in the upper half of the distribution.
In contrast, the distribution of republics is broader, with a substantial portion concentrated at lower levels of the indicator. Commonwealth realms are also concentrated mainly within the relatively high range of government effectiveness, and their distribution is closer to that of constitutional monarchies than to that of republics.
Overall, the shapes of the distributions indicate that high Government Effectiveness scores are more concentrated among the monarchy groups than among republics. However, any final judgment regarding the statistical significance of these differences depends on the results of the statistical tests presented in the following analysis.
Comparison of the “Government Effectiveness” Indicator Between Monarchies and Republics Across Continents and in the Middle East
Comparison of Government Effectiveness Between Monarchies and Republics in Asia
To examine the performance of the two systems of government at the continental level, the percentile ranks on the Government Effectiveness indicator for 13 Asian monarchies were compared with those of 33 Asian republics. The data are from 2023.
Descriptive Statistics
Type of Government |
Number of Countries |
Mean Percentile Rank |
Median |
Sample SD |
Asian monarchies |
13 |
72.68 |
74.50 |
17.50 |
Asian republics |
33 |
37.78 |
34.00 |
28.48 |
The mean percentile rank for Government Effectiveness is 72.68 among Asian monarchies and 37.78 among Asian republics. Thus, the mean for monarchies is approximately 34.90 percentile points higher than that for republics.
The median shows the same pattern: half of the Asian monarchies have a percentile rank above 74.50, whereas the median for Asian republics is only 34.00. In addition, the standard deviation is substantially higher among republics. Thus, the performance of Asian republics is not only lower on average but also considerably more dispersed.
Test of the Difference Between Means
To determine whether the observed difference is merely the result of sampling variation or is supported statistically, Welch’s t-test was used.
Statistical Measure |
Value |
Difference between group means |
34.90 |
Welch’s t-statistic |
5.031 |
Approximate degrees of freedom |
35.58 |
p-value |
0.000014 |
95% CI for the difference between means |
20.82 to 48.98 |
Hedges’ g |
1.32 |
The resulting p-value is approximately 0.000014, far below the 0.05 significance level. The null hypothesis of equal means is therefore rejected, indicating that the difference in Government Effectiveness between Asian monarchies and republics is highly statistically significant.
The 95% confidence interval indicates that the mean for Asian monarchies is estimated to be between approximately 20.82 and 48.98 percentile points higher than the mean for Asian republics. Because the entire interval favors monarchies and does not include zero, the result provides strong statistical evidence of a difference between the two groups.
Hedges’ g is 1.32, indicating a very large effect size. This means that the difference between the two groups is not only statistically significant but also substantial in practical terms.
Summary
The Asian data present a clear picture of the difference in performance between the two groups. Asian monarchies have substantially higher percentile ranks on the Government Effectiveness indicator in terms of both the mean and the median. Their performance is also less dispersed, whereas Asian republics display a much wider range, extending from very weak to very strong performance.
Overall, the evidence from this comparison is consistent with the “New or Modern Monarchy” hypothesis: in Asia, countries that have retained a monarchical system have recorded substantially stronger performance in Government Effectiveness than republics. The very large effect size further indicates that the observed difference is substantial in performance terms, rather than merely statistically detectable.
This comparison, however, concerns the observed difference in performance between the two groups and does not, by itself, establish a causal relationship.
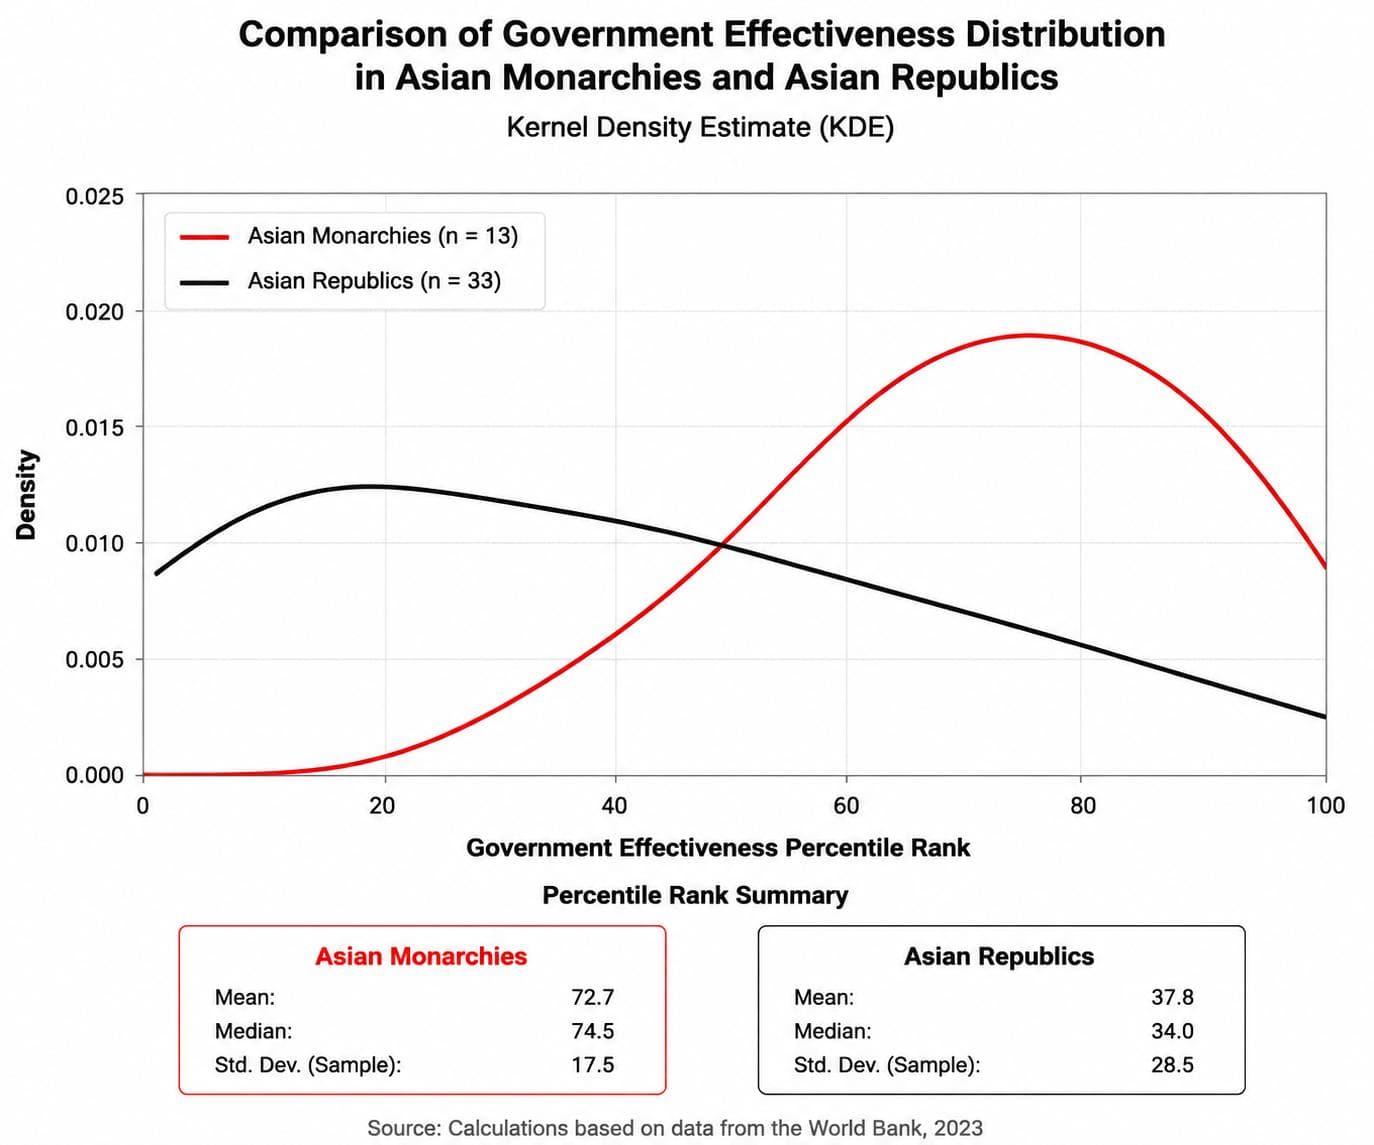
The kernel density estimate (KDE) plot shows that the distribution of the Government Effectiveness indicator for Asian monarchies is noticeably shifted toward higher percentile ranks, with the greatest concentration of this group occurring in the upper half of the distribution. In contrast, the distribution of Asian republics is more dispersed, with most observations concentrated in the lower and middle percentile ranks. The limited overlap between the two curves also suggests that a substantial proportion of Asian monarchies rank higher in government effectiveness than most Asian republics. However, the final assessment of the statistical significance of these differences is based on the results of the statistical tests presented in this chapter.
Comparison of Government Effectiveness in European Monarchies and Republics
To compare the performance of the two forms of government in Europe, the percentile ranks of the Government Effectiveness indicator for 11 European monarchies were compared with those of 34 European republics. The data are for 2023.
Descriptive Statistics
Form of Government |
Number of Countries |
Mean Percentile Rank |
Median |
Sample Standard Deviation |
European Monarchies |
11 |
92.11 |
95.80 |
7.85 |
European Republics |
34 |
66.45 |
68.40 |
22.42 |
The mean percentile rank for Government Effectiveness is 92.11 among European monarchies and 66.45 among the republics of the continent. Thus, the mean for the monarchies is approximately 25.66 percentile points higher than that of the republics.
The median confirms the same pattern. The median for European monarchies is 95.80, meaning that at least half of these countries rank within approximately the top five percent of countries worldwide in terms of government effectiveness. By comparison, the median for European republics is 68.40.
Another important difference concerns dispersion. The standard deviation among the monarchies is only 7.85, compared with 22.42 among the republics. European monarchies therefore form a much more homogeneous group in addition to having a substantially higher mean. European republics span a much wider range, from republics with very high government effectiveness to countries with relatively weak performance.
Test of the Difference Between Means
To determine whether the difference between the two groups is statistically significant, Welch’s t-test was used.
Statistical Measure |
Value |
Difference between group means |
25.66 |
Welch’s t-statistic |
5.682 |
Approximate degrees of freedom |
42.57 |
p-value |
0.0000011 |
95% CI for the mean difference |
16.55 to 34.77 |
Hedges’ g |
1.26 |
The p-value is approximately 0.0000011, far below both the 0.05 and 0.001 significance levels. The null hypothesis of equal means is therefore rejected, and the observed difference between European monarchies and republics is highly statistically significant.
The 95% confidence interval indicates that the mean percentile rank of European monarchies is approximately 16.55 to 34.77 percentile points higher than that of European republics. The entire interval lies above zero, clearly indicating that the direction of the difference favors the monarchies.
Hedges’ g is 1.26, representing a very large effect size. Thus, the difference between the two groups is not only statistically significant but also substantial in practical and performance terms.
Interpretation of the Results
Europe is an especially important case because it includes several of the world’s most successful republics, such as Switzerland, Finland, Ireland, Iceland, and Germany. Despite the presence of these highly successful republics, the overall mean for European monarchies remains substantially higher.
Part of the difference between the two group means is influenced by the greater heterogeneity among European republics. The republican group includes both Western and Northern European countries with very high government effectiveness and some republics in Eastern and Southeastern Europe with considerably lower percentile ranks. By contrast, nearly all European monarchies are concentrated in the upper part of the global distribution.
Importantly, the advantage of the monarchies is not driven solely by a few exceptional cases. Even the lower values among European monarchies are relatively high, and most of these countries have percentile ranks close to or above 90. This concentration at high levels produces both a very high mean and median and a remarkably low degree of dispersion among the monarchies.
Conclusion
The comparison of European countries shows that monarchies have recorded substantially stronger performance in Government Effectiveness than the republics of the continent as a whole. Monarchies have higher means and medians, less variation in performance, a highly statistically significant difference in means, and a very large effect size.
This finding is consistent with the “New or Modern Monarchy” hypothesis. European monarchies display very high and stable levels of government effectiveness not only relative to the global average, but even within a continent that includes many of the world’s most successful republics.
This comparison, however, concerns the observed difference in performance between the two groups and does not, by itself, establish a causal relationship.
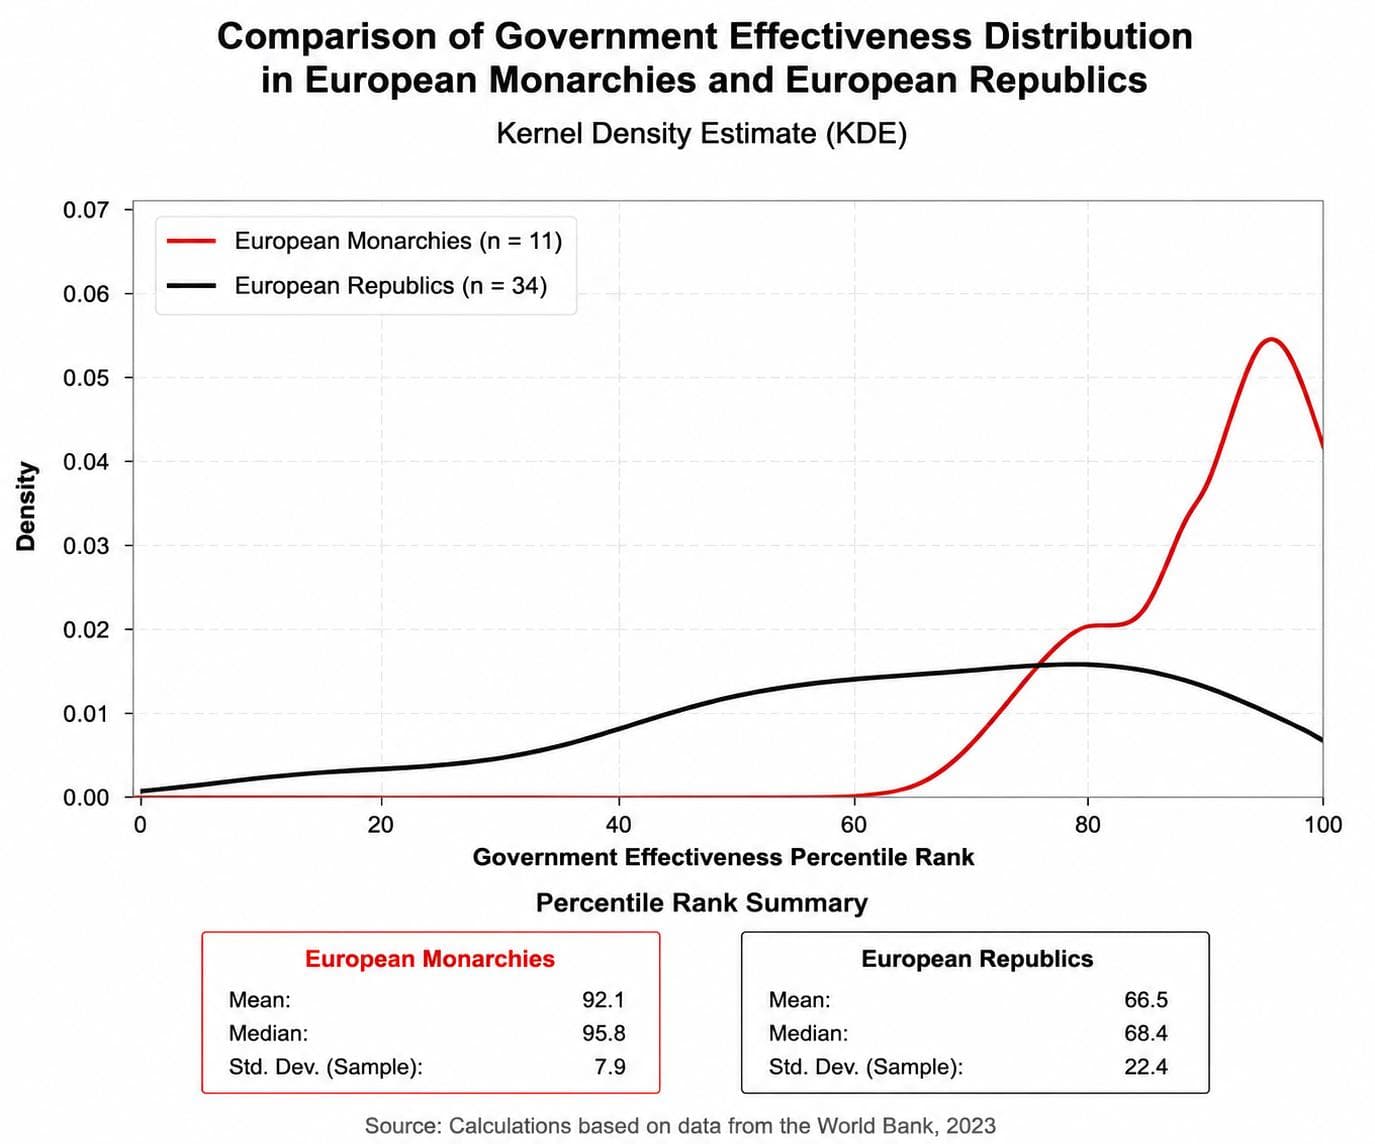
The kernel density estimate (KDE) plot shows that the distribution of the Government Effectiveness indicator for European monarchies is clearly concentrated at very high percentile ranks, with the greatest density occurring near the upper end of the indicator. In contrast, the distribution of European republics is more dispersed; although part of the distribution also lies at high percentile ranks, a substantial concentration is observed at intermediate levels. The relatively limited overlap between the two curves indicates that, overall, European monarchies have performed better than European republics in terms of government effectiveness. However, the final assessment of the statistical significance of this difference is based on the results of the statistical tests presented in this chapter.
Comparison of Government Effectiveness in European Monarchies and European Republics with No History of Communist Rule
Form of Government |
Number of Countries |
Mean |
Median |
Standard Deviation |
European Monarchies |
11 |
92.11 |
95.80 |
7.85 |
European Republics with No History of Communist Rule |
13 |
83.05 |
85.40 |
12.73 |
The mean Government Effectiveness percentile rank of European monarchies is 9.06 percentile points higher. Welch’s t-test indicates that this difference is just within the conventional threshold of statistical significance:
Statistical Measure |
Value |
Welch’s t-statistic |
2.131 |
Degrees of freedom |
20.30 |
p-value |
0.046 |
95% confidence interval |
0.20 to 17.91 |
Hedges’ g |
0.81 |
Thus, even after excluding republics with a history of communist rule, European monarchies continue to have a higher mean level of government effectiveness. The difference is statistically significant at the 5% level, and the effect size is large. However, the p-value is close to the significance threshold, and the result should therefore be interpreted in light of the relatively small sample sizes of the two groups. This comparison, by itself, does not establish a causal relationship.
Nevertheless, this restricted comparison should not replace the main comparison. From a methodological perspective, excluding European republics with a history of communist rule from the overall analysis is not justified, because these countries constitute a real part of the historical experience of republican government in Europe. Excluding them could introduce a form of selection bias by removing unfavorable cases from the performance record of republics. Within the analytical framework of this book, the movement of some republics toward communism, the establishment of one-party rule, and the institutional legacies that followed are not treated merely as external factors independent of the form of government, but as part of the historical trajectories and potential consequences of the republican experience itself. Republics with a history of communist rule should therefore remain in the main comparison.
Comparison of Government Effectiveness in Monarchies and Republics in Africa, the Americas, and Oceania
Because the number of independent monarchies in Africa, the Americas, and Oceania is limited, monarchies and Commonwealth realms, where applicable, are treated as a single group in this section and compared with republics on the same continent. Given the small sample sizes in some groups, these comparisons are primarily descriptive.
Africa
Descriptive Statistics
Form of Government |
Number of Countries |
Mean |
Median |
Standard Deviation |
Monarchies |
3 |
28.60 |
19.30 |
18.59 |
Republics |
41 |
26.89 |
21.20 |
20.35 |
In Africa, the mean Government Effectiveness score of the continent’s three monarchies is slightly higher than that of the republics, but the difference between the two groups is very small. Their medians are also close, and there is no substantial difference in the dispersion of their performance. Thus, unlike in Asia and Europe, Africa shows no clear advantage for either form of government.
The Americas
Descriptive Statistics
Form of Government |
Number of Countries |
Mean |
Median |
Standard Deviation |
Commonwealth Realms |
9 |
60.70 |
61.80 |
14.77 |
Republics |
24 |
41.08 |
37.95 |
20.45 |
In the Americas, Commonwealth realms perform, on average, approximately 20 percentile points better than republics. In addition to their higher mean, their median is substantially higher, while their lower standard deviation indicates more consistent performance. This finding is consistent with the pattern observed in Asia and Europe.
Oceania
Descriptive Statistics
Form of Government |
Number of Countries |
Mean |
Median |
Standard Deviation |
Monarchies and Commonwealth Realms |
6 |
52.47 |
40.60 |
32.64 |
Republics |
8 |
55.60 |
57.05 |
13.28 |
In Oceania, republics have slightly higher means and medians than the group comprising monarchies and Commonwealth realms. However, performance within the monarchy/Commonwealth group is highly dispersed: countries such as Australia and New Zealand rank among the world’s highest performers, whereas some other Commonwealth realms and the monarchy of Tonga have considerably lower percentile ranks. As a result, the pattern in Oceania appears to reflect the substantial heterogeneity within this group more than the form of government itself.
Conclusion
The comparison across these three continents shows that the pattern observed in Asia and Europe is not reproduced with equal strength throughout the world. In Africa, there is little difference between the two groups; in the Americas, Commonwealth realms perform substantially better and more consistently than republics; and in Oceania, the small number of countries and the considerable heterogeneity within the monarchy/Commonwealth group prevent a clear pattern from emerging.
These comparisons are therefore primarily descriptive and should be interpreted with caution. As elsewhere in this book, they show observed differences in group performance and do not, by themselves, establish a causal relationship.
Comparison of Government Effectiveness in Middle Eastern Monarchies and Republics
To compare the performance of the two forms of government in the Middle East, the region’s seven monarchies were compared with ten Middle Eastern republics using World Bank data for 2023.
Descriptive Statistics
Form of Government |
Number of Countries |
Mean Percentile Rank |
Median |
Standard Deviation |
Middle Eastern Monarchies |
7 |
73.20 |
74.50 |
14.95 |
Middle Eastern Republics |
10 |
28.64 |
12.30 |
30.77 |
The mean Government Effectiveness percentile rank is 73.20 for Middle Eastern monarchies and 28.64 for the region’s republics. Thus, the mean for monarchies is approximately 44.56 percentile points higher.
The median confirms the same pattern. The median for monarchies is 74.50, compared with only 12.30 for republics. Moreover, the standard deviation among the republics is more than twice that of the monarchies, indicating considerably greater heterogeneity in the performance of Middle Eastern republics.
Test of the Difference Between Means
To assess the statistical significance of the difference between the two groups, Welch’s t-test was used.
Statistical Measure |
Value |
Difference between group means |
44.56 |
Welch’s t-statistic |
3.960 |
Approximate degrees of freedom |
13.75 |
p-value |
0.00147 |
95% CI for the mean difference |
20.38 to 68.74 |
Hedges’ g |
1.65 |
The p-value (p = 0.00147) is far below both the 0.05 and 0.01 significance levels. The null hypothesis of equal means is therefore rejected, and the observed difference is highly statistically significant.
The 95% confidence interval indicates that the mean Government Effectiveness percentile rank of Middle Eastern monarchies is between 20.38 and 68.74 percentile points higher than that of the region’s republics. Because the entire interval lies above zero, the direction of the difference clearly favors the monarchies.
Hedges’ g is 1.65, indicating a very large effect size. Thus, the difference between the two groups is not only statistically significant but also substantial in practical terms.
Conclusion
The results show that Middle Eastern monarchies have performed substantially better than the region’s republics on the Government Effectiveness indicator. Their mean and median percentile ranks are considerably higher, their performance is less dispersed, and the statistical test indicates a highly significant difference between the two groups. This finding is consistent with the “New or Modern Monarchy” hypothesis in the Middle East as well.
As in the other sections of this book, however, this comparison identifies an observed difference in performance between the two groups and does not, by itself, establish a causal relationship.
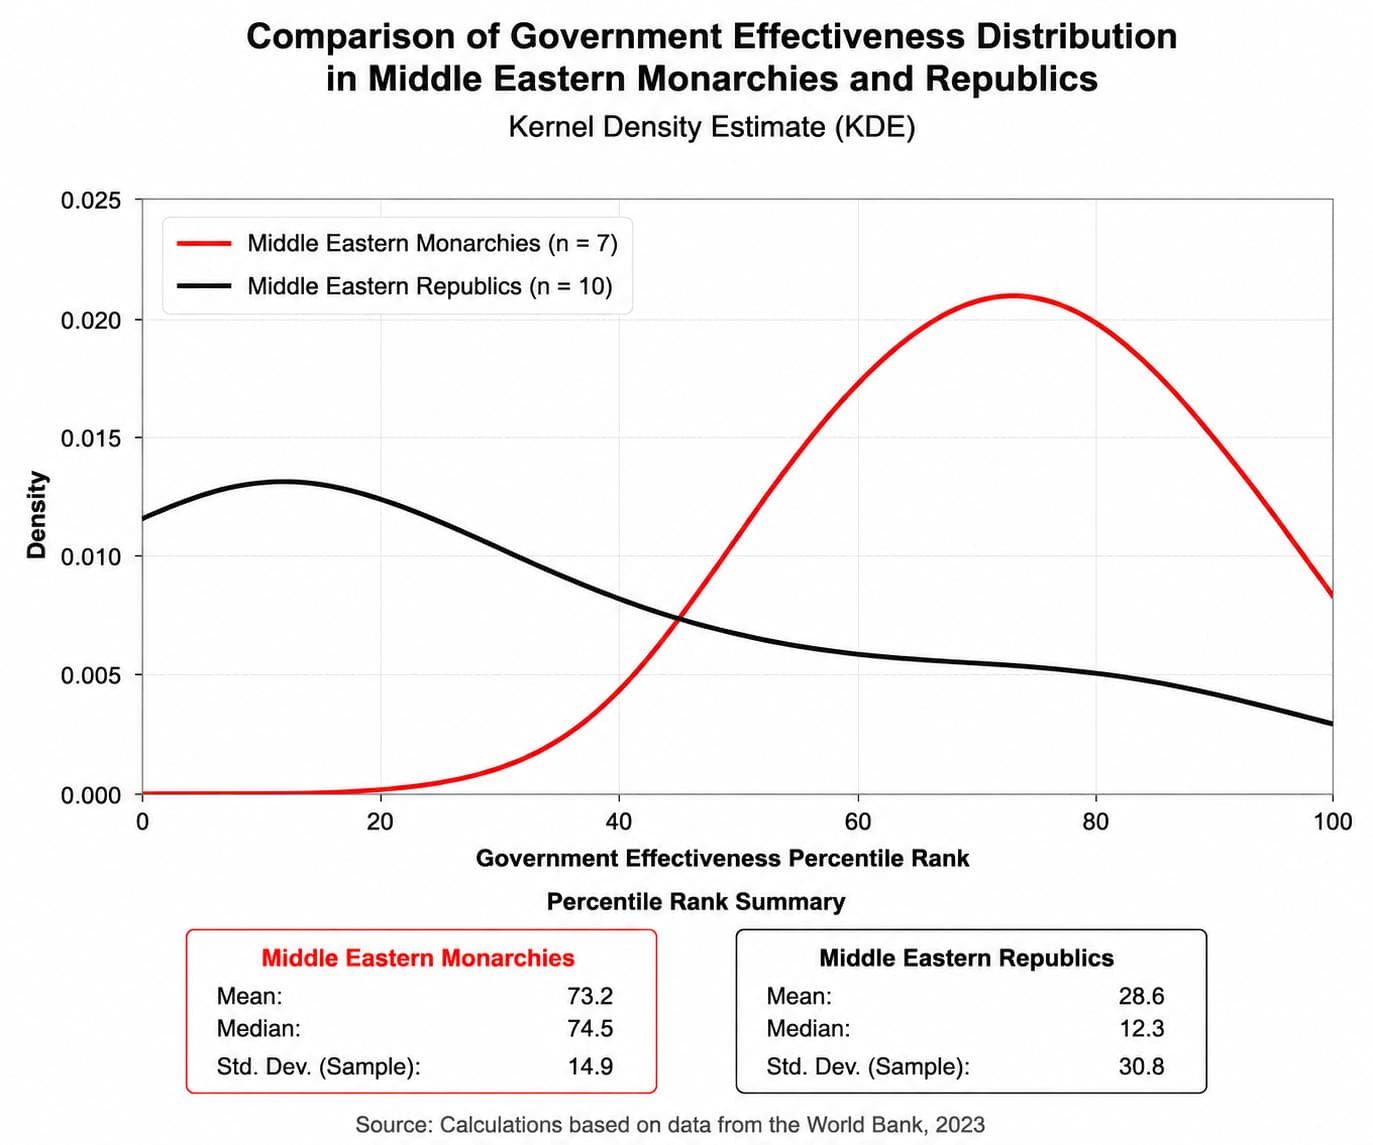
The kernel density estimate shows that the distribution of the Government Effectiveness Index for Middle Eastern monarchies is concentrated predominantly at higher percentile ranks, whereas the region’s republics are more heavily concentrated in the lower and middle ranges. The substantial separation and limited overlap between the two curves indicate a marked difference in the distribution of this indicator across the two forms of government. Overall, Middle Eastern monarchies perform better than the region’s republics on the Government Effectiveness Index.
Status of the “New or Modern Monarchy” Hypothesis After the Seventh Indicator
Now that the Government Effectiveness indicator has been examined using the same methodology, and its results also favor monarchies, the status of the hypothesis can be updated as follows:
Test |
Indicator |
Result |
✓ |
GDP per Capita |
Consistent with the hypothesis |
✓ |
GDP per Capita, PPP |
Consistent with the hypothesis |
◐ |
Gini Coefficient |
Mixed evidence; difference favors the hypothesis |
✓ |
Political Stability and Absence of Violence |
Consistent with the hypothesis |
✓ |
Regulatory Quality |
Consistent with the hypothesis |
✓ |
Rule of Law |
Consistent with the hypothesis |
✓ |
Government Effectiveness |
Consistent with the hypothesis |