

Monarchy & Republic in the Laboratory of History by N. Fakhr - HTML preview
Download the book in PDF, ePub for a complete version.
Comparison of the Rule of Law Indicator Across Continents and the Middle East
Comparison of the Rule of Law Indicator in Asian Monarchies and Republics
Indicator: Rule of Law
A higher value on this indicator represents stronger rule of law, more effective enforcement of laws, and better-performing legal institutions.
Data Check
Group |
Number of Countries with Data |
Asian Monarchies |
13 |
Asian Republics |
33 |
1. Descriptive Statistics
Group |
Number (n) |
Mean |
Median |
Sample SD |
Asian Monarchies |
13 |
66.73 |
67.50 |
16.57 |
Asian Republics |
33 |
33.21 |
32.50 |
24.83 |
Interpretation of Descriptive Statistics
The mean Rule of Law score is 66.73 for Asian monarchies and 33.21 for Asian republics.
The medians are:
- Monarchies: 67.50
- Republics: 32.50
This difference shows that, in this dataset, Asian monarchies not only have a higher mean, but the central value of their distribution is also approximately twice that of the republics. Thus, the observed difference is not merely driven by a few exceptionally high-performing countries; it is also evident in the central part of the distributions.
2. Welch’s t-test for the Difference in Means
Hypotheses
Null hypothesis (H₀):
The mean Rule of Law score is equal in Asian monarchies and republics.
Alternative hypothesis (H₁):
The mean Rule of Law score differs between the two groups.
Welch’s t-test Results
Item |
Value |
Mean — Monarchies |
66.73 |
Mean — Republics |
33.21 |
Difference in Means |
33.52 |
t-statistic |
5.314 |
Approximate degrees of freedom |
32.96 |
p-value |
0.0000073 |
Interpretation of Welch’s t-test
The p-value is far below the 5% significance level.
Therefore, the null hypothesis is rejected.
This result indicates that the difference in the mean Rule of Law scores between Asian monarchies and republics is statistically significant.
3. Mann–Whitney U Test
To examine whether the overall distributions of the two groups differ without relying on the assumption of normality, a Mann–Whitney U test was also conducted.
Mann–Whitney U Test Results
Item |
Value |
U-statistic |
379 |
p-value |
0.000063 |
Interpretation of the Mann–Whitney U Test
The p-value is below the 5% significance level.
Therefore, the null hypothesis is rejected.
This test also indicates a statistically significant difference between the distributions of Rule of Law scores in Asian monarchies and republics.
The agreement between the results of these two independent tests indicates that the observed difference is not limited to the group means but is also evident in the overall pattern of the distributions.
Summary
Group |
Mean Rule of Law Score |
Asian Monarchies |
66.73 |
Asian Republics |
33.21 |
Test results:
Test |
Result |
Welch’s t-test |
p = 0.0000073 → Statistically significant |
Mann–Whitney U |
p = 0.000063 → Statistically significant |
Final conclusion:
Among Asian countries with available data, monarchies have, on average, higher Rule of Law scores than republics, and the difference is statistically significant according to both statistical tests.
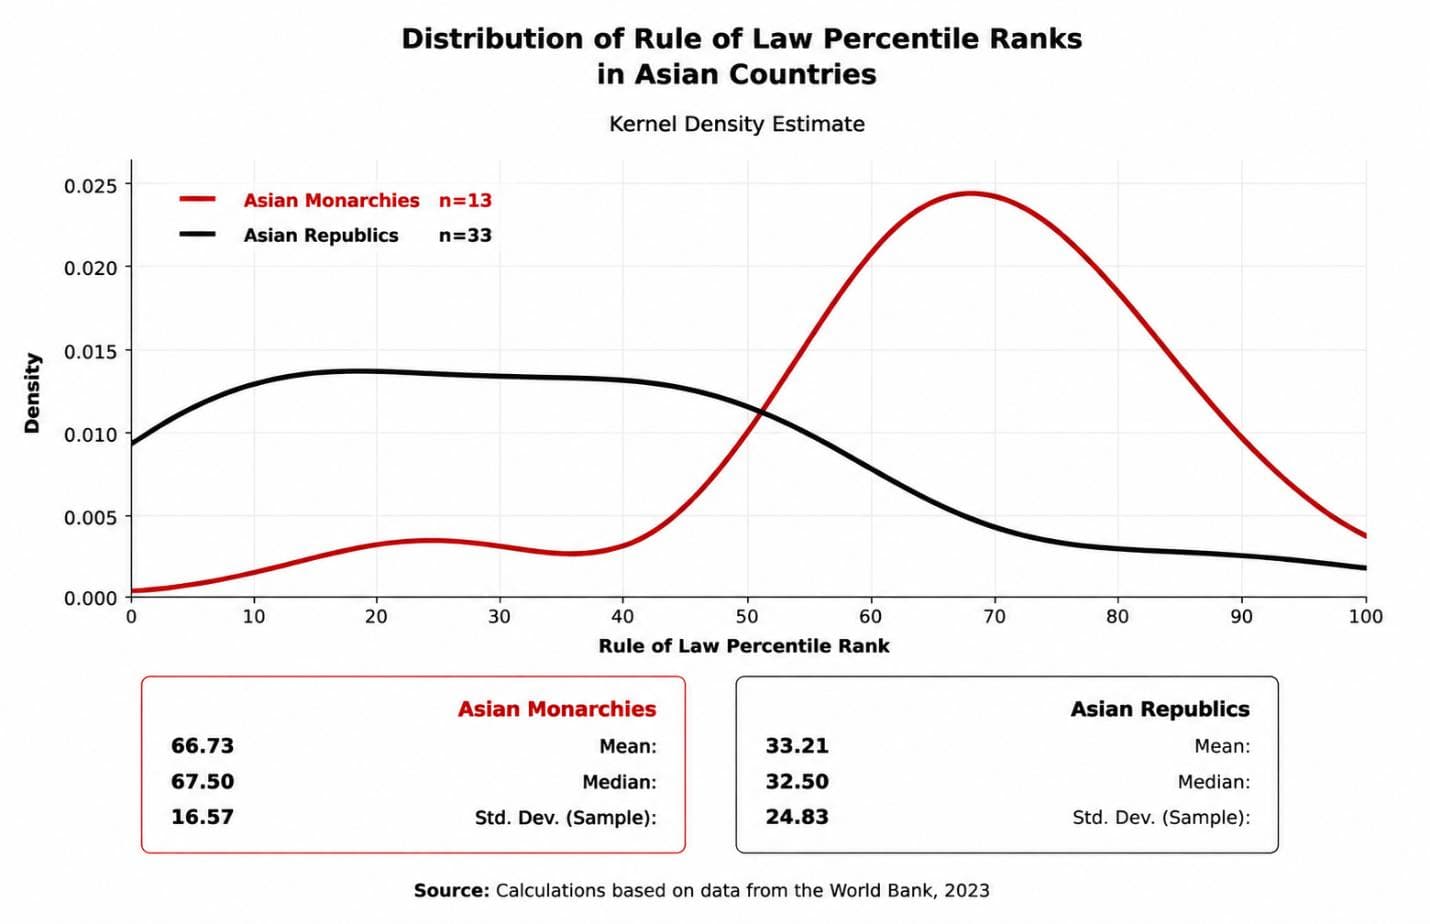
The distribution curve for Asian monarchies is noticeably shifted toward higher Rule of Law scores, while the curve for Asian republics is more concentrated in the lower and middle ranges of the index. The greater dispersion of the republics’ curve also indicates more heterogeneous performance within this group.
Overall, the figure confirms the descriptive advantage of Asian monarchies, a pattern that is also consistent with the statistically significant result of Welch’s t-test and the large effect size.
Comparison of the Rule of Law Indicator Between Monarchies and Republics in Europe
For this indicator, higher values represent stronger rule of law, more effective enforcement of laws, and better-performing legal institutions.
Data Check — Europe
Group |
Number of Countries with Data |
European Monarchies |
11 |
European Republics |
34 |
1. Descriptive Statistics
Group |
Number (n) |
Mean |
Median |
Sample SD |
European Monarchies |
11 |
91.80 |
93.40 |
7.00 |
European Republics |
34 |
66.23 |
67.00 |
25.04 |
Interpretation of Descriptive Statistics
The mean Rule of Law score is 91.80 for European monarchies and 66.23 for European republics.
The medians are:
- Monarchies: 93.40
- Republics: 67.00
This difference indicates that European monarchies occupy a higher position in terms of the Rule of Law indicator both in their mean and at the center of their distribution.
The lower dispersion among monarchies also indicates that countries in this group have relatively more similar Rule of Law performance, whereas European republics display a much wider range of outcomes.
2. Welch’s t-test for the Difference in Means
The hypotheses were defined as follows:
Null hypothesis (H₀):
The mean Rule of Law score is equal in European monarchies and republics.
Alternative hypothesis (H₁):
The mean Rule of Law score differs between the two groups.
Welch’s t-test Results
Item
Value
Mean — Monarchies
91.80
Mean — Republics
66.23
Difference in Means
25.57
t-statistic
5.12
Approximate degrees of freedom
38.9
p-value
0.000008
Interpretation of Welch’s t-test
The p-value is far below the conventional 5% significance level.
Therefore, the null hypothesis is rejected.
This result indicates that the difference in mean Rule of Law scores between European monarchies and republics is statistically significant.
3. Mann–Whitney U Test
To examine the difference between the two groups without relying on the assumption of normally distributed data, a Mann–Whitney U test was also conducted.
Mann–Whitney U Test Results
Item |
Value |
U-statistic |
280 |
p-value |
0.0008 |
Interpretation of the Mann–Whitney U Test
The p-value is below the 5% significance level.
Therefore, the null hypothesis is rejected.
This test also indicates that Rule of Law values in European monarchies and republics differ significantly in terms of their ranks.
The consistency of the two independent tests is important: Welch’s t-test identifies a statistically significant difference in means, while the Mann–Whitney U test provides significant evidence of a rank-based difference between the groups. Thus, the observed result is not limited to the difference in means alone.
Summary
Group |
Mean Rule of Law Score |
European Monarchies |
91.80 |
European Republics |
66.23 |
The statistical tests produced the following results:
Test |
Result |
Welch’s t-test |
p = 0.000008 → Statistically significant |
Mann–Whitney U |
p = 0.0008 → Statistically significant |
Final Conclusion
Among European countries with available data, monarchies have, on average, higher Rule of Law scores than republics, and the difference is statistically significant according to both statistical tests.
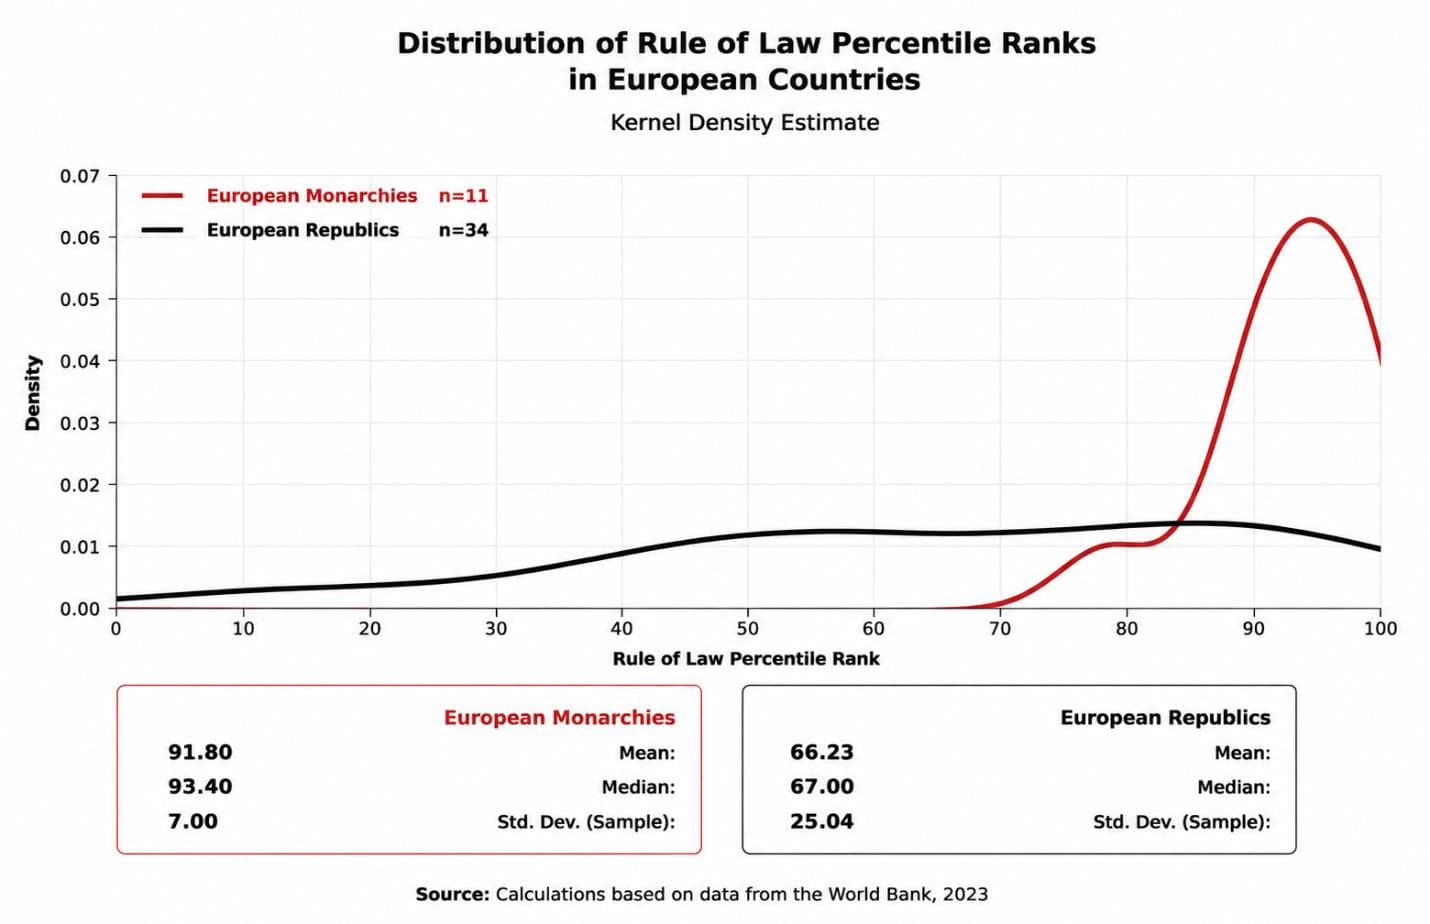
The distribution curve for European monarchies is concentrated entirely in the upper range of the Rule of Law indicator. Compared with the curve for European republics, it is both shifted to the right and considerably less dispersed. In contrast, the distribution for republics covers a much wider range, extending from countries with very high scores to those with relatively low scores.
This pattern indicates that European monarchies not only have a higher average level of Rule of Law, but also display greater consistency and homogeneity in their performance on this indicator. The figure is therefore consistent with the results of Welch’s t-test and the large effect size, and confirms the descriptive advantage of European monarchies over the republics of the continent.
Europe Robustness Test: Rule of Law
To examine the role of the communist legacy in the observed difference between European monarchies and republics, republics that had previously experienced communist rule were excluded from this comparison. In this robustness test, 11 European monarchies were compared with 13 European republics that had never experienced communist rule.
Indicator |
European Monarchies |
Republics with No Communist History |
Number of countries |
11 |
13 |
Mean |
92.62 |
84.95 |
Median |
93.40 |
91.50 |
Sample standard deviation |
6.08 |
14.47 |
The mean Rule of Law score is 7.67 points higher in European monarchies. The scores are also considerably less dispersed among monarchies: the standard deviation among the republics is more than twice that of the monarchies.
Welch’s t-test
The two-tailed Welch’s t-test yielded:
t = 1.739, df = 16.65, p = 0.1005
Thus, at the conventional 5% significance level, the difference between the two group means is not statistically significant.
The Hedges’ g effect size is:
g = 0.647
indicating a moderate-to-large effect in favor of the monarchies.
Thus, excluding republics with a history of communist rule reduces the gap between European monarchies and republics, but does not eliminate it. Monarchies still have a higher mean, and the magnitude of the difference remains practically notable. However, given the number of countries available for this comparison, the evidence is insufficient to establish statistical significance in a two-tailed test.
One statistical point is also worth noting. If the book’s directional hypothesis—that Rule of Law is higher in monarchies—had been specified in advance, the one-tailed p-value would be approximately 0.05025. This is extremely close to, but still slightly above, the 5% threshold. It is therefore preferable not to describe the result as statistically significant even under the one-tailed test.
Nevertheless, this restricted comparison should not replace the main comparison. From a methodological standpoint, excluding European republics with a communist past from the overall analysis is not warranted, because these countries constitute a real part of the historical experience of republican government in Europe. Removing them could introduce a form of selection bias by excluding unfavorable cases from the historical record of republics. Within the analytical framework of this book, the movement of some republics toward communism, the establishment of one-party rule, and the institutional legacies left by those experiences are not treated simply as external factors wholly independent of the form of government; rather, they are considered part of the historical trajectories and possible outcomes of the republican experience. Republics with a communist past should therefore remain in the main comparison.
Comparing non-communist republics with monarchies is useful only as a supplementary robustness check or sensitivity analysis. It shows how much the observed gap changes when countries with that particular historical background are excluded. The results of this supplementary test indicate that part of the large difference between European monarchies and republics is associated with the lower performance of republics with a communist past, but the descriptive advantage of monarchies remains even after those countries are excluded.
At the same time, this supplementary analysis does not, by itself, establish that republican government directly caused countries to become communist. Rather, it shows that removing such historical trajectories from an assessment of political systems would provide an incomplete picture of their actual historical experience.
Comparison of the Rule of Law Indicator in Monarchies and Republics in Africa, the Americas, and Oceania
Continent |
Country Group |
Number |
Mean |
Median |
Sample SD |
Africa |
Monarchies |
3 |
36.97 |
34.00 |
10.47 |
Africa |
Republics |
50 |
27.71 |
24.75 |
19.58 |
Americas |
Commonwealth Realms |
9 |
61.26 |
66.00 |
17.53 |
Americas |
Republics |
26 |
40.35 |
38.45 |
24.62 |
Oceania |
Monarchy and Commonwealth Realms |
6 |
68.33 |
74.55 |
26.91 |
Oceania |
Republics |
9 |
62.48 |
68.40 |
18.35 |
In Africa, the mean score for monarchies is approximately 9.25 points higher than that of republics. The median is also higher among monarchies, while their lower dispersion suggests relatively more homogeneous performance, although the number of African monarchies is very small.
In the Americas, the Commonwealth realms occupy a clearly higher position. Their mean is approximately 20.90 points higher, and their median 27.55 points higher, than those of the republics. The republics also exhibit greater dispersion.
In Oceania, the monarchy and Commonwealth realms still have higher mean and median scores, although the gap between the two groups is smaller. The difference in means is approximately 5.86 points, while the difference in medians is 6.15 points. In this region, however, dispersion is greater among the monarchy and Commonwealth group than among the republics.
Overall, in all three regions, both the mean and median Rule of Law scores are higher for monarchies or Commonwealth realms than for republics. The magnitude of this descriptive advantage, however, is greatest in the Americas and smallest in Oceania.
Comparison of the Rule of Law Indicator in Middle Eastern Monarchies and Republics
Country Group |
Number |
Mean |
Median |
Sample SD |
Middle Eastern Monarchies |
7 |
67.80 |
65.60 |
8.99 |
Middle Eastern Republics |
10 |
28.81 |
20.95 |
27.83 |
The mean Rule of Law score in Middle Eastern monarchies is 38.99 points higher than in the region’s republics. The median is also approximately 44.65 points higher among monarchies. In addition, the substantially lower standard deviation among monarchies indicates considerably more homogeneous performance, whereas Middle Eastern republics display much greater variation.
Welch’s t-test produced the following results:
- t = 4.133
- df = 11.502
- p = 0.0015
- Mean difference = 38.99 points
- 95% confidence interval for the mean difference: 18.33 to 59.65
- Hedges’ g = 1.66
Thus, the difference between the two groups is highly statistically significant, and the very large effect size indicates that the gap between Middle Eastern monarchies and republics is substantial rather than marginal. Within this regional comparison, the monarchies not only have markedly higher mean and median Rule of Law scores, but also display considerably greater consistency and homogeneity in their performance. Nevertheless, this comparison describes the observed difference in performance between the two groups and does not, by itself, establish a causal relationship.
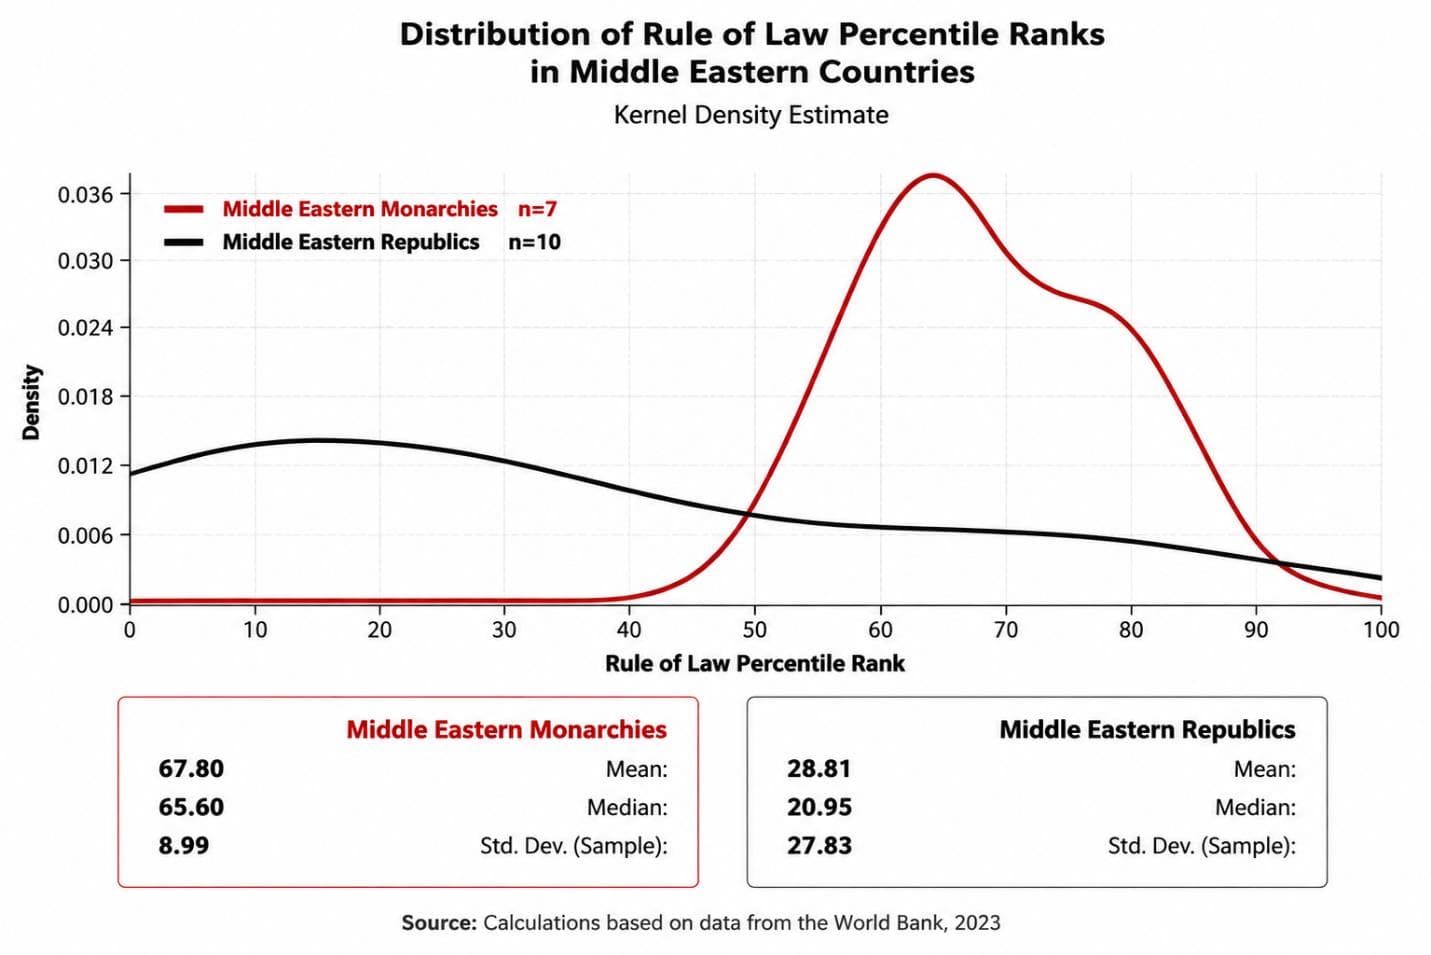
The distribution curve for Middle Eastern monarchies is clearly concentrated in the higher ranges of the Rule of Law Index, whereas the curve for republics is spread mainly across lower scores and exhibits greater dispersion. This pattern is consistent with the substantial difference between the mean scores of the two groups and the very large effect size obtained in the statistical analysis.
Status of the “New or Modern Monarchy” Hypothesis After the Sixth Indicator
Summary:
The “New or Modern Monarchy” hypothesis has so far been evaluated through six independent tests. Across all six, the findings have been consistent with the predictions of the hypothesis, and no result has contradicted it. However, since additional indicators will be examined in the following sections, a final assessment of the hypothesis will be deferred until all tests in the book have been completed.
Test |
Indicator |
Result |
✓ |
GDP per Capita |
Consistent with the hypothesis |
✓ |
Purchasing Power per Capita |
Consistent with the hypothesis |
◐ |
Gini Coefficient |
Mixed evidence; difference favors the hypothesis |
✓ |
Political Stability and Absence of Violence |
Consistent with the hypothesis |
✓ |
Regulatory Quality |
Consistent with the hypothesis |
✓ |
Rule of Law |
Consistent with the hypothesis |