

Monarchy & Republic in the Laboratory of History by N. Fakhr - HTML preview
Download the book in PDF, ePub for a complete version.
Rule of Law
In assessing the record of “Order,” we have so far seen that monarchies, on average, performed better than republics on the Regulatory Quality indicator. However, having sound laws and regulations is not sufficient, by itself, to establish order. Law demonstrates its real value when it is enforced in practice, when rights and obligations are reliable, and when citizens, businesses, and government institutions can have confidence in the mechanisms through which the law is enforced.
For this reason, the next step is to examine the Rule of Law indicator.
The World Bank also publishes this indicator as part of the Worldwide Governance Indicators (WGI) and reports it in the form of a percentile rank (Appendix RDS-F01). As explained earlier, the percentile rank indicates a country’s relative position compared with the other countries assessed; thus, a higher value represents a more favorable position. The data used in this section are from 2023.
The Rule of Law indicator reflects perceptions of the extent to which agents have confidence in and abide by the rules of society. Among other factors, it incorporates the quality of contract enforcement, property rights, the police and the courts, as well as the likelihood of crime and violence. Thus, the indicator does not merely measure the existence of laws; rather, it provides a picture of how reliably rules and legal institutions operate and are enforced in practice.
If the “New or Modern Monarchy” hypothesis introduced earlier can explain part of the variation in government performance, we would expect its effects not to end with the formulation of laws and regulations, but to be observable, at least to some extent, in the rule and enforcement of law as well. This, however, is merely a testable prediction, and the data will determine whether it is supported. We must therefore examine whether the Rule of Law indicator also reveals a pattern consistent with the hypothesis or instead poses a challenge to it.
Global Comparison of the “Rule of Law” Indicator Between Monarchies and Republics
Indicator: Rule of Law
Source: World Bank
Data year: 2023
For this indicator, a higher percentile rank represents a more favorable position in terms of the rule of law.
1. Descriptive Statistics
Group |
n |
Mean |
Median |
Sample SD |
Monarchies |
28 |
73.72 |
78.55 |
21.55 |
Republics |
152 |
41.85 |
39.60 |
27.49 |
Interpretation of the Descriptive Statistics
The mean percentile rank for the Rule of Law indicator is 73.72 for monarchies and 41.85 for republics, representing a difference of approximately 31.87 percentile-rank points between the two groups.
The medians point in the same direction:
- Monarchies: 78.55
- Republics: 39.60
The observed difference, therefore, is not confined to the means. The substantially higher median among monarchies indicates that the pattern is not merely the result of a few monarchies with exceptionally high rankings, but is also evident in the central part of the distribution.
The sample standard deviation is also higher among republics (27.49) than among monarchies (21.55), indicating greater dispersion in Rule of Law scores among republics. Descriptive statistics alone, however, cannot establish whether the difference between the groups is statistically significant. Inferential tests are therefore required.
2. Welch’s t-Test for the Difference in Means
The hypotheses were defined as follows:
Null hypothesis (H₀): The mean percentile rank for the Rule of Law indicator is equal in monarchies and republics.
Alternative hypothesis (H₁): The mean percentile rank for the Rule of Law indicator differs between the two groups.
Welch’s Test Results
Statistic |
Value |
Mean — Monarchies |
73.72 |
Mean — Republics |
41.85 |
Difference in means |
31.87 |
t-statistic |
6.86 |
Approximate degrees of freedom |
45.0 |
Two-sided p-value |
< 0.001 |
Interpretation of Welch’s Test
The p-value is far below the conventional 5% significance level. The null hypothesis is therefore rejected.
The result indicates that the difference in the mean percentile rank for the Rule of Law indicator between monarchies and republics worldwide is statistically significant. In the 2023 data, the mean for monarchies is approximately 31.87 percentile-rank points higher than that for republics.
It is important to note that the data used here are expressed as percentile ranks. Accordingly, the 31.87-point difference should not be interpreted as meaning that the rule of law is “31.87 percent better” in monarchies. Rather, it represents the difference between the average positions of the two groups on the indicator’s percentile-rank scale.
3. Mann–Whitney U Test
To examine the difference between the two groups from another perspective, without relying on an assumption of normally distributed data, the nonparametric Mann–Whitney U test was also performed. This test is based on the ranking of observations.
The hypotheses were defined as follows:
Null hypothesis (H₀): Rule of Law values in the two groups do not differ significantly in terms of their ranks.
Alternative hypothesis (H₁): Rule of Law values in the two groups differ significantly in terms of their ranks.
Mann–Whitney U Test Results
Statistic |
Value |
U-statistic |
3,437 |
Two-sided p-value |
< 0.001 |
Interpretation of the Mann–Whitney U Test
The result of this test likewise indicates that Rule of Law values in monarchies and republics differ significantly in terms of their ranks.
Given that both the mean and median are substantially higher among monarchies, the direction of the observed difference is toward higher Rule of Law values in the monarchy group.
The convergence of the two tests is important. Welch’s test identifies a statistically significant difference in the means, while the Mann–Whitney test provides significant evidence of a rank-based difference between the groups. The result, therefore, does not depend on the choice of a single statistical method.
Summary
For the 2023 data:
Group |
Mean Rule of Law Percentile Rank |
Monarchies |
73.72 |
Republics |
41.85 |
The statistical tests produced the following results:
Test |
Result |
Welch’s t-test |
p < 0.001 → Significant |
Mann–Whitney U |
p < 0.001 → Significant |
Conclusion
Among countries with available data in 2023, monarchies had, on average, a higher percentile rank on the Rule of Law indicator than republics. The difference between the group means was approximately 31.87 percentile-rank points, and both statistical tests indicated a significant difference between the two groups. The substantially higher median among monarchies further suggests that the observed difference is not merely driven by a small number of exceptionally high-performing countries, but is also evident in the central part of the distribution.
This finding is consistent with the prediction of the “New or Modern Monarchy” hypothesis and indicates that the pattern previously observed for Regulatory Quality is repeated in the Rule of Law indicator. Nevertheless, as with the other comparisons in this study, this finding is based on observational data and does not, by itself, establish a causal relationship between the form of government and the rule of law. Levels of development, institutional history, social structures, political stability, and historical and geographical factors may also contribute to differences in countries’ performance.
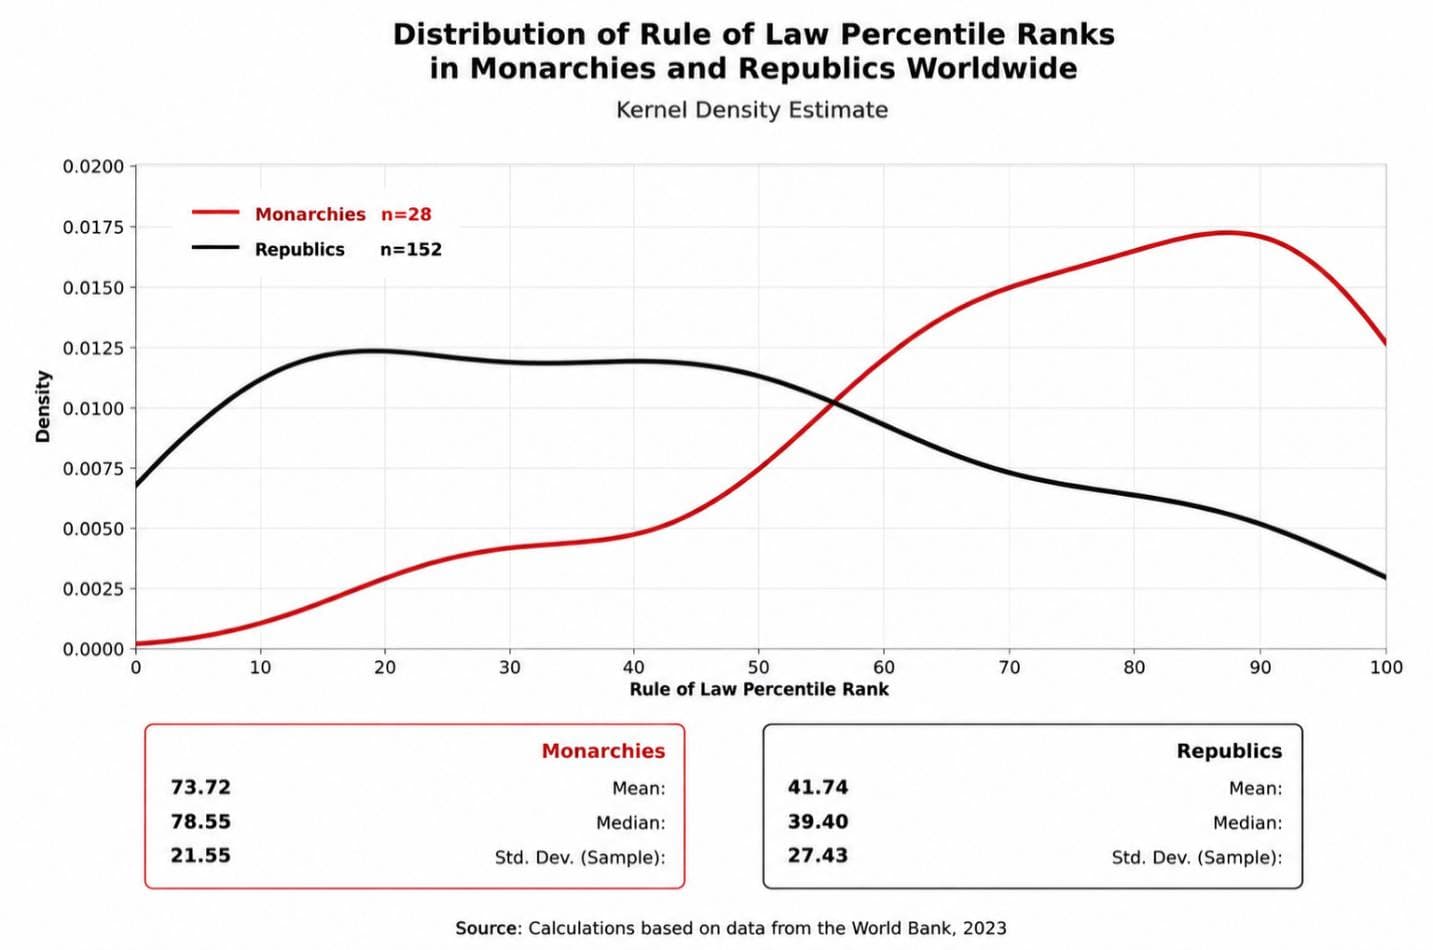
The distribution curve for monarchies (red) is noticeably shifted toward higher Rule of Law scores compared with the curve for republics (black). The greater concentration of the red curve in the higher-score range, together with the limited overlap between the two curves, indicates that monarchies generally performed better on this indicator in the 2023 data. Nevertheless, the two distributions still overlap to some extent, and exceptions can be observed in both groups. This pattern is also consistent with the results of the statistical tests presented in this section.
Comparison of the Rule of Law Index between Constitutional and Non-Constitutional Monarchies Worldwide
Among monarchies, the mean Rule of Law score is 78.21 for constitutional monarchies and 66.15 for semi-constitutional and absolute monarchies. The median is also higher among constitutional monarchies, at 89.60, compared with 68.90 for the other group. These descriptive statistics indicate that constitutional monarchies, on average, achieved higher Rule of Law scores.
However, Welch’s t-test showed that the difference was not statistically significant. Therefore, based on the available data, there is insufficient statistical evidence to conclude that the type of monarchy, among monarchies themselves, is associated with a significant difference in Rule of Law performance.
Comparison of the Rule of Law Index between Commonwealth Realms and Republics Worldwide
For the Rule of Law indicator, the 14 Commonwealth realms have a mean of 63.88, a median of 66.95, and a standard deviation of 21.93. In comparison, the 152 republics worldwide have a mean of 41.74, a median of 39.40, and a standard deviation of 27.43.
Thus, the mean score of the Commonwealth realms is approximately 22.14 points higher than that of the republics. Welch’s t-test indicates that this difference is statistically significant:
t = 3.53, df = 16.99, p = 0.0026
The 95% confidence interval for the mean difference ranges from 8.91 to 35.36 points. Since this interval does not include zero, it is consistent with the result of the significance test. The effect size, measured by Hedges’ g, is 0.82, indicating a relatively large difference between the two groups.
Overall, the 2023 data show that the Commonwealth realms performed better than the world’s republics on the Rule of Law indicator not only descriptively, but also by a statistically significant margin.
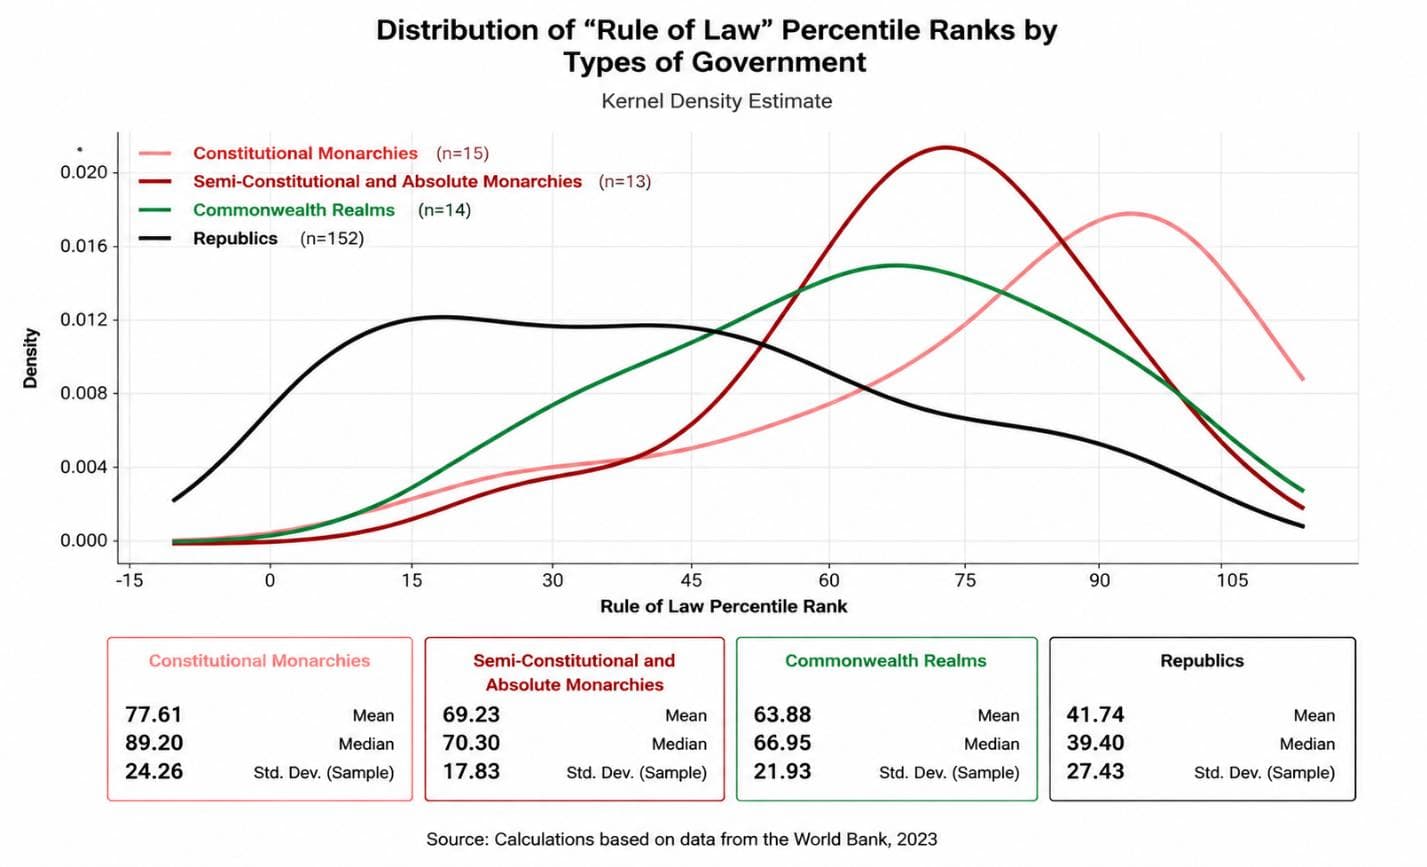
The chart shows that the distribution of scores for constitutional monarchies is shifted more strongly toward the higher end of the Rule of Law indicator than that of the other groups. With a mean of 77.61 and a median of 89.20, this group ranks highest among the four. They are followed by semi-constitutional and absolute monarchies, with a mean of 69.23, and Commonwealth realms, with a mean of 63.88. In contrast, the distribution for republics is more concentrated in the middle and lower ranges of the indicator, with a mean of only 41.74.
At the same time, the overlap among the curves indicates that there is no clear-cut boundary separating the different types of government, and countries with varying levels of performance can be found within each group. Nevertheless, the overall rightward shift of the three monarchy-related distributions relative to that of the republics indicates that, in the 2023 data, these countries generally achieved higher Rule of Law scores. The lower dispersion among semi-constitutional and absolute monarchies also indicates that the scores within this group were more closely clustered around their mean, whereas republics displayed the greatest heterogeneity among the four groups.