

Monarchy & Republic in the Laboratory of History by N. Fakhr - HTML preview
Download the book in PDF, ePub for a complete version.
Comparison of the Corruption Perceptions Index in Monarchies and Republics Across Continents and the Middle East
Comparison of the Corruption Perceptions Index in Asian Monarchies and Republics
Descriptive Statistics
Type of Government |
Number of Countries |
Mean |
Median |
Standard Deviation |
Asian Monarchies |
13 |
51.00 |
50.00 |
14.39 |
Asian Republics |
32 |
33.41 |
33.00 |
15.32 |
The mean Corruption Perceptions Index score is 51.00 for Asian monarchies and 33.41 for Asian republics. Thus, Asian monarchies score, on average, 17.59 points higher than the republics of the continent.
The medians point in the same direction. The median score is 50 for monarchies and 33 for republics, meaning that the median country among Asian monarchies scores 17 points higher than the median Asian republic.
The standard deviations of the two groups are also very similar (14.39 and 15.32, respectively). Thus, the observed difference cannot be attributed simply to differences in the dispersion of the data.
Test of the Difference in Means
To assess the statistical significance of the difference in means, Welch’s t-test was used.
Statistical Measure |
Value |
Mean difference (monarchies minus republics) |
17.59 |
Welch’s t-statistic |
3.65 |
Approximate degrees of freedom |
23.65 |
Two-tailed p-value |
0.0013 |
95% confidence interval |
7.63 to 27.56 |
Hedges’ g |
1.15 |
Welch’s test shows that the difference in mean Corruption Perceptions Index scores between Asian monarchies and republics is highly statistically significant (p = 0.0013). The 95% confidence interval also lies entirely above zero, confirming the higher scores of the monarchies.
Hedges’ g is 1.15, indicating a large effect. Thus, the observed difference is not only statistically significant but also substantial in practical terms.
Mann–Whitney Test
To ensure that the conclusion does not depend on the assumptions of the parametric test, the nonparametric Mann–Whitney test was also conducted.
Statistical Measure |
Value |
U statistic |
344 |
Two-tailed p-value |
0.00068 |
Rank-biserial correlation |
0.65 |
The Mann–Whitney test also confirms the difference between the two groups with very strong statistical evidence (p < 0.001). The rank-biserial correlation of 0.65 indicates a large effect, showing that Corruption Perceptions Index scores are generally substantially higher among Asian monarchies than among the republics of the continent.
Conclusion
In 2023, Asian monarchies performed substantially better than Asian republics on the Corruption Perceptions Index. Both the mean and the median were considerably higher among monarchies, and both Welch’s test and the Mann–Whitney test confirm the difference with very strong statistical evidence. The large effect sizes in both tests further indicate that the difference is substantial not only statistically but also in practical terms.
Overall, the Asian data in this study indicate that monarchies on the continent had lower levels of perceived public-sector corruption than Asian republics. As in the other sections of the book, however, this finding represents an observational association and does not by itself establish a causal relationship between the form of government and the level of corruption.
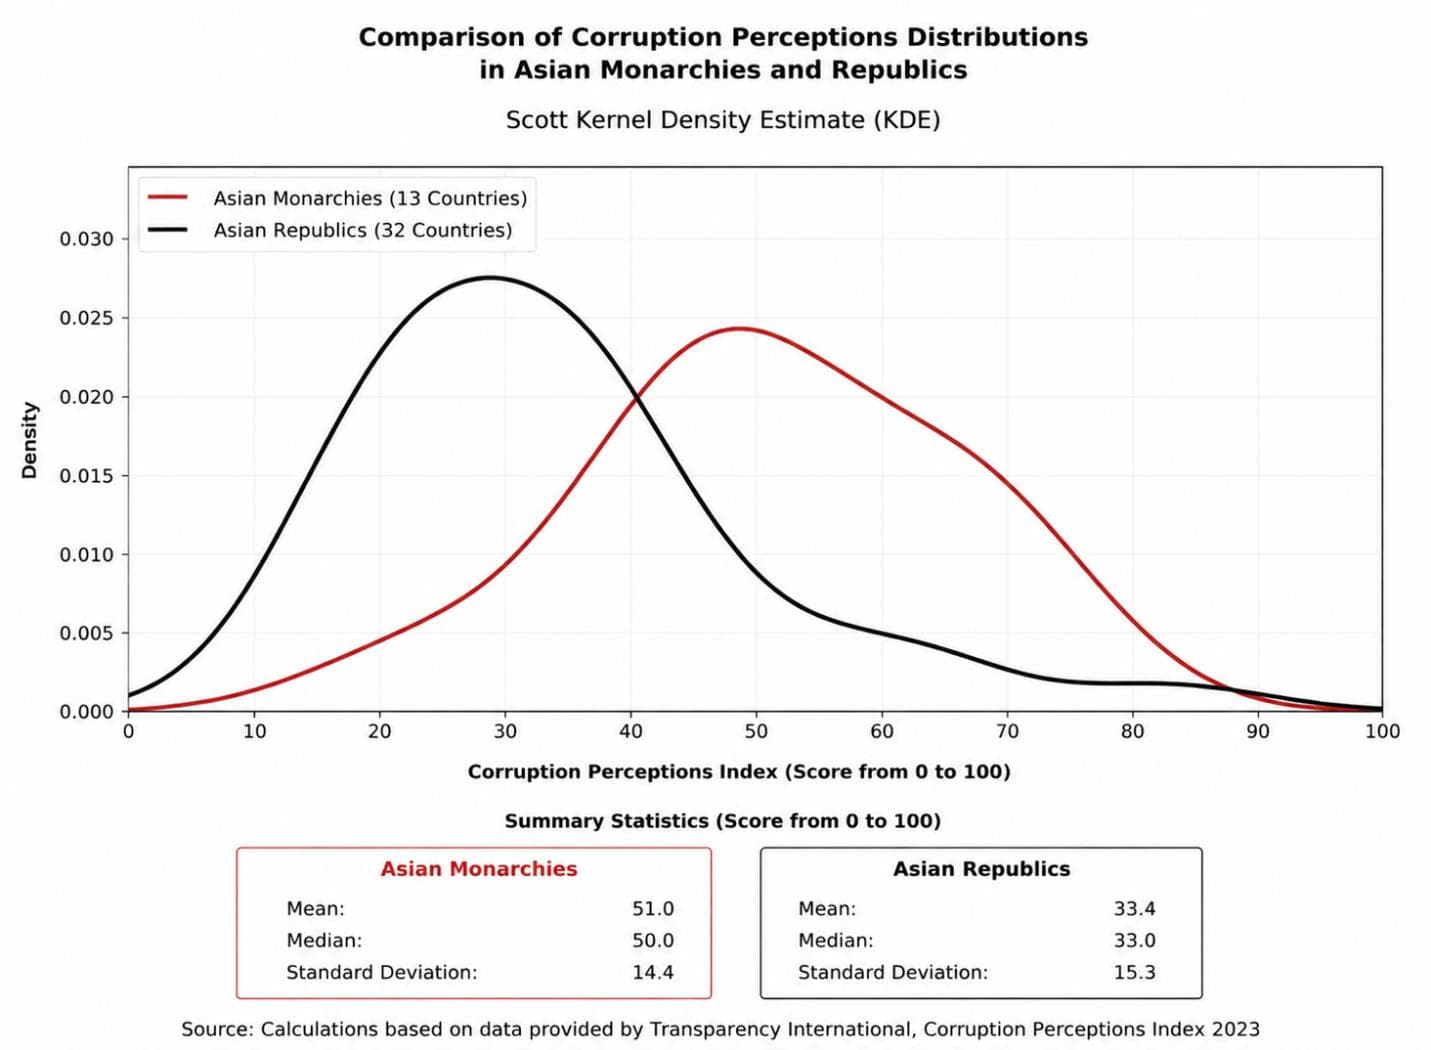
The kernel density estimate (KDE) shows that the distribution of Asian monarchies on the Corruption Perceptions Index is generally shifted toward higher scores, with the greatest concentration in the middle-to-upper range of the index. In contrast, Asian republics are concentrated mainly at lower scores and also exhibit greater dispersion, indicating greater heterogeneity in their performance on perceived corruption. The separation between the two curves indicates that, on average, Asian monarchies perform more favorably on the Corruption Perceptions Index than Asian republics.
Comparison of the Corruption Perceptions Index Between Monarchies and Republics in Europe
Descriptive Statistics
Form of Government |
Number of Countries |
Mean |
Median |
Standard Deviation |
European Monarchies |
8 |
77.13 |
78.50 |
9.17 |
European Republics |
32 |
54.25 |
53.50 |
15.80 |
The mean Corruption Perceptions Index score is 77.13 for European monarchies and 54.25 for European republics. Thus, European monarchies score, on average, 22.88 points higher than European republics.
The median confirms the same pattern. The median is 78.50 for monarchies and 53.50 for republics, meaning that the median country among European monarchies scores 25 points higher than the median country among European republics. This indicates that the advantage of monarchies is not limited to a few exceptional countries but is also evident across the overall distribution of the data.
The standard deviation is also considerably lower among European monarchies (9.17) than among European republics (15.80). This suggests that European monarchies not only have lower levels of perceived corruption but also exhibit more consistent performance.
Test of the Difference in Means
To assess the statistical significance of the difference in means, Welch’s t-test was used.
Statistical Measure |
Value |
Mean difference (Monarchies minus Republics) |
22.88 |
Welch’s t-statistic |
5.35 |
Approximate degrees of freedom |
18.89 |
Two-tailed p-value |
0.000038 |
95% confidence interval |
13.91 to 31.84 |
Hedges’ g |
1.51 |
Welch’s test indicates that the difference in mean Corruption Perceptions Index scores between European monarchies and republics is highly statistically significant (p < 0.001). The 95% confidence interval also lies entirely above zero, confirming the higher scores of the monarchies.
Hedges’ g is 1.51, indicating a very large effect. Thus, the observed difference is not only statistically significant but also substantial in practical terms.
Mann–Whitney Test
To ensure that the result does not depend on the assumptions of the parametric test, the nonparametric Mann–Whitney U test was also conducted.
Statistical Measure |
Value |
U statistic |
226.5 |
Two-tailed p-value |
0.00091 |
Rank-biserial correlation |
0.77 |
The Mann–Whitney test also confirms a highly statistically significant difference between the two groups (p < 0.001). The rank-biserial correlation of 0.77 indicates a very large effect, showing that Corruption Perceptions Index scores are generally substantially higher among European monarchies than among European republics.
Conclusion
In 2023, European monarchies performed substantially better than European republics on the Corruption Perceptions Index. Both the mean and median scores were considerably higher among monarchies, and both Welch’s t-test and the Mann–Whitney test confirmed the difference with very strong statistical evidence. Moreover, the very large effect sizes in both tests indicate that the difference is not only statistically significant but also substantial in practical terms.
The lower standard deviation among European monarchies also indicates that these countries have achieved lower levels of perceived corruption with greater consistency. Overall, the European data show that monarchies performed better than republics on the Corruption Perceptions Index.
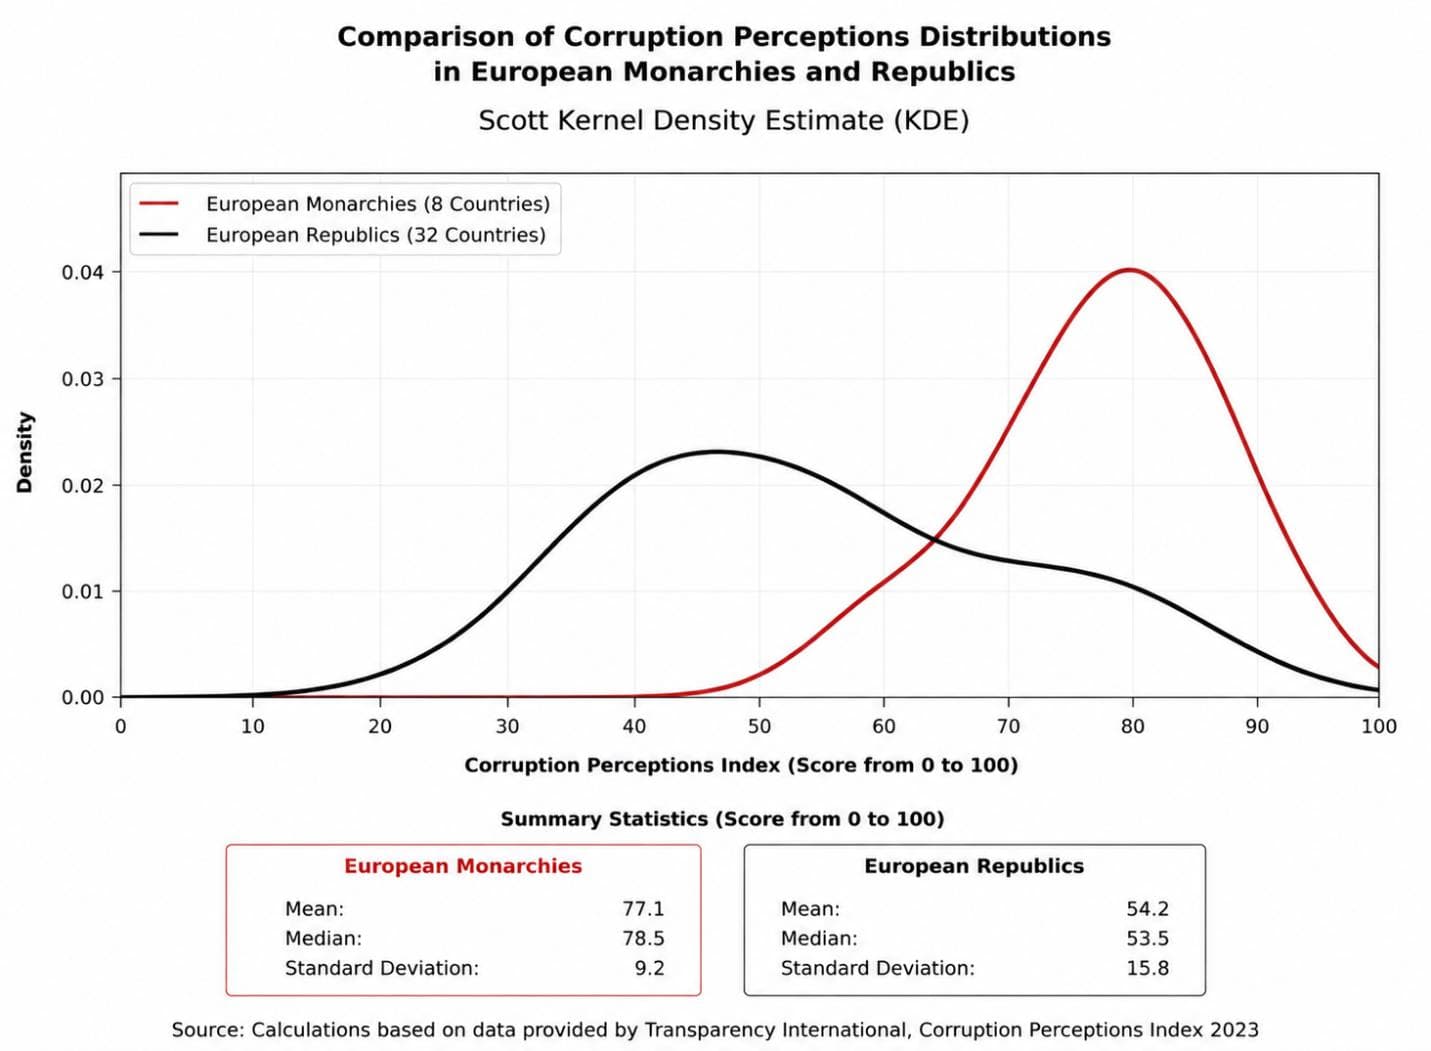
The kernel density estimate (KDE) shows that the distribution of European monarchies on the Corruption Perceptions Index is noticeably shifted toward higher scores, with most of these countries concentrated at favorable levels of the index. In contrast, although European republics include several countries with very strong performance, their scores are much more widely dispersed, with a substantial share concentrated at moderate and lower levels. This pattern indicates that, on average, European monarchies have both more favorable and more homogeneous outcomes on the Corruption Perceptions Index than European republics.
Comparison of the Corruption Perceptions Index Between European Monarchies and European Republics That Have Never Been Communist
Descriptive Statistics
Form of Government |
Number of Countries |
Mean |
Median |
Standard Deviation |
European Monarchies |
8 |
77.13 |
78.50 |
9.17 |
Non-Communist European Republics |
11 |
68.82 |
71.00 |
12.42 |
The mean Corruption Perceptions Index score is 77.13 for European monarchies and 68.82 for European republics that have never been communist. Thus, European monarchies score, on average, 8.31 points higher on this index.
The median points in the same direction. The median is 78.50 for monarchies and 71.00 for non-communist republics, meaning that the median country among European monarchies scores 7.5 points higher than the median country among non-communist European republics.
The standard deviation is also lower among monarchies (9.17) than among non-communist republics (12.42), indicating that European monarchies combine higher scores with greater consistency in their performance.
Test of the Difference in Means
To assess the statistical significance of the difference in means, Welch’s t-test was used.
Statistical Measure |
Value |
Mean difference (Monarchies minus Republics) |
8.31 |
Welch’s t-statistic |
1.68 |
Approximate degrees of freedom |
16.98 |
Two-tailed p-value |
0.112 |
Welch’s test indicates that the difference in mean Corruption Perceptions Index scores between the two groups is not statistically significant (p = 0.112). Given the available sample sizes, there is therefore insufficient evidence to draw a firm conclusion about a systematic difference between the two groups.
Mann–Whitney Test
The nonparametric Mann–Whitney U test was also conducted to compare the distributions of the two groups.
Statistical Measure |
Value |
U statistic |
63 |
Two-tailed p-value |
0.126 |
The Mann–Whitney test leads to the same conclusion, with the difference between the two groups not reaching statistical significance (p = 0.126).
Conclusion
Once European republics with a history of communist rule are excluded, the gap between monarchies and republics on the Corruption Perceptions Index narrows considerably. Although European monarchies still perform better in terms of both the mean and the median, this advantage does not reach statistical significance in either Welch’s test or the Mann–Whitney test.
Nevertheless, this result remains noteworthy in the context of the book’s central hypothesis. The republics included in this comparison are countries with long histories of democracy, competitive elections, and freedom of the press—factors commonly regarded in the political science literature as among the most important mechanisms for constraining corruption. These countries would therefore be expected to perform very strongly on the Corruption Perceptions Index. The data in this study confirm that these republics do indeed perform at a high level. At the same time, European monarchies still achieve higher mean and median scores, although the difference is not statistically significant given the available sample sizes. As in other sections of the book, this finding represents an observational relationship and does not, by itself, establish a causal relationship between the form of government and the level of corruption.
Comparison of the Corruption Perceptions Index in Monarchies and Republics in Africa, the Americas, and Oceania
Continent and Form of Government |
Number of Countries |
Mean |
Median |
Sample Standard Deviation |
Africa — Monarchies |
3 |
35.67 |
38.00 |
4.93 |
Africa — Republics |
49 |
32.94 |
31.00 |
12.75 |
Americas — Commonwealth Realms |
5 |
58.20 |
58.00 |
11.71 |
Americas — Republics |
26 |
39.00 |
35.50 |
16.57 |
Oceania — Commonwealth Realms |
4 |
58.00 |
59.00 |
26.36 |
Oceania — Republics |
2 |
50.00 |
50.00 |
2.83 |
No data are available for Tonga in the dataset used for this indicator. Therefore, no independent monarchy remains for comparison in Oceania, and the analysis is limited to Commonwealth realms and republics for which data are available.
As with the preceding indicators, the limited number of monarchies and Commonwealth realms in Africa, the Americas, and Oceania makes inferential statistical testing of limited value. The results in these three regions are therefore reported at the descriptive level only. On the Corruption Perceptions Index, a higher score indicates a more favorable outcome and a lower level of perceived corruption.
Africa
The three monarchies with available data—Lesotho, Morocco, and Eswatini—have a mean score of 35.67, compared with 32.94 among the continent’s 49 republics. The median is also higher among monarchies, at 38, compared with 31 among republics. Both measures of central tendency therefore point in the direction of better performance among the monarchies, although the difference in means is relatively modest.
There is also a notable difference in dispersion. The standard deviation is 4.93 among the monarchies and 12.75 among the republics. Thus, in addition to having higher mean and median scores, the three African monarchies have scores that are more closely clustered together. Given the very small number of monarchies, however, this pattern cannot support broad statistical conclusions.
The Americas
Because there are no independent monarchies in the Americas, the comparison is between Commonwealth realms and republics. The five Commonwealth realms with available data have a mean score of 58.20, compared with 39.00 among the continent’s 26 republics. The 19.20-point difference between the two groups is substantial on the scale of the Corruption Perceptions Index.
The medians point in the same direction. The median among Commonwealth realms is 58, compared with 35.50 among republics. Thus, the observed difference is not merely the result of one or two exceptionally high-scoring countries; a clear gap is also visible in the center of the two distributions. The standard deviation is 11.71 among the Commonwealth realms and 16.57 among the republics.
The descriptive data for the Americas therefore present a relatively clear pattern: Commonwealth realms have substantially higher mean and median Corruption Perceptions Index scores than the republics of the continent.
Oceania
The available data are much more limited in Oceania. Tonga, the region’s only independent monarchy, has no observation in the source used for this indicator. The comparison is therefore restricted to four Commonwealth realms and two republics with available data.
The mean score is 58 among the Commonwealth realms and 50 among the republics. The respective medians are 59 and 50. Thus, the direction of the difference again favors the Commonwealth realms.
This result, however, must be interpreted with particular caution. Only two republics have data in this comparison, while the four Commonwealth realms display substantial dispersion, with a standard deviation of 26.36. Oceania therefore provides a very limited descriptive comparison rather than a basis for meaningful statistical inference.
Overall, the descriptive statistics point in the same direction in all three comparisons that can be made: African monarchies have higher mean and median Corruption Perceptions Index scores than African republics; Commonwealth realms in the Americas have higher scores than the republics of the Americas; and Commonwealth realms in Oceania have higher scores than the republics with available data in that region. Nevertheless, particularly in Africa and Oceania, the small size of the comparison groups means that these findings should be treated strictly as descriptive evidence rather than as independent statistical tests of the superiority of one form of government.
Comparison of the Corruption Perceptions Index Between Monarchies and Republics in the Middle East
Descriptive Statistics
Form of Government |
Number of Countries |
Mean |
Median |
Standard Deviation |
Middle Eastern Monarchies |
7 |
50.71 |
46.00 |
8.73 |
Middle Eastern Republics |
9 |
31.56 |
24.00 |
15.56 |
The mean Corruption Perceptions Index score is 50.71 for Middle Eastern monarchies and 31.56 for Middle Eastern republics. Thus, monarchies in the region score, on average, 19.16 points higher than republics.
The median confirms the same pattern. The median is 46 for monarchies and 24 for republics, meaning that the median country among Middle Eastern monarchies scores 22 points higher than the median country among Middle Eastern republics. This indicates that the advantage of monarchies is not confined to one or two particular countries but is also evident across the overall distribution of the data.
The standard deviation is also considerably lower among monarchies (8.73) than among republics (15.56), indicating greater consistency in the performance of the region’s monarchies on this index.
Test of the Difference in Means
To assess the statistical significance of the difference in means, Welch’s t-test was used.
Statistical Measure |
Value |
Mean difference (Monarchies minus Republics) |
19.16 |
Welch’s t-statistic |
2.923 |
Approximate degrees of freedom |
13.06 |
Two-tailed p-value |
0.0118 |
Hedges’ g |
1.30 |
Welch’s test indicates that the difference in mean Corruption Perceptions Index scores between Middle Eastern monarchies and republics is statistically significant (p = 0.0118). Hedges’ g is 1.30, indicating a large effect. Thus, the observed difference is not only statistically significant but also substantial in practical terms.
Mann–Whitney Test
To ensure that the result does not depend on the assumptions of the parametric test, the nonparametric Mann–Whitney U test was also conducted.
Statistical Measure |
Value |
U statistic |
52 |
Two-tailed p-value |
0.0340 |
Rank-biserial correlation |
0.65 |
The Mann–Whitney test also indicates a statistically significant difference between the two groups (p = 0.0340). The rank-biserial correlation of 0.65 likewise indicates a large effect, showing a clear overall advantage for Middle Eastern monarchies on this index.
Conclusion
In 2023, Middle Eastern monarchies performed better than the region’s republics on the Corruption Perceptions Index. Both the mean and median scores were substantially higher among monarchies, and both Welch’s t-test and the Mann–Whitney test confirmed that the difference was statistically significant. The large effect sizes also indicate that the difference is substantial in practical terms.
Moreover, the lower dispersion of scores among Middle Eastern monarchies indicates that their stronger performance is not confined to one or two countries but is more consistent across the group. Overall, the data in this study show that Middle Eastern monarchies had lower levels of perceived public-sector corruption than the region’s republics. As in other sections of the book, this finding represents an observational relationship and does not, by itself, establish a causal relationship between the form of government and the level of corruption.
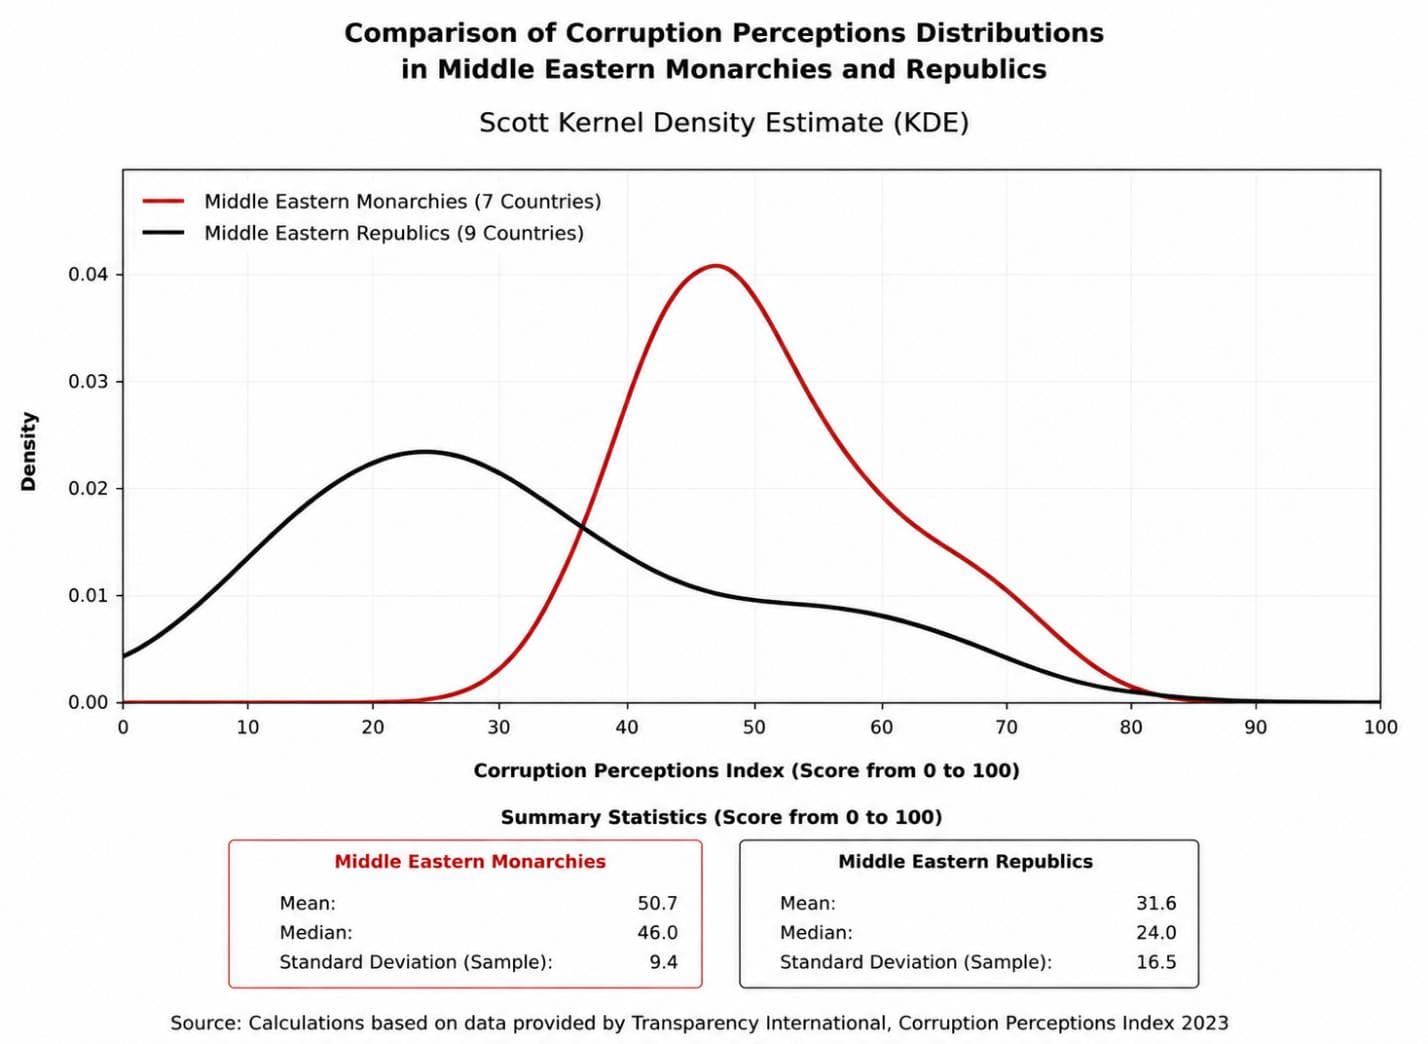
The kernel density estimate shows that the distribution of Middle Eastern monarchies on the Corruption Perceptions Index is noticeably shifted toward higher scores, with the greatest concentration in the middle-to-upper range of the index. By contrast, Middle Eastern republics are concentrated mainly at lower scores and display greater dispersion, indicating more heterogeneous performance in terms of perceived corruption. The separation between the two curves suggests that, on average, the region’s monarchies are in a more favorable position than its republics.
Status of the “New or Modern Monarchy” Hypothesis after the Tenth Indicator
With the addition of the Corruption Perceptions Index, the status of the hypothesis is updated as follows:
Test
Indicator
Result
✓
GDP per Capita
Consistent with the hypothesis
✓
Purchasing Power per Capita
Consistent with the hypothesis
◐
Gini Coefficient
Mixed evidence; difference favors the hypothesis
✓
Political Stability and Absence of Violence
Consistent with the hypothesis
✓
Regulatory Quality
Consistent with the hypothesis
✓
Rule of Law
Consistent with the hypothesis
✓
Government Effectiveness
Consistent with the hypothesis
✓
Inflation
Consistent with the hypothesis
✓
Control of Corruption
Consistent with the hypothesis
✓
Corruption Perceptions Index
Consistent with the hypothesis
At this stage, the “New or Modern Monarchy” hypothesis has been evaluated using ten independent indicators, and the results for all ten have been in the direction predicted by the hypothesis. For the Corruption Perceptions Index as well, monarchies generally received higher scores than republics in both global and regional comparisons, particularly in Asia, Europe, and the Middle East. At the global level, the difference between monarchies and republics was both statistically significant and characterized by a large effect size.
This result does not constitute definitive proof of the hypothesis, nor does it establish a causal relationship between monarchy and lower levels of corruption. A more precise formulation is that the empirical evidence gathered thus far is consistent with the predictions of the hypothesis, and none of the ten indicators examined has produced a result in the opposite direction.