

Monarchy & Republic in the Laboratory of History by N. Fakhr - HTML preview
Download the book in PDF, ePub for a complete version.
Comparison of the “Regulatory Quality” Indicator between Monarchies and Republics across Continents and the Middle East
Comparison of the “Regulatory Quality” Indicator between Monarchies and Republics in Asia
1. Descriptive Statistics
Group |
Number of Countries (n) |
Mean |
Median |
Sample SD |
Asian Monarchies |
13 |
67.80 |
68.90 |
17.46 |
Asian Republics |
33 |
35.70 |
33.00 |
26.11 |
Interpretation of Descriptive Statistics
The mean Regulatory Quality score is 67.80 for Asian monarchies and 35.70 for Asian republics. The median is 68.90 for monarchies and 33.00 for republics.
Thus, based on the available data, Asian monarchies not only have a higher mean, but the central value of their distribution is also substantially higher. The fact that the mean and median point in the same direction indicates that the observed difference is not merely driven by a few countries with exceptionally high values, but is also evident in the central part of the distribution.
The sample standard deviation is also lower among monarchies (17.46) than among republics (26.11), indicating greater dispersion in Regulatory Quality scores among Asian republics.
2. Welch’s t-test for the Difference in Means
The hypotheses were defined as follows:
Null hypothesis (H₀): The mean Regulatory Quality score is equal for Asian monarchies and republics.
Alternative hypothesis (H₁): The mean Regulatory Quality score differs between the two groups.
Results of Welch’s t-test
Measure |
Value |
Mean — Monarchies |
67.80 |
Mean — Republics |
35.70 |
Difference in Means |
32.10 |
t-statistic |
4.833 |
Approximate Degrees of Freedom |
32.89 |
Two-tailed p-value |
0.00003 |
Interpretation of Welch’s t-test
The probability value (p = 0.00003) is far below the conventional 5 percent significance level. The null hypothesis is therefore rejected.
The result indicates that the difference in mean Regulatory Quality scores between Asian monarchies and republics is statistically significant. The mean percentile rank of Asian monarchies on this indicator is approximately 32.10 points higher than that of Asian republics.
3. Mann–Whitney U Test
To examine the difference between the two groups from another perspective and without relying on the assumption of normally distributed data, the nonparametric Mann–Whitney U test was also conducted.
Results of the Mann–Whitney U Test
Measure |
Value |
U-statistic |
359 |
Two-tailed p-value |
0.00044 |
Interpretation of the Mann–Whitney U Test
The probability value (p = 0.00044) is below the 5 percent significance level. The null hypothesis is therefore rejected.
This test likewise indicates a statistically significant rank-based difference in Regulatory Quality scores between Asian monarchies and republics. Given the substantially higher mean and median among monarchies, the direction of the observed difference is toward higher indicator values in the monarchy group.
The consistency of the Welch and Mann–Whitney results is important. Welch’s test identifies a statistically significant difference in means, while the Mann–Whitney test also provides significant evidence of a rank-based difference between the two groups. The observed result is therefore not dependent on the choice of a single statistical method.
Summary
Group |
Mean Regulatory Quality Score |
Asian Monarchies |
67.80 |
Asian Republics |
35.70 |
Both statistical tests confirm a significant difference between the two groups:
Test |
Result |
Welch’s t-test |
p = 0.00003 → Significant |
Mann–Whitney U |
p = 0.00044 → Significant |
Conclusion
Among Asian countries with available data, monarchies have, on average, higher percentile ranks on the Regulatory Quality indicator than republics, and the difference between the two groups is statistically significant in both tests.
Overall, the within-continent comparison for Asia is consistent with the pattern observed in the global comparison. On average, the monarchies of Asia rank higher on the Regulatory Quality indicator, while their scores also show less dispersion than those of Asian republics. Based on the 2023 data, Asian monarchies have a clearly better record on this indicator—which reflects perceptions of governments’ ability to formulate and implement policies and regulations that support and promote private-sector activity and development—than the republics of the continent.
However, this finding is based on an observational comparison and does not, by itself, establish a causal relationship between the form of government and regulatory quality. Historical, economic, and institutional factors, as well as differences in levels of development, may also contribute to the observed difference between the two groups.
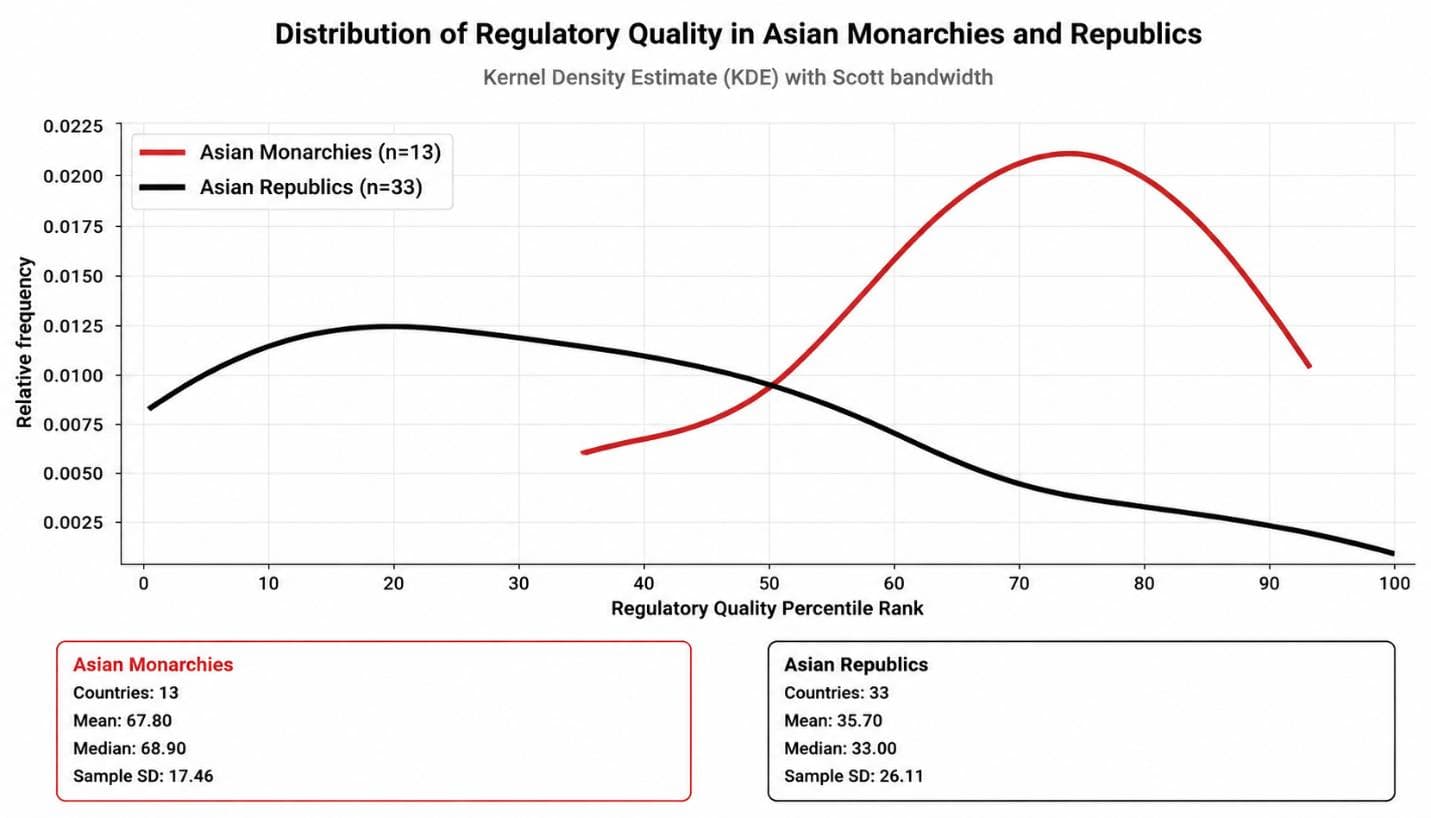
The distribution of the Regulatory Quality indicator across Asian countries shows that the curve for monarchies is shifted toward higher values relative to that for republics. Since higher values on this indicator represent a more favorable position in terms of regulatory quality, this pattern indicates that, on average, Asian monarchies performed better on this indicator in the dataset examined.
The mean Regulatory Quality score is 67.80 for Asian monarchies and 35.70 for Asian republics. The corresponding medians are 68.90 and 33.00, respectively. The fact that both the mean and median point in the same direction indicates that the observed difference is not merely driven by a few countries with exceptionally high values, but is also evident in the central part of the distributions.
Although the two curves overlap to some extent, indicating within-group variation in both categories, the distribution of monarchies is more concentrated at higher values of the indicator, whereas that of republics is more concentrated at lower values. The greater dispersion among republics is also consistent with their higher sample standard deviation (26.11, compared with 17.46 for monarchies).
The statistical tests presented below determine whether this observed difference is also statistically significant.
Comparison of the “Regulatory Quality” Indicator Between Monarchies and Republics in Europe
1. Descriptive Statistics
Group |
Number of Countries (n) |
Mean |
Median |
Sample SD |
European Monarchies |
11 |
91.80 |
93.40 |
7.00 |
European Republics |
34 |
70.07 |
73.35 |
21.38 |
Interpretation of the Descriptive Statistics
The mean Regulatory Quality percentile rank is 91.80 for European monarchies and 70.07 for European republics.
The medians show the same pattern:
- Monarchies: 93.40
- Republics: 73.35
These figures indicate that European monarchies not only have a higher mean, but the center of their distribution is also located at a substantially higher level. In addition, the much lower standard deviation among monarchies indicates that the countries in this group are clustered more closely around similarly high levels of regulatory quality, whereas European republics display considerably greater variation.
2. Welch’s t-test for the Difference in Means
The hypotheses were defined as follows:
Null hypothesis (H₀): The mean Regulatory Quality percentile rank is equal in European monarchies and republics.
Alternative hypothesis (H₁): The mean Regulatory Quality percentile rank differs between the two groups.
Results of Welch’s t-test
Statistic |
Value |
Mean — Monarchies |
91.80 |
Mean — Republics |
70.07 |
Difference in Means |
21.73 |
t-statistic |
5.137 |
Approximate Degrees of Freedom |
42.94 |
Two-sided p-value |
0.0000065 |
Interpretation of Welch’s t-test
The p-value (p ≈ 0.0000065) is far below the conventional 5% significance level. The null hypothesis is therefore rejected.
The result indicates that the difference in mean Regulatory Quality percentile rank between European monarchies and republics is statistically significant. In this dataset, European monarchies have an average percentile rank approximately 21.73 points higher than European republics.
3. Mann–Whitney U Test
To examine the difference between the two groups from a nonparametric perspective, the Mann–Whitney U test was also conducted. This test is based on the ranks of the observations and does not require the assumption of normally distributed data.
Results of the Mann–Whitney U Test
Statistic |
Value |
U-statistic |
324 |
Two-sided p-value |
0.000312 |
Interpretation of the Mann–Whitney U Test
The p-value (p ≈ 0.000312) is well below the 5% significance level. The null hypothesis is therefore rejected.
This test also provides strong evidence that the Regulatory Quality values of European monarchies and republics differ significantly in rank. Given that both the mean and median are substantially higher among monarchies, the direction of the observed difference is toward higher Regulatory Quality percentile ranks among European monarchies.
The consistency of the two tests is important. Welch’s t-test identifies a statistically significant difference in means, while the Mann–Whitney U test provides significant evidence of a difference in the rank distributions. Thus, the finding is not dependent on a single statistical method.
Summary
Group |
Mean Regulatory Quality Percentile Rank |
European Monarchies |
91.80 |
European Republics |
70.07 |
The results of both statistical tests are significant:
Test |
Result |
Welch’s t-test |
p = 0.0000065 → Significant |
Mann–Whitney U |
p = 0.000312 → Significant |
Conclusion
Among European countries with available data, monarchies have, on average, substantially higher Regulatory Quality percentile ranks than republics. Both statistical tests provide strong evidence of a difference between the two groups. The higher median and markedly lower dispersion among monarchies further indicate that their higher performance is not driven merely by a small number of exceptionally high-scoring countries, but is reflected more broadly across the group.
As with the other comparisons in this study, however, this is an observational comparison. The results describe the empirical record of the two groups and, by themselves, do not establish a causal relationship between the form of government and regulatory quality.
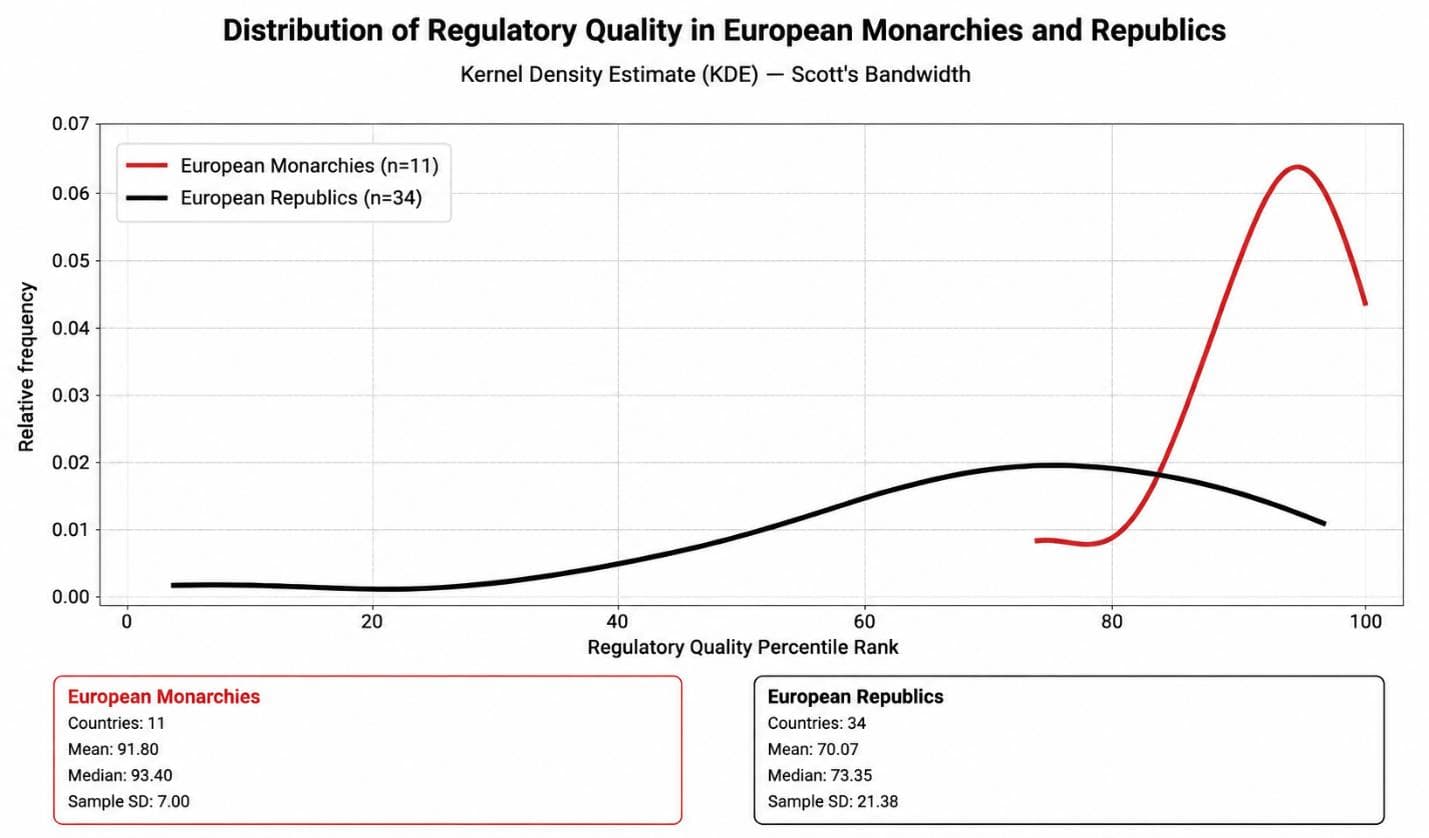
The distribution of the Regulatory Quality indicator across European countries shows that the curve for monarchies is noticeably shifted toward higher percentile ranks. Since higher values on this indicator represent better regulatory quality and a greater perceived ability of governments to formulate and implement policies and regulations that support private-sector development, this pattern indicates that European monarchies in this dataset tend to occupy substantially higher levels of regulatory quality.
The mean Regulatory Quality percentile rank is 91.80 for European monarchies and 70.07 for European republics. The corresponding medians are 93.40 and 73.35, respectively. This difference indicates that the higher performance observed among monarchies is not driven merely by a few exceptionally high-performing countries, but is also evident at the center of the distribution.
The greater concentration of the monarchy curve at the upper end of the indicator, together with its lower dispersion, also suggests that countries in this group display a relatively more consistent pattern of regulatory quality. By contrast, the curve for republics spans a much wider range of values, indicating greater variation in performance among countries in this group.
The statistical tests presented below determine whether this observed difference is also statistically significant.
Comparison of the “Regulatory Quality” Indicator Between European Monarchies and European Republics That Have Never Been Communist
One question is whether the observed advantage of European monarchies is simply due to the inclusion, among the republics, of Eastern European countries with a history of communist rule. To examine this possibility, an additional comparison was conducted in which European monarchies were compared only with European republics that have never experienced communist rule. This substantially reduces the potential influence of the institutional legacy of communist systems on the comparison.
This analysis includes 11 monarchies and 13 non-communist European republics. The results show that the mean Regulatory Quality percentile rank is 91.80 for European monarchies, compared with 83.97 for non-communist European republics. European monarchies therefore score, on average, approximately 7.83 percentile-rank points higher than this group of republics.
The medians show the same pattern. The median is 93.40 among European monarchies and 85.40 among non-communist republics. Although the gap between the two groups is smaller than in the previous comparison with all European republics, monarchies still occupy the higher position.
European monarchies also display less dispersion. Their sample standard deviation is 7.00, compared with 9.69 for non-communist European republics. This indicates that Regulatory Quality scores among European monarchies are not only higher on average but also more tightly clustered.
Welch’s t-test indicates that the difference in means is statistically significant at the 5% level (t = 2.29, df = 21.53, p = 0.032). Thus, even after excluding republics with a history of communist rule, the data continue to provide statistical evidence that European monarchies have a higher mean Regulatory Quality percentile rank than non-communist European republics.
This comparison reveals an important point. In the previous analysis, one might have suspected that the lower average among European republics was largely attributable to the inclusion of Eastern European countries with a communist legacy. Once these countries are excluded, the gap becomes smaller, but does not disappear entirely. In other words, removing republics with a communist past reduces part of the previously observed difference, yet European monarchies continue to outperform European republics without a history of communist rule on the Regulatory Quality indicator.
This supplementary analysis therefore suggests that the observed advantage of European monarchies cannot be attributed solely to the legacy of communist rule among some European republics. Even when compared with republics that have never experienced communist rule, European monarchies still recorded higher Regulatory Quality percentile ranks in the 2023 data. As emphasized throughout this study, however, this remains an observational comparison and by itself is insufficient to establish a causal relationship between form of government and regulatory quality.
This restricted comparison should not, however, replace the main analysis. From a methodological perspective, excluding European republics with a history of communist rule from the overall comparison is not justified, because these countries constitute a genuine part of the historical experience of republics in Europe. Excluding them could introduce a form of selection bias by removing unfavorable cases from the record of republics. Within the analytical framework of this book, the historical tendency of some republics toward communism, the establishment of one-party rule, and the institutional legacies left by those systems are not treated simply as external factors wholly independent of the form of government; rather, they are considered part of the historical trajectories and potential outcomes of the republican experience itself. Therefore, republics with a history of communist rule should remain included in the primary comparison.
Comparison of the “Regulatory Quality” Indicator Between Monarchies and Republics in Africa, the Americas, and Oceania
Africa
In Africa, three monarchies were compared with 50 republics. The results show that the mean Regulatory Quality percentile rank is 34.90 for African monarchies and 27.94 for African republics. The corresponding medians are 29.70 and 24.75, respectively.
Group |
Number of Countries |
Mean |
Median |
Sample SD |
African Monarchies |
3 |
34.90 |
29.70 |
14.25 |
African Republics |
50 |
27.94 |
24.75 |
18.32 |
In Africa as well, monarchies have a higher mean than republics, although the difference between the two groups is considerably smaller than in Asia and Europe. Moreover, because there are only three monarchies on the continent, the results of this comparison should be interpreted with greater caution.
The Americas
In the Americas, where there are no independent monarchies, nine Commonwealth realms were compared with 26 republics. The mean Regulatory Quality percentile rank is 62.73 for the Commonwealth realms and 43.35 for the republics of the Americas. The corresponding medians are 62.30 and 43.85, respectively, reinforcing the overall descriptive advantage of the Commonwealth realms.
Group |
Number of Countries |
Mean |
Median |
Sample SD |
Commonwealth Realms |
9 |
62.73 |
62.30 |
15.11 |
Republics of the Americas |
26 |
43.35 |
43.85 |
23.04 |
Thus, in the Americas as well, the Commonwealth realms have, on average, higher Regulatory Quality percentile ranks than the republics of the region.
Oceania
Oceania has only one independent monarchy (Tonga). Therefore, in addition to reporting its score, five Commonwealth realms were compared with the nine republics of the region. The mean Regulatory Quality percentile rank is 58.48 for the Commonwealth realms and 44.71 for the republics. The corresponding medians are 44.80 and 42.90, respectively.
Group |
Number of Countries |
Mean |
Median |
Sample SD |
Independent Monarchy |
1 |
37.30 |
37.30 |
— |
Commonwealth Realms |
5 |
58.48 |
44.80 |
33.98 |
Republics of Oceania |
9 |
44.71 |
42.90 |
9.98 |
Because there is only one independent monarchy in Oceania, a statistical comparison involving that group alone is not possible. Nevertheless, the comparison between the Commonwealth realms and the republics of Oceania shows the same descriptive direction observed in the other regions: the mean Regulatory Quality percentile rank is higher among the Commonwealth realms than among the republics.
Overall, the results for Africa, the Americas, and Oceania are consistent in direction with the global, Asian, and European comparisons. In all three regions, monarchies or Commonwealth realms have, on average, higher Regulatory Quality percentile ranks than republics. However, because of the small number of countries in some groups—particularly in Africa and Oceania—these regional results should be interpreted with greater caution.
Comparison of the “Regulatory Quality” Indicator Between Monarchies and Republics in the Middle East
Indicator |
Monarchies |
Republics |
Number of Countries |
7 |
10 |
Mean |
72.24 |
30.56 |
Median |
68.90 |
20.75 |
Sample SD |
9.97 |
30.29 |
The difference between the two groups is striking. The mean Regulatory Quality percentile rank in Middle Eastern monarchies is 41.68 points higher than in republics and is approximately 2.36 times as high. The median among monarchies is also more than three times that of republics.
Another notable feature is the substantial difference in dispersion between the two groups. The sample standard deviation is only 9.97 among monarchies, compared with 30.29 among republics. Thus, the monarchies of the region not only have a substantially higher mean percentile rank, but their scores are also much more tightly clustered and homogeneous.
Welch’s t-test
A two-sided Welch’s t-test produced the following result:
t = 4.049, df = 11.58, p = 0.00173
Thus, the difference in means between the two groups is highly statistically significant. The null hypothesis of equal means is rejected even at the 1% significance level.
The Hedges’ g effect size is:
g = 1.628
This represents a very large effect in favor of the monarchies.
Summary
To assess the statistical significance of the difference in means, Welch’s t-test was used. The test indicates a highly statistically significant difference between the two groups (t = 4.049, df = 11.58, p = 0.0017). The estimated effect size, Hedges’ g = 1.63, is very large.
Thus, in the Middle East, the observed association between form of government and Regulatory Quality is not merely a small difference in average scores. Monarchies rank substantially higher than republics on this indicator, the difference is highly statistically significant, and the effect size is very large. At the same time, the much lower dispersion of scores among monarchies indicates that their relatively high performance is also notably consistent across the countries in this group.
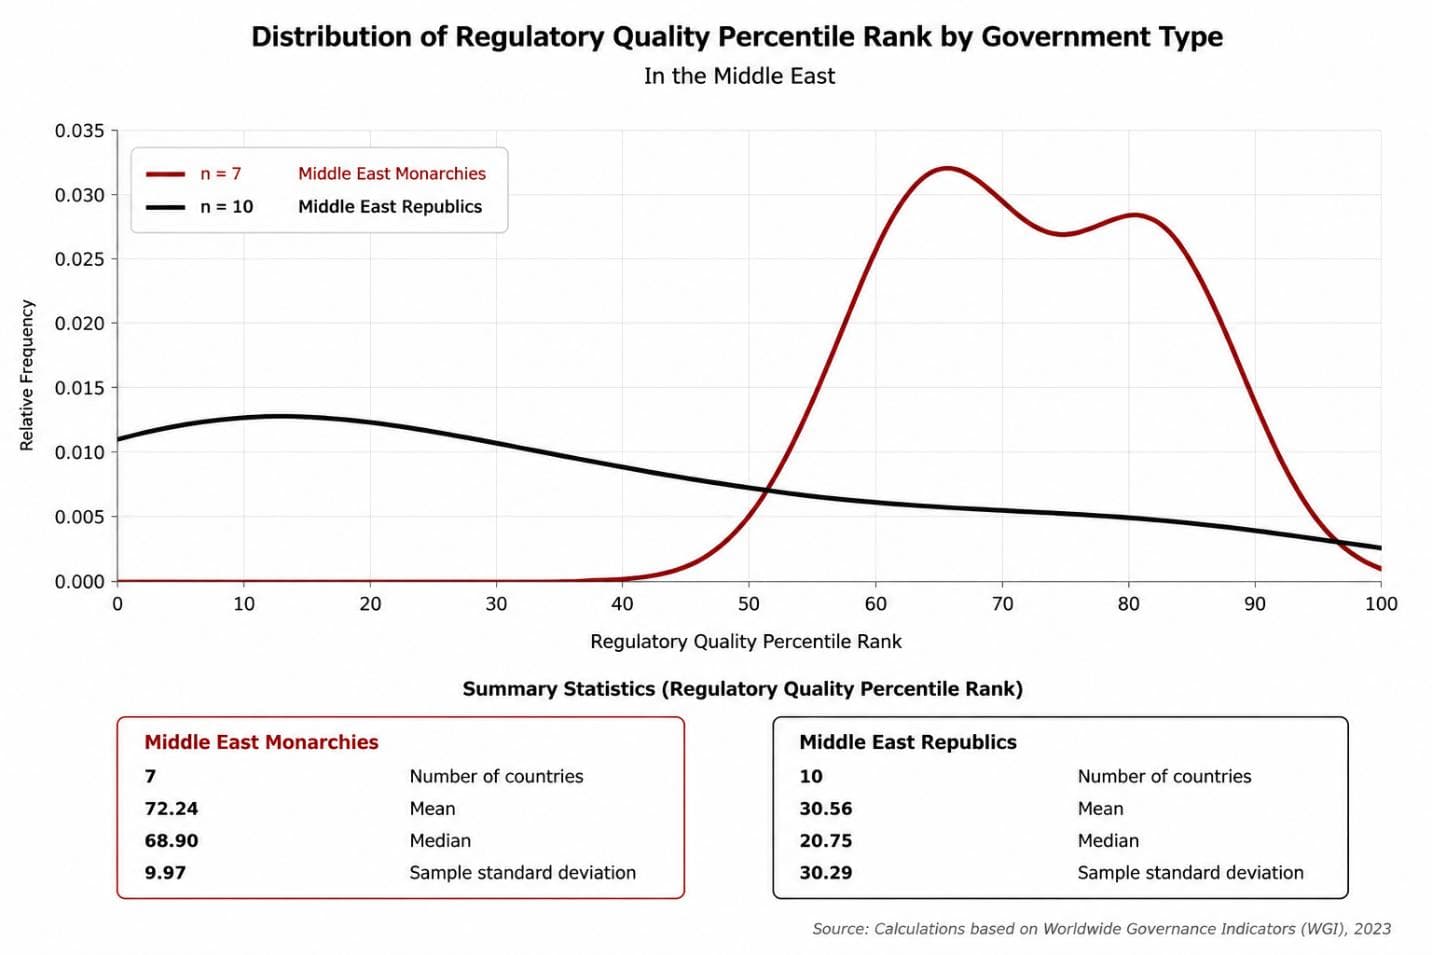
The distribution plot shows that the curve for Middle Eastern monarchies is shifted markedly to the right of that for republics. This shift indicates that, overall, the monarchies in the region achieved higher percentile ranks on the Regulatory Quality indicator. The greater concentration of the monarchy curve also suggests that performance among these countries is relatively more consistent, whereas the wider dispersion of the republic curve reflects substantial variation in regulatory quality across Middle Eastern republics.
Despite this variation, the overlap between the two curves is limited, with most of the distribution for monarchies concentrated at higher values than that of republics. This pattern is consistent with the statistical results presented in this section: the mean percentile rank for Middle Eastern monarchies (72.24) is substantially higher than that for the region’s republics (30.56). The distribution plot therefore visually reinforces the findings of the statistical tests: in the 2023 data, Middle Eastern monarchies, on average, performed substantially better than the region’s republics on the Regulatory Quality indicator.