

Monarchy & Republic in the Laboratory of History by N. Fakhr - HTML preview
Download the book in PDF, ePub for a complete version.
The Record on Order
We now turn to the third objective of government: maintaining order. One of the most important instruments available to governments for establishing and preserving order is the enactment and enforcement of laws and regulations. The mere existence of laws, however, does not in itself indicate that the resulting political and economic order is desirable. All governments establish regulations, but the orientation and quality of those regulations can vary considerably.
In some countries, laws and regulations are designed to facilitate economic activity, investment, competition, and private-sector development. In others, poorly designed regulations may contribute to greater monopoly power, rent-seeking, economic uncertainty, and preferential treatment for government-affiliated firms or groups with political influence. The central issue, therefore, is not simply whether a legal and regulatory order exists, but how effectively that order structures economic life and enables citizens and firms to engage in free and productive activity.
Nor does the concept of order, as understood by philosophers as one of the objectives of government, refer merely to preserving those in power or preventing disruption of the status quo. An order that can legitimately be regarded as an objective of government is one that makes social and economic relations predictable, clarifies rights and obligations, and provides the conditions for cooperation and constructive activity among citizens.
Regulatory Quality
As part of its Worldwide Governance Indicators, the World Bank publishes an indicator entitled “Regulatory Quality”. This indicator reflects perceptions of the government’s ability to formulate and implement sound policies and regulations that permit and promote private-sector development. Like the other Worldwide Governance Indicators, this measure draws on a combination of data from surveys of citizens and firms and assessments by experts. It should therefore not be interpreted as a direct assessment of the text of laws themselves or of the benefits received by each individual citizen.
For each country, the World Bank reports both an estimated governance score and a percentile rank. The interpretation of percentile ranks was explained in the preceding section. In this section, the percentile ranks of monarchies and republics on the Regulatory Quality indicator are compared.
The data used in this analysis are for 2023 (Appendix RDS-E01).
Comparison of the “Regulatory Quality” Indicator Between Monarchies and Republics Worldwide
1. Descriptive Statistics
Group |
Number of Countries (n) |
Mean |
Median |
Sample SD |
Monarchies |
28 |
72.61 |
80.90 |
23.10 |
Republics |
152 |
41.79 |
39.85 |
27.12 |
Interpretation of Descriptive Statistics
The mean Regulatory Quality score is 72.61 for monarchies and 41.79 for republics.
Because a higher value on this indicator represents better regulatory quality, the descriptive statistics show that, in this dataset, monarchies have substantially higher average scores than republics.
The medians point in the same direction:
- Monarchies: 80.90
- Republics: 39.85
Thus, the observed difference is not driven solely by a few countries with exceptionally high scores; it is also evident in the central tendency of the two distributions.
Despite the relatively substantial dispersion within both groups, descriptive statistics alone are insufficient to determine whether the observed difference is statistically significant. Inferential tests were therefore conducted.
2. Welch’s t-test for the Difference in Means
The hypotheses were defined as follows:
Null hypothesis (H₀): The mean Regulatory Quality score is equal in monarchies and republics.
Alternative hypothesis (H₁): The mean Regulatory Quality score differs between the two groups.
Results of Welch’s t-test
Statistic |
Value |
Mean — Monarchies |
72.61 |
Mean — Republics |
41.79 |
Difference in means |
30.82 |
t-statistic |
6.304 |
Approximate degrees of freedom |
41.96 |
Two-tailed p-value |
0.000000145 |
Interpretation of Welch’s t-test
The p-value (p ≈ 0.000000145) is far below the conventional 5 percent significance level. The null hypothesis is therefore rejected.
The result indicates that the difference in mean Regulatory Quality scores between monarchies and republics is highly statistically significant.
In this dataset, monarchies have, on average, substantially higher Regulatory Quality scores than republics.
Because the indicator is reported as a percentile rank, the 30.82-point difference should not be interpreted as meaning that monarchies have “30.82 percent better regulations.” Rather, it represents the difference between the average percentile-rank positions of the two groups on the Regulatory Quality indicator.
3. Mann–Whitney U Test
To examine the difference between the two groups from another perspective, the nonparametric Mann–Whitney U test was also conducted. This test is based on the ranking of observations and does not depend on an assumption of normally distributed data.
The hypotheses were:
Null hypothesis (H₀): The ranked distributions of Regulatory Quality scores do not differ significantly between the two groups.
Alternative hypothesis (H₁): The ranked distributions of Regulatory Quality scores differ between the two groups.
Results of the Mann–Whitney U Test
Statistic |
Value |
U statistic |
3,412 |
Two-tailed p-value |
0.000000407 |
Interpretation of the Mann–Whitney U Test
The p-value (p ≈ 0.000000407) is far below the 5 percent significance level. The null hypothesis is therefore rejected.
This test likewise indicates that Regulatory Quality scores differ significantly between monarchies and republics in terms of their ranked distributions. Given that both the mean and median are markedly higher among monarchies, the direction of the observed difference is toward higher Regulatory Quality scores in the monarchy group.
The agreement between the two tests is important. Welch’s t-test identifies a statistically significant difference in means, while the Mann–Whitney U test provides significant evidence of a difference in the ranked distributions. Thus, the finding is not dependent on the choice of a single statistical method.
Summary
For the 2023 Regulatory Quality data:
Group |
Mean Score |
Monarchies |
72.61 |
Republics |
41.79 |
Both inferential tests identify a statistically significant difference:
Test |
Result |
Welch’s t-test |
p = 0.000000145 → Significant |
Mann–Whitney U |
p = 0.000000407 → Significant |
Conclusion
Among countries with available data in 2023, monarchies had substantially higher average Regulatory Quality scores than republics. The difference is highly statistically significant under both Welch’s t-test and the Mann–Whitney U test, while the substantially higher median among monarchies indicates that the pattern is also evident in the central part of the distributions rather than being driven solely by a small number of exceptionally high-performing countries.
As with the preceding comparisons, however, these results establish an empirical association rather than a causal effect. They do not, by themselves, demonstrate that regime type directly causes differences in regulatory quality. Other historical, economic, institutional, and regional factors may also contribute to the observed pattern.
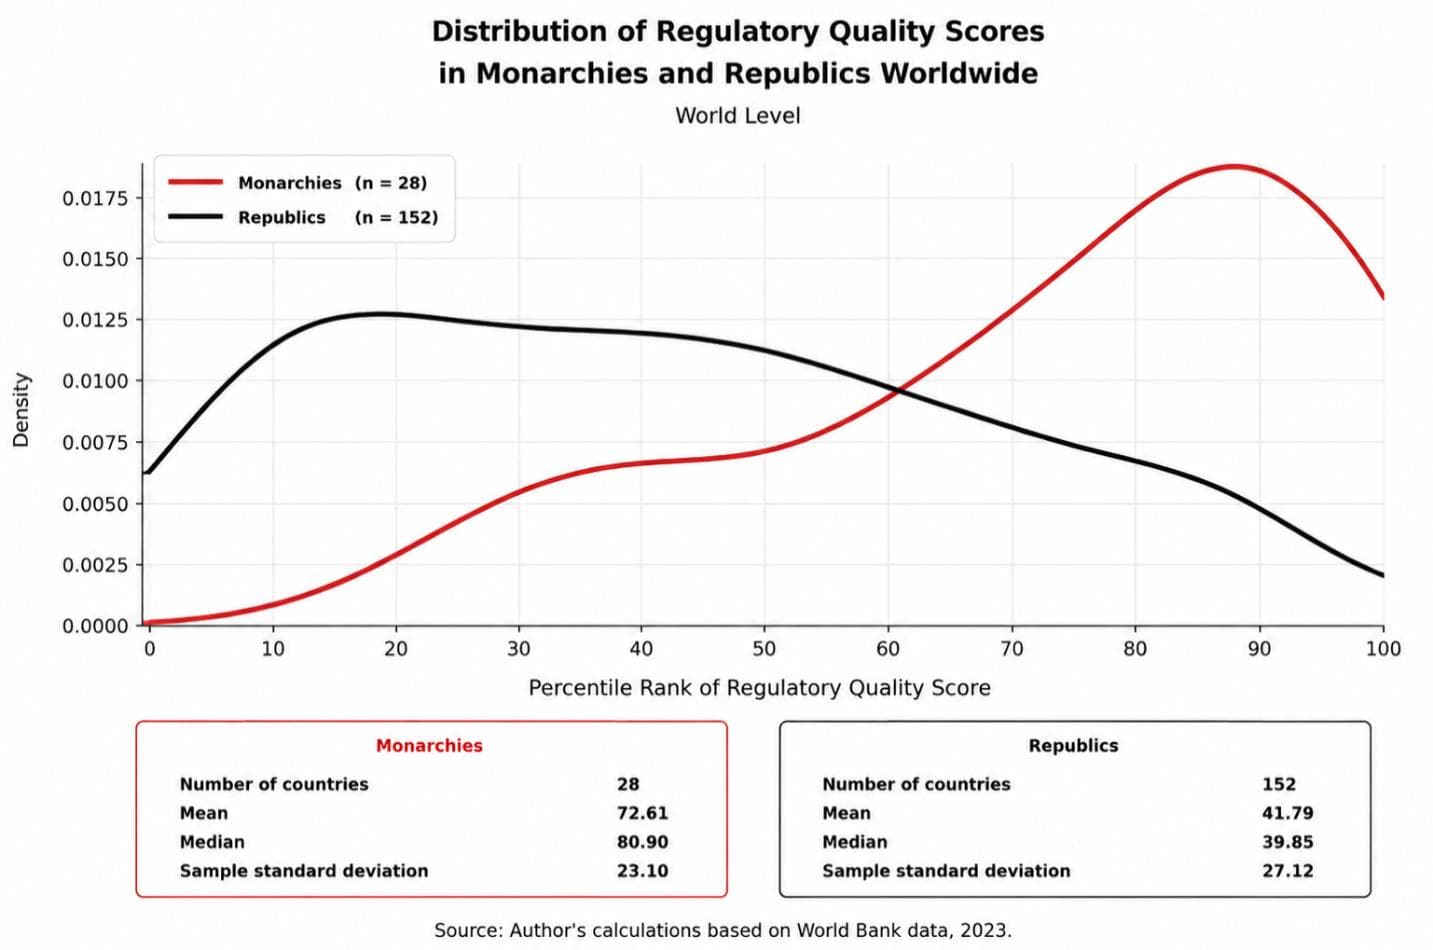
The distribution of Regulatory Quality scores across countries worldwide shows that the curve for monarchies is shifted toward higher values relative to that for republics. Since higher values on this indicator represent better regulatory quality, greater government capacity to formulate and implement sound policies, and a more favorable environment for economic activity, this pattern indicates that monarchies in this dataset perform better on average.
The mean Regulatory Quality score is 72.61 for monarchies and 41.79 for republics. The corresponding medians are 80.90 and 39.85, respectively. Thus, the observed difference is not driven solely by a few countries with exceptionally high scores; it is also clearly visible in the central tendency of the two distributions.
Although the two curves overlap to some extent, the greater concentration of monarchies at the higher end of the indicator and of republics at lower values reveals a substantial difference in the overall distributional patterns of the two groups. The statistical tests presented below determine whether this observed difference is also statistically significant.
Comparison of the “Regulatory Quality” Indicator Between Constitutional and Non-Constitutional Monarchies Worldwide
To examine whether the type of monarchy is associated with regulatory quality, monarchies were divided into two groups: constitutional monarchies and semi-constitutional and absolute monarchies. Their performance was then compared using the World Bank’s 2023 Regulatory Quality indicator.
The results show that constitutional monarchies, with a mean score of 78.21 and a median of 89.60, performed better than semi-constitutional and absolute monarchies, which had a mean of 66.15 and a median of 68.90. The standard deviations of the two groups are also very similar—22.90 and 22.47, respectively—indicating approximately comparable levels of dispersion.
Nevertheless, Welch’s t-test did not find the difference between the two group means to be statistically significant (t = 1.40, p > 0.05). At the same time, the effect size, Hedges’ g = 0.52, indicates a moderate effect. Thus, although the observed difference is not negligible in standardized terms, the limited number of countries in the two groups means that the available statistical evidence is insufficient to draw a firm conclusion that one type of monarchy outperforms the other.
Overall, the findings indicate that both groups of monarchies perform relatively well on the Regulatory Quality indicator. Although constitutional monarchies have a higher average score, this difference is not statistically significant at the conventional level. Based on the available data, therefore, it cannot be concluded that the type of monarchy, by itself, is associated with a statistically significant difference in regulatory quality.
Comparison of the “Regulatory Quality” Indicator Between Commonwealth Realms and Republics Worldwide
To assess the position of the Commonwealth realms on the Regulatory Quality indicator, their performance was compared with that of republics worldwide using the World Bank’s 2023 Regulatory Quality data.
The results show that the Commonwealth realms, with a mean score of 61.21 and a median of 62.05, performed better than republics worldwide, which had a mean of 41.79 and a median of 39.85. The standard deviation is 24.63 for the Commonwealth realms and 27.12 for republics, indicating relatively similar levels of dispersion in the two groups.
Welch’s t-test indicates that the difference between the two group means is statistically significant (t = 2.798, p = 0.0129). The estimated difference in means is 19.42 points, with a 95% confidence interval from 4.71 to 34.13 points. The effect size, Hedges’ g = 0.72, indicates a moderate-to-large effect.
On this basis, the findings show that the Commonwealth realms, on average, performed better than republics worldwide on the Regulatory Quality indicator. The difference is not only statistically significant, but its effect size also suggests that the observed gap is substantial in practical terms.
As emphasized throughout this study, however, this is an observational comparison. It reflects the historical performance of the two groups of countries and, by itself, is insufficient to establish a causal relationship between regime type and regulatory quality.
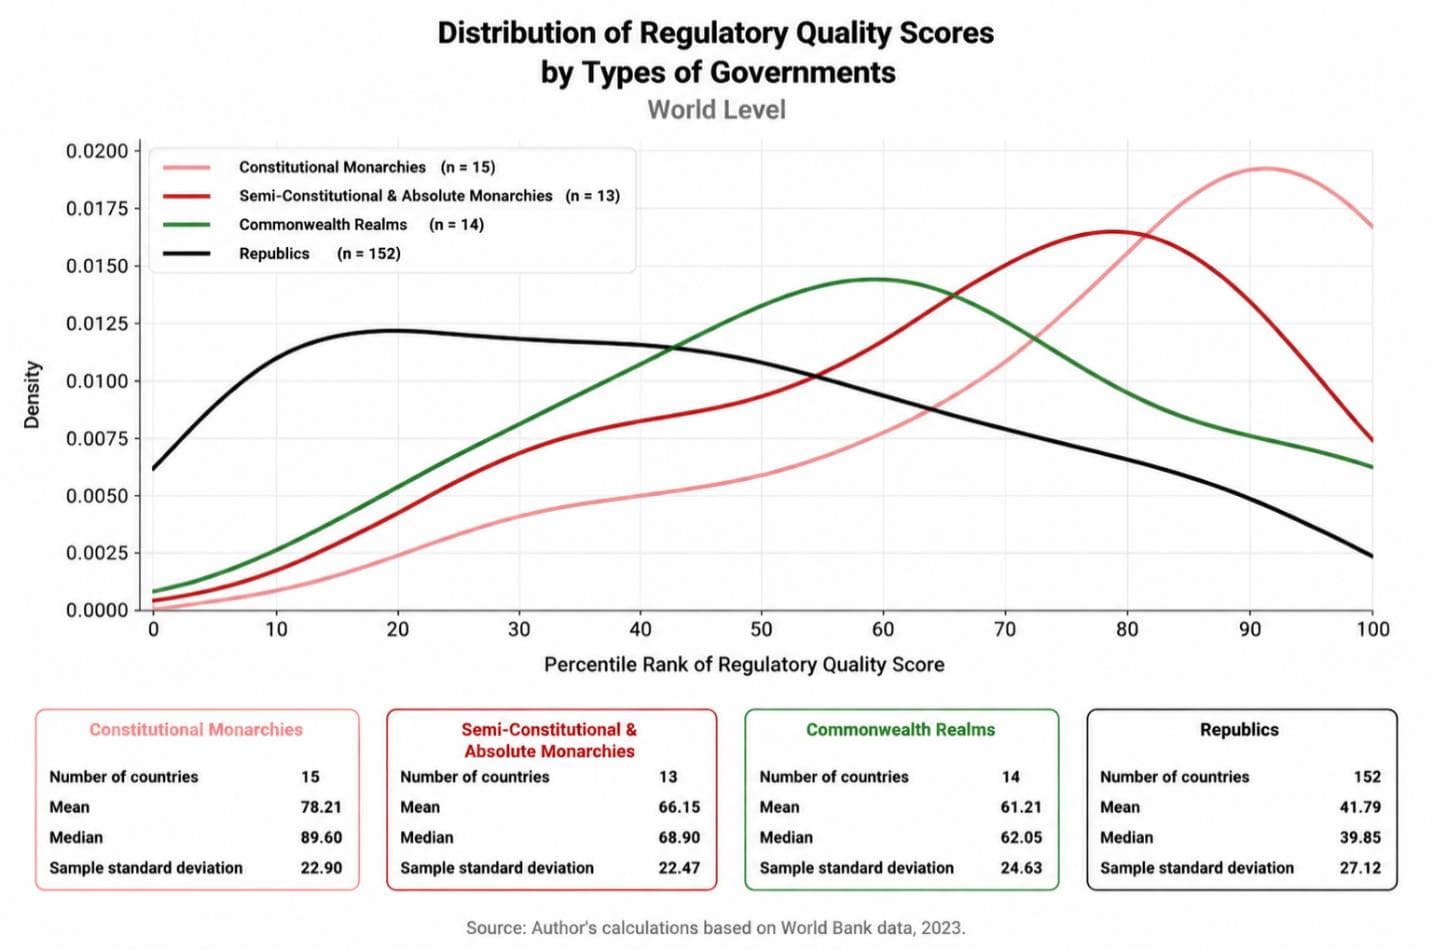
The chart above shows the distribution of the Regulatory Quality indicator across four groups of countries: constitutional monarchies, semi-constitutional and absolute monarchies, Commonwealth realms, and republics worldwide. Each curve represents the density distribution of countries across different values of the indicator. Thus, a curve shifted further to the right indicates a greater concentration of countries in that group at higher percentile ranks of regulatory quality.
As the chart shows, the distribution of constitutional monarchies is more heavily concentrated at the higher end of the indicator than those of the other groups. This pattern is consistent with the group’s mean of 78.21 and median of 89.60, indicating that, descriptively, constitutional monarchies have the highest central values among the four groups examined.
Semi-constitutional and absolute monarchies are also concentrated largely at relatively high values of the indicator. This group has a mean of 66.15 and a median of 68.90, both substantially higher than the corresponding values for republics worldwide. However, as the preceding statistical test showed, the difference between this group and constitutional monarchies is not statistically significant. The chart therefore does not provide a basis for concluding that either of these two types of monarchy definitively outperforms the other.
The distribution of the Commonwealth realms is likewise more concentrated in the middle and upper ranges of the indicator than that of republics worldwide. Their mean of 61.21 and median of 62.05, compared with a mean of 41.79 and median of 39.85 for republics, indicate descriptively better performance among the Commonwealth realms. As shown by the Welch test, this difference is also statistically significant.
By contrast, republics worldwide display a broader distribution across the full range of the indicator, with a larger share of their distribution concentrated at low and intermediate values. Their mean of 41.79 and median of 39.85 are also lower than the corresponding values for each of the other three groups.
Overall, the chart shows that, in this dataset, all three monarchy-related groups are more concentrated at higher levels of regulatory quality than republics worldwide. However, the magnitude of the differences among the monarchy groups themselves varies, and the shape of the distributions alone is not sufficient to determine whether these differences are statistically significant. The chart should therefore be interpreted alongside the results of the statistical tests for each comparison