

Monarchy & Republic in the Laboratory of History by N. Fakhr - HTML preview
Download the book in PDF, ePub for a complete version.
Comparison of the “Political Stability and Absence of Violence/Terrorism” Indicator between Monarchies and Republics across Continents and in the Middle East
Comparison of the “Political Stability and Absence of Violence/Terrorism” Indicator between Monarchies and Republics in Asia
Indicator: Political Stability and Absence of Violence/Terrorism
Source: World Bank data
Higher values on this indicator represent a more favorable position in terms of political stability and a lower likelihood of politically motivated violence and terrorism.
The comparison includes 13 Asian monarchies and 33 Asian republics. To assess the difference between the two groups, two statistical tests were used: Welch’s t-test to compare group means and the Mann–Whitney U test to compare the rank distributions of the observations.
1. Descriptive Statistics
Group |
n |
Mean |
Median |
Sample SD |
Asian Monarchies |
13 |
60.38 |
58.80 |
21.66 |
Asian Republics |
33 |
30.72 |
26.10 |
24.01 |
Interpretation of Descriptive Statistics
The mean score on the Political Stability and Absence of Violence/Terrorism indicator is 60.38 for Asian monarchies and 30.72 for Asian republics.
Because higher values indicate a more favorable position in terms of political stability and absence of violence and terrorism, the descriptive statistics show that Asian monarchies, on average, have substantially higher scores than Asian republics.
The medians point in the same direction:
- Asian monarchies: 58.80
- Asian republics: 26.10
Thus, the observed difference is not driven solely by a few countries with exceptionally high scores; it is also evident in the central part of the distributions. The substantial difference in both means and medians provides descriptive evidence of a broad separation between the two groups.
2. Welch’s t-test for the Difference in Means
The hypotheses were defined as follows:
Null hypothesis (H₀): The mean Political Stability and Absence of Violence/Terrorism score is equal in the two groups.
Alternative hypothesis (H₁): The mean score differs between the two groups.
Welch’s t-test Results
Statistical Measure |
Value |
Mean — Asian Monarchies |
60.38 |
Mean — Asian Republics |
30.72 |
Mean Difference |
29.66 |
t-statistic |
4.21 |
Approximate df |
27.5 |
Two-sided p-value |
0.00024 |
Interpretation of Welch’s t-test
The probability value (p = 0.00024) is far below the conventional 5% significance level. The null hypothesis is therefore rejected.
The difference in mean Political Stability and Absence of Violence/Terrorism scores between Asian monarchies and republics is statistically significant.
The mean score of Asian monarchies is approximately 29.66 percentile-rank points higher than that of Asian republics. As with the global comparison, this difference should not be interpreted as meaning that monarchies are “29.66 percent more stable.” Rather, it represents the difference between the average positions of the two groups on the indicator’s percentile-rank scale.
3. Mann–Whitney U Test
To examine the difference between the two groups from a rank-based perspective without assuming normally distributed data, the non-parametric Mann–Whitney U test was also performed.
The hypotheses were:
Null hypothesis (H₀): The rank distributions of the indicator do not differ significantly between the two groups.
Alternative hypothesis (H₁): The rank distributions differ between the two groups.
Mann–Whitney U Test Results
Statistical Measure |
Value |
U-statistic |
361 |
Two-sided p-value |
0.00052 |
Interpretation of the Mann–Whitney U Test
The probability value (p = 0.00052) is well below the 5% significance level. The null hypothesis is therefore rejected.
The Mann–Whitney U test also provides statistically significant evidence that the indicator values differ between Asian monarchies and republics in their rank distributions.
The agreement between Welch’s t-test and the Mann–Whitney U test strengthens the result: the observed difference is evident both in the comparison of group means and in the rank-based distribution of country scores. Thus, the finding is not dependent on a single statistical method.
Conclusion
Among the Asian countries included in the dataset, monarchies have a mean Political Stability and Absence of Violence/Terrorism score of 60.38, compared with 30.72 for republics. The corresponding medians are 58.80 and 26.10, respectively.
Both statistical tests indicate a highly significant difference:
Test |
Result |
Welch’s t-test |
p = 0.00024 → statistically significant |
Mann–Whitney U |
p = 0.00052 → statistically significant |
Among the Asian countries for which data are available, monarchies have substantially higher average scores on the Political Stability and Absence of Violence/Terrorism indicator than republics, and the difference is statistically significant under both Welch’s t-test and the Mann–Whitney U test. The consistency of the means, medians, and two inferential tests provides strong evidence of a systematic difference between the two groups in this dataset.
As elsewhere in this study, however, this observational comparison should not by itself be interpreted as establishing a causal effect of political system on political stability. Other historical, economic, social, geographic, and geopolitical differences among Asian countries may also contribute to the observed pattern.
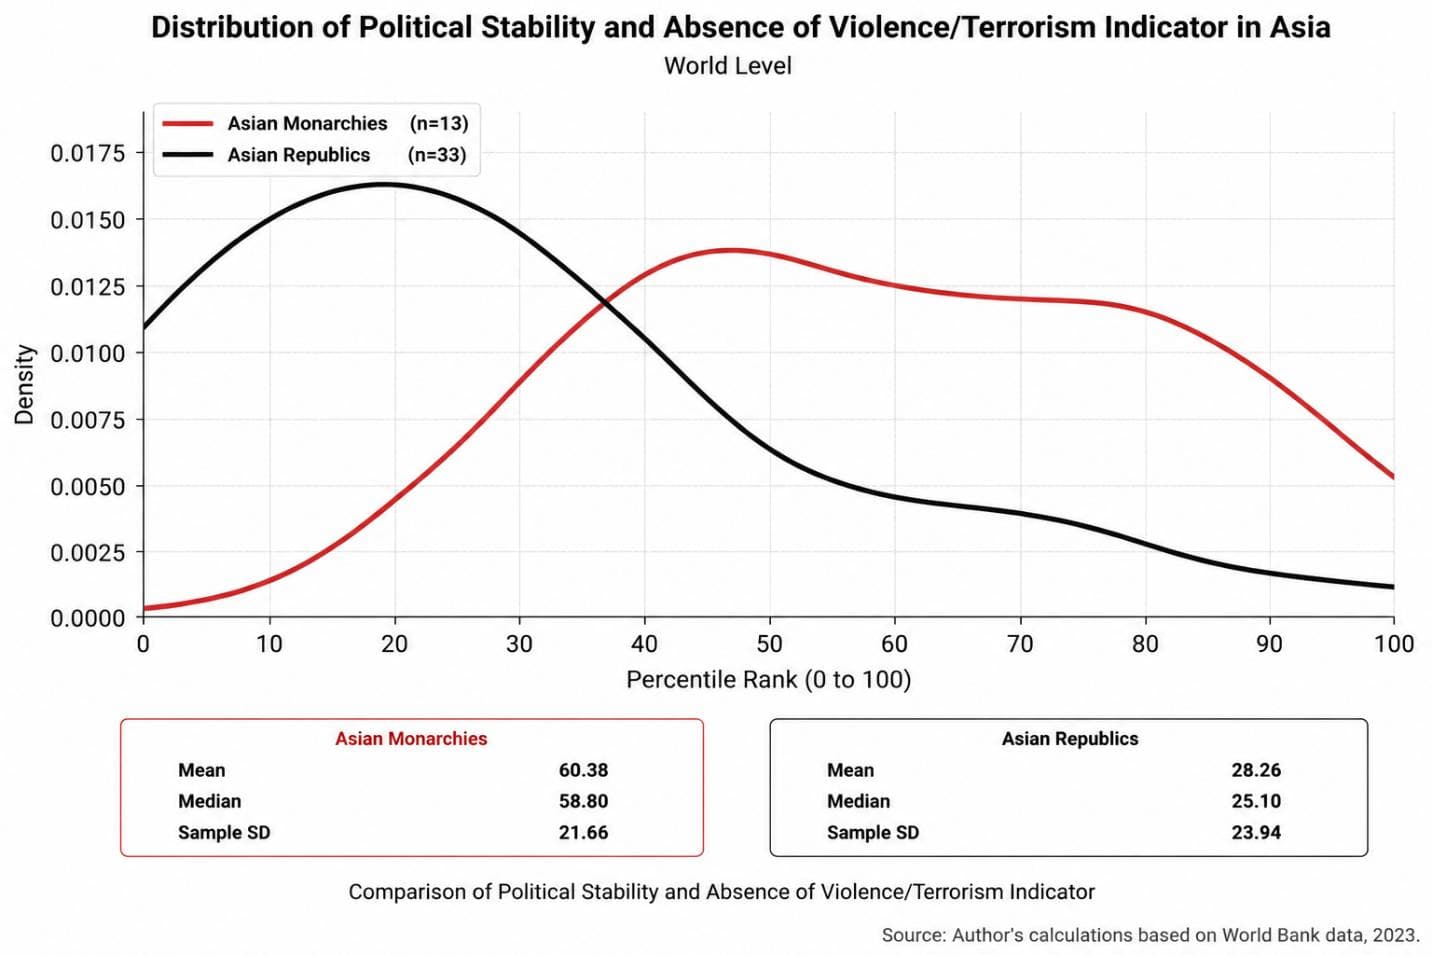
Overall, the Asian data are consistent with the pattern observed in the global comparison: monarchies in the region have, on average, shown greater political stability and a lower perceived risk of politically motivated violence, terrorism, and instability than republics. However, this finding is based on an observational comparison and does not by itself establish that political system is the direct cause of the observed difference. Historical differences, levels of development, social structures, wars, foreign interventions, and countries’ geopolitical circumstances may also have contributed to this pattern.
Comparison of the “Political Stability and Absence of Violence/Terrorism” Indicator between Monarchies and Republics in Europe
Indicator: Political Stability and Absence of Violence/Terrorism
Source: World Bank data
Higher values on this indicator represent a more favorable position in terms of political stability and a lower likelihood of politically motivated violence and terrorism.
Two statistical tests were used:
- Welch’s t-test to compare the group means.
- Mann–Whitney U test to compare the rank distributions of the observations.
1. Descriptive Statistics
Group |
n |
Mean |
Median |
Sample SD |
European Monarchies |
11 |
77.36 |
76.90 |
15.73 |
European Republics |
34 |
59.39 |
64.70 |
21.66 |
Interpretation of Descriptive Statistics
The mean Political Stability and Absence of Violence/Terrorism score is 77.36 for European monarchies and 59.39 for European republics.
Because higher values indicate a more favorable position in terms of political stability and absence of violence and terrorism, the descriptive statistics show that European monarchies have, on average, substantially higher scores than European republics.
The medians point in the same direction:
- European monarchies: 76.90
- European republics: 64.70
Thus, the observed difference is not driven solely by a few countries with exceptionally high scores; it is also evident in the central part of the distributions.
2. Welch’s t-test for the Difference in Means
The hypotheses were defined as follows:
Null hypothesis (H₀): The mean Political Stability and Absence of Violence/Terrorism score is equal in European monarchies and republics.
Alternative hypothesis (H₁): The mean score differs between the two groups.
Welch’s t-test Results
Statistical Measure |
Value |
Mean — European Monarchies |
77.36 |
Mean — European Republics |
59.39 |
Mean Difference |
17.98 |
t-statistic |
2.984 |
Approximate df |
23.37 |
Two-sided p-value |
0.0066 |
Interpretation of Welch’s t-test
The probability value (p = 0.0066) is below the conventional 5% significance level. The null hypothesis is therefore rejected.
The results indicate that the difference in mean Political Stability and Absence of Violence/Terrorism scores between European monarchies and republics is statistically significant.
In this dataset, European monarchies have a mean score approximately 17.98 percentile-rank points higher than European republics. Because the indicator is expressed as a percentile rank, this difference should not be interpreted as meaning that monarchies are “17.98 percent more stable.” Rather, it represents the difference between the average positions of the two groups on the indicator’s percentile-rank scale.
3. Mann–Whitney U Test
To examine the difference between the two groups from a rank-based perspective without assuming normally distributed data, the Mann–Whitney U test was also performed.
The hypotheses were:
Null hypothesis (H₀): The rank distributions of the indicator do not differ significantly between the two groups.
Alternative hypothesis (H₁): The rank distributions differ between the two groups.
Mann–Whitney U Test Results
Statistical Measure |
Value |
U-statistic |
276.5 |
Two-sided p-value |
0.0187 |
Interpretation of the Mann–Whitney U Test
The probability value (p = 0.0187) is below the 5% significance level. The null hypothesis is therefore rejected.
The Mann–Whitney U test also provides statistically significant evidence that the indicator values differ between European monarchies and republics in their rank distributions.
The agreement between the two tests strengthens the result. Welch’s t-test identifies a statistically significant difference in the group means, while the Mann–Whitney U test provides significant evidence of a difference in the rank distributions. Thus, the finding is not dependent on a single statistical method.
Conclusion
Among the European countries included in the dataset, monarchies have a mean Political Stability and Absence of Violence/Terrorism score of 77.36, compared with 59.39 for republics. The corresponding medians are 76.90 and 64.70, respectively.
Both statistical tests indicate a significant difference:
Test |
Result |
Welch’s t-test |
p = 0.0066 → statistically significant |
Mann–Whitney U |
p = 0.0187 → statistically significant |
Among the European countries for which data are available, monarchies have, on average, substantially higher scores on the Political Stability and Absence of Violence/Terrorism indicator than republics, and the difference is statistically significant under both Welch’s t-test and the Mann–Whitney U test. The consistency of the means, medians, and two inferential tests provides evidence of a systematic difference between the two groups in this dataset.
As with the other regional comparisons, however, this is an observational finding and does not by itself establish that political system is the direct cause of the difference. Historical trajectories, levels of development, social and institutional structures, geopolitical conditions, wars, and other country-specific factors may also contribute to the observed pattern.
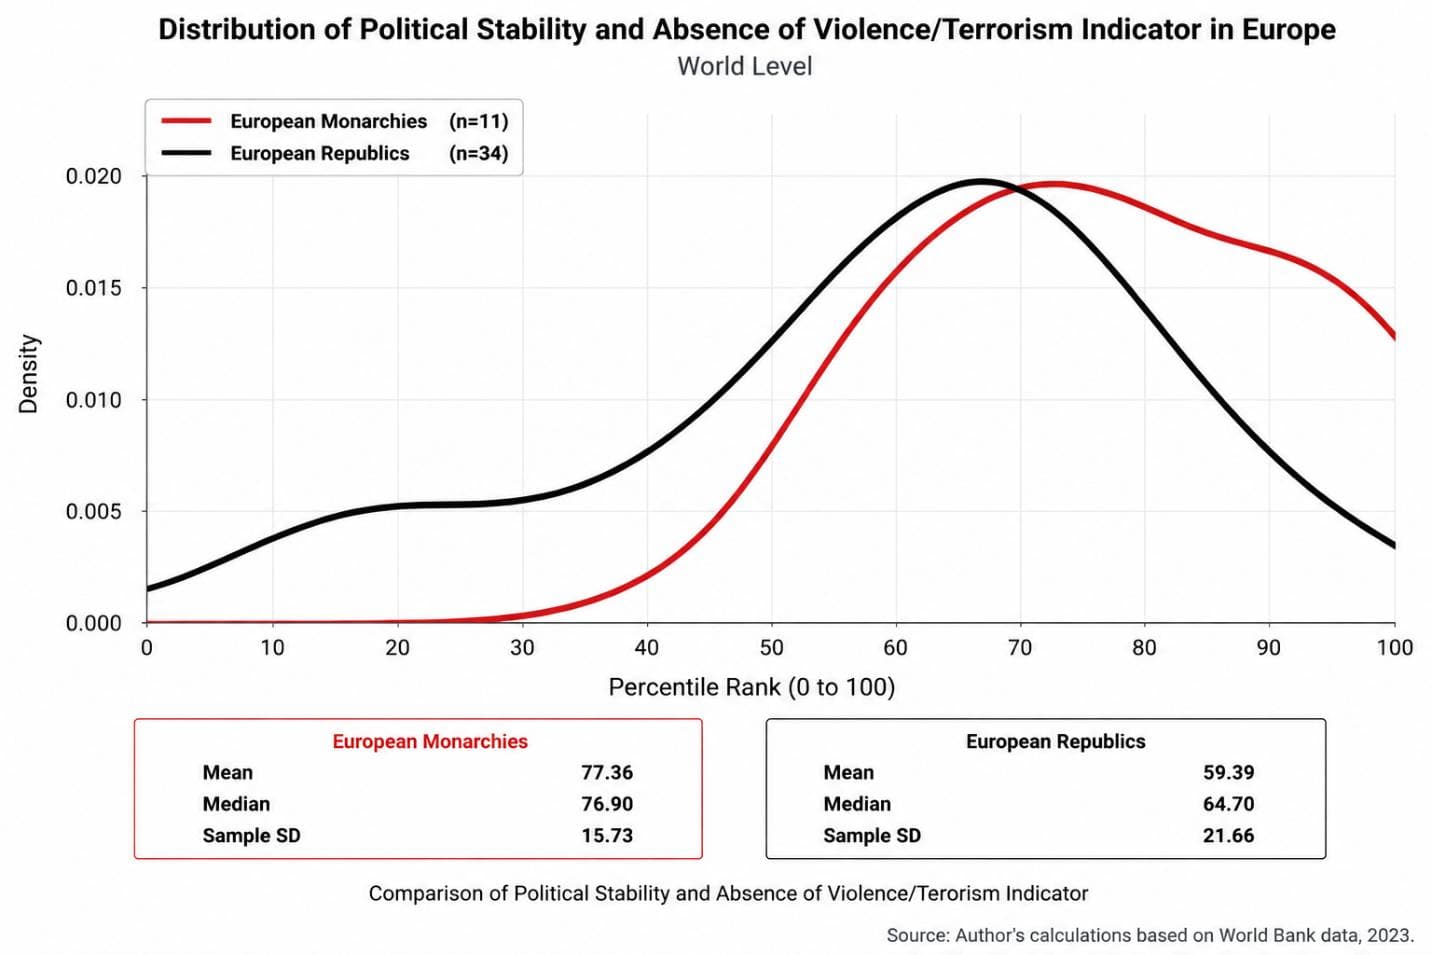
The kernel density estimate (KDE) plot reflects the same overall pattern. The distribution for European monarchies is concentrated primarily at the higher end of the index, with much of the density clustered around scores between 70 and 90. By contrast, the distribution for European republics is more dispersed and, alongside countries with very high levels of stability, also includes a number of Eastern European and post-communist republics with relatively lower scores. This greater heterogeneity helps explain the higher dispersion observed among European republics compared with monarchies.
Overall, the European data, consistent with the global and Asian results, indicate that monarchies have, on average, higher scores for political stability and absence of violence and terrorism. As in the other sections of this study, however, this finding is based on an observational comparison and does not, by itself, establish a causal relationship between the form of government and political stability. Factors such as historical legacies, the experience of communist rule, levels of development, institutional structures, and geopolitical conditions may also contribute to the observed pattern.
Robustness Test for Europe: Excluding Republics with a History of Communist Rule
Indicator |
European Monarchies |
Republics with No History of Communist Rule |
Number of countries |
11 |
13 |
Mean Political Stability and Absence of Violence score |
77.36 |
72.85 |
Median |
76.90 |
71.10 |
Sample standard deviation |
15.73 |
13.45 |
The mean Political Stability and Absence of Violence score is therefore 4.52 points, or approximately 6.2%, higher among the monarchies. The median is also about 5.8 points higher among the monarchies.
Welch’s t-test
Using a two-tailed Welch’s t-test:
t = 0.749, df = 19.87, p = 0.463
Thus, the difference between the group means is not statistically significant at the 5% level.
The effect size was:
Hedges’ g = 0.300
indicating a small effect in favor of the monarchies.
Interpretation of the Robustness Test
As in the preceding comparisons, the potential influence of Europe’s communist legacy can also be examined. After excluding republics that had experienced communist rule, the 11 European monarchies were compared with 13 republics that had never been under communist rule.
The results show that the monarchies retain their descriptive advantage after this exclusion, although the gap between the two groups narrows. The mean Political Stability and Absence of Violence score is 77.36 for the monarchies and 72.85 for the republics with no history of communist rule. The corresponding medians are 76.90 and 71.10. Thus, whether measured by the mean or the median, the monarchies continue to record higher scores.
However, Welch’s t-test indicates that the difference between the two group means is not statistically significant (t = 0.749, p = 0.463). Hedges’ g is 0.300, indicating a small standardized effect in favor of the monarchies.
Thus, excluding republics with a history of communist rule does not reverse the direction of the difference, but it substantially reduces its magnitude. European monarchies still have higher mean and median Political Stability and Absence of Violence scores, but this restricted comparison does not provide sufficient statistical evidence to reject the null hypothesis of equal group means.
This restricted comparison, however, should not replace the primary European comparison. From a methodological standpoint, excluding European republics with a history of communist rule from the overall analysis is not warranted, because these countries constitute a real part of the historical experience of republican government in Europe. Removing them could introduce a form of selection bias by excluding unfavorable cases from the historical record of republics.
Within the analytical framework of this book, the tendency of some republics to develop into communist or one-party regimes, together with the institutional legacies left by those regimes, is not treated simply as an external factor wholly independent of the form of government. Rather, it is considered part of the historical trajectory—and potentially part of the consequences—of the republican experience itself. Republics with a history of communist rule should therefore remain in the primary comparison, while their exclusion is used here only as a robustness test.
Comparison of the Political Stability and Absence of Violence/Terrorism Indicator in Africa, the Americas, and Oceania
Africa
Group |
Number of Countries |
Mean |
Median |
Sample SD |
Monarchies |
3 |
32.07 |
30.80 |
3.01 |
Republics |
50 |
28.41 |
22.05 |
22.26 |
In Africa, the mean Political Stability and Absence of Violence/Terrorism score of the continent’s three monarchies is slightly higher than that of its republics. However, the difference between the two groups is smaller than in the other continents, and the very limited number of African monarchies requires particular caution in interpreting the results.
The dispersion among republics is also substantially greater than among monarchies, indicating that African republics are considerably more heterogeneous in terms of political stability.
The Americas
Group |
Number of Countries |
Mean |
Median |
Sample SD |
Commonwealth Realms |
9 |
78.21 |
80.60 |
10.35 |
Republics |
26 |
46.41 |
45.00 |
23.03 |
In the Americas, the Commonwealth realms score, on average, more than 31 percentile-rank points higher than the republics. In addition to their higher mean, the Commonwealth realms display less dispersion, with most of them concentrated among countries with relatively high levels of political stability, whereas the republics exhibit a much wider range of performance.
Although the difference between the Commonwealth realms and republics in the Americas is striking, it should not be attributed directly or entirely to the form of government. The composition of the sample in this region is distinctive: a substantial proportion of the Commonwealth realms are small, sparsely populated Caribbean island states. Owing to their particular geographical circumstances, their distance from many of the principal centers of regional and international conflict, and their more limited exposure to certain security threats, these countries may naturally obtain higher scores on the Political Stability and Absence of Violence/Terrorism indicator.
Geographical characteristics and sample composition should therefore be regarded as potential confounding factors when interpreting these results, and the observed difference should not be attributed entirely to the form of government.
Oceania
Group |
Number of Countries |
Mean |
Median |
Sample SD |
Monarchies |
1 |
90.00 |
90.00 |
— |
Commonwealth Realms |
5 |
71.56 |
79.60 |
28.69 |
Republics |
8 |
83.06 |
89.60 |
13.24 |
In Oceania, there is only one independent monarchy, Tonga, and consequently no meaningful statistical inference can be made about the continent’s independent monarchies as a group. Moreover, unlike the pattern observed in the other continents, the mean score of Oceania’s republics is higher than that of its Commonwealth realms. This difference is largely influenced by the very low score of Papua New Guinea within the Commonwealth group, which substantially lowers the group mean.
Given the small number of countries involved, the results for Oceania should be interpreted with particular caution and should not be generalized to the same extent as the global, Asian, or European findings.
Oceania also exhibits a phenomenon similar to that observed in the Americas, although in the opposite direction. A substantial proportion of the republics in this region are small and relatively remote island states whose particular geographical circumstances leave them less exposed to many of the security threats commonly encountered in other parts of the world. The higher average score of Oceania’s republics therefore cannot, by itself, be attributed to their form of government.
Here too, sample composition and geographical characteristics, alongside other political, economic, and social factors, are likely to contribute to the observed pattern.
Comparison of the Political Stability and Absence of Violence/Terrorism Indicator in the Middle East
Group |
Number of Countries |
Mean |
Median |
Sample SD |
Monarchies |
7 |
55.53 |
58.80 |
19.69 |
Republics |
10 |
12.75 |
8.80 |
17.18 |
The Middle East exhibits one of the clearest differences between the two forms of government. The mean score for the region’s monarchies is 55.53, compared with only 12.75 for its republics, corresponding to a mean difference of approximately 42.78 percentile-rank points. The medians reinforce the same pattern: 58.80 for the monarchies compared with 8.80 for the republics. This substantial difference indicates that the higher scores of the monarchies are not merely the result of one or two exceptionally high-scoring countries, but are also evident in the central tendency of the two distributions.
Statistical Significance
Welch’s two-tailed t-test indicates that the difference between the two group means is statistically significant:
- t = 4.643
- df ≈ 11.85
- p ≈ 0.00059
- 95% confidence interval for the mean difference: 22.68 to 62.88 percentile-rank points
- Hedges’ g ≈ 2.23
The p-value is well below the conventional 5% significance threshold, and the entire 95% confidence interval lies above zero. Thus, the null hypothesis of equal group means is rejected.
Effect Size
The estimated Hedges’ g of approximately 2.23 represents an exceptionally large standardized effect. This indicates that the difference between the two groups is not only statistically significant but also very large in magnitude.
As elsewhere in this analysis, however, the difference of 42.78 points should be interpreted as a difference in percentile-rank scores, not as evidence that monarchies are “42.78 percent more stable” than republics.
Conclusion
Among the Middle Eastern countries included in the analysis, monarchies recorded substantially higher Political Stability and Absence of Violence/Terrorism scores than republics. The difference is evident in both the mean and the median, is statistically significant under Welch’s t-test, and is accompanied by an exceptionally large effect size.
The magnitude of the difference makes the Middle East particularly noteworthy within the regional comparisons. Nevertheless, these results remain observational and do not, by themselves, establish that the form of government is the direct cause of the observed difference. Wars, foreign intervention, geopolitical rivalry, economic structures, institutional development, and other historical and social factors may also contribute to the exceptionally large gap observed between the two groups.
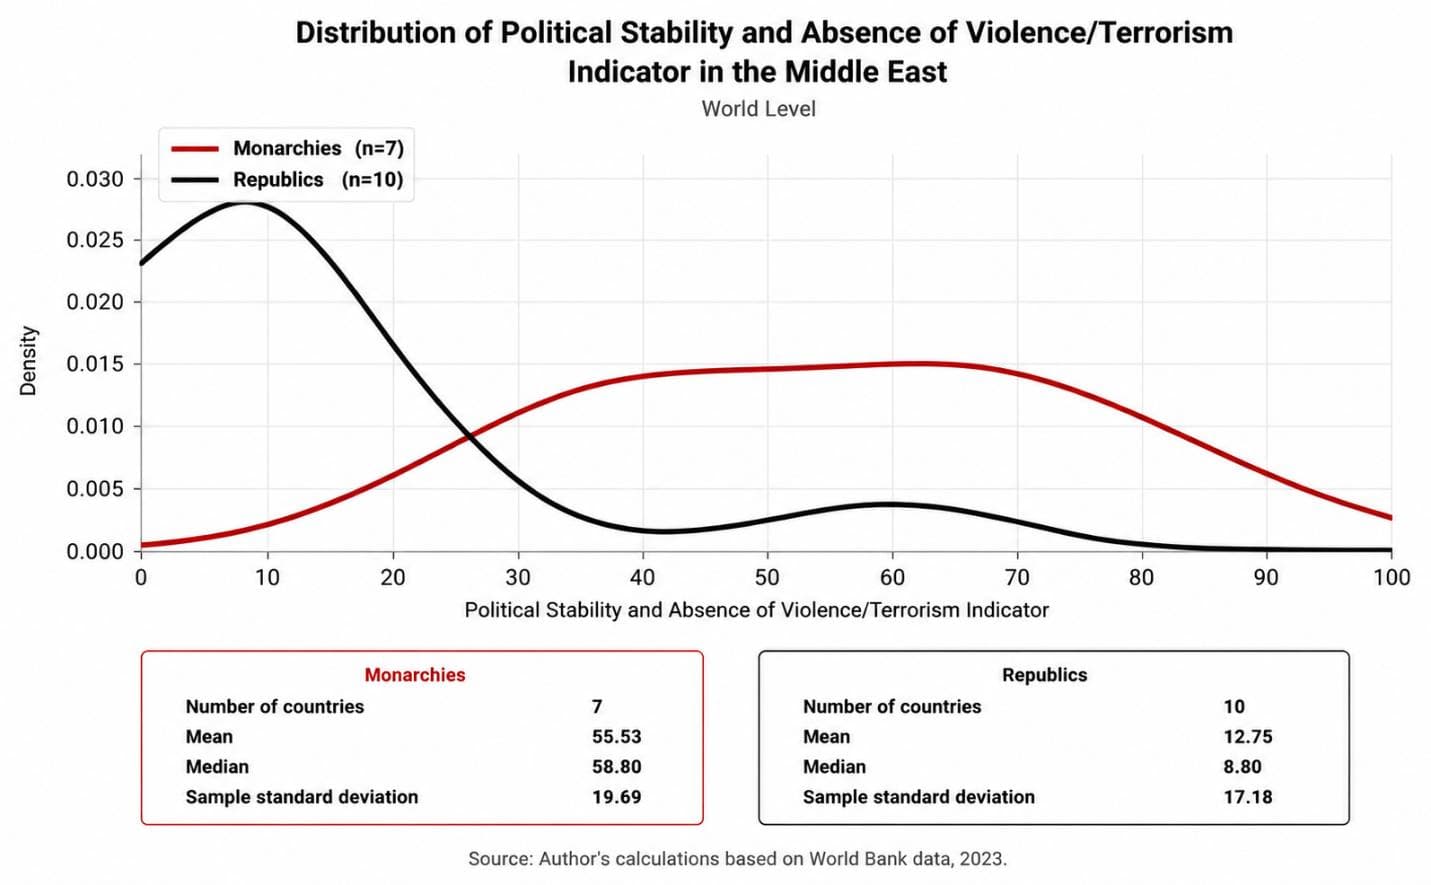
The distribution curve for the republics is concentrated predominantly in the lower range of the indicator, whereas the distribution for the monarchies is clearly shifted toward higher scores.
However, this finding should not be interpreted as proof of a simple causal relationship between monarchy and political stability. The Middle East is a region in which civil wars, foreign interventions, ethnic and sectarian conflicts, regional rivalries, state institutional collapse, and differences in access to economic resources simultaneously affect national stability. Many of the region’s republics have experienced war, revolution, sanctions, occupation, or political breakdown in recent decades, but disentangling the effect of regime type from these factors is difficult within an observational comparison.
Accordingly, the present finding indicates a strong empirical association, rather than definitive proof that regime type alone caused the observed difference.