

Monarchy & Republic in the Laboratory of History by N. Fakhr - HTML preview
Download the book in PDF, ePub for a complete version.
Security Report
So far, we have seen that, across the indicators examined for the most important goal of government—welfare—monarchies have, overall, performed better than republics. We now turn to the second goal of government, security, to examine which of the two “vaccines”—monarchy or republic—has in practice been associated with greater protection against violence, terrorism, and political instability.
Political Stability and Absence of Violence/Terrorism
The World Bank publishes a set of measures known as the Worldwide Governance Indicators (WGI), which assess different dimensions of governance. One of these is Political Stability and Absence of Violence/Terrorism, which, for brevity, will hereafter be referred to as the “Absence of Violence” indicator.
This indicator does not measure actual incidents of violence or terrorism alone. Rather, it captures perceptions of the likelihood of political instability and/or politically motivated violence, including terrorism. It therefore provides a broader picture of political stability and security than a simple count of violent or terrorist incidents.
This study uses the indicator’s Percentile Rank. The percentile rank represents each country’s relative position compared with the other countries assessed and is expressed on a scale from 0 to 100. Higher values indicate better performance in terms of political stability and the absence of violence and terrorism. In other words, the higher a country’s percentile rank, the more favorable its relative position on this indicator.
The use of percentile ranks also involves an important interpretive consideration: the numerical distance between two percentile ranks should not be interpreted directly as an absolute difference in the level of security. These values primarily represent countries’ relative positions within the global distribution.
The data used in this chapter are for 2023 (Appendix RDS-D01).
Global Comparison of Monarchies and Republics on the “Political Stability and Absence of Violence/Terrorism” Indicator
1. Descriptive Statistics
Group |
Number of Countries (n) |
Mean |
Median |
Sample SD |
Monarchies |
28 |
65.08 |
67.30 |
22.74 |
Republics |
152 |
41.61 |
39.10 |
27.45 |
Interpretation of the Descriptive Statistics
The mean score on the Political Stability and Absence of Violence/Terrorism indicator is 65.08 for monarchies and 41.61 for republics.
Because a higher percentile rank on this indicator represents a more favorable position in terms of political stability and the absence of violence and terrorism, the descriptive statistics show that monarchies in this dataset have, on average, substantially higher scores than republics.
The medians point in the same direction:
- Monarchies: 67.30
- Republics: 39.10
Thus, the observed difference is not driven solely by a few countries with exceptionally high scores; it is also evident in the central part of the distributions.
Despite considerable dispersion within both groups, descriptive statistics alone are insufficient to determine whether the observed difference is statistically significant. Inferential tests were therefore conducted to examine the difference more rigorously.
2. Welch’s t-test for the Difference in Means
The hypotheses were defined as follows:
Null hypothesis (H₀): The mean score on the Political Stability and Absence of Violence/Terrorism indicator is equal in monarchies and republics.
Alternative hypothesis (H₁): The mean score differs between the two groups.
Welch’s t-test Results
Statistic |
Value |
Mean — Monarchies |
65.08 |
Mean — Republics |
41.61 |
Mean Difference |
23.47 |
t-statistic |
4.849 |
Welch-adjusted degrees of freedom |
42.90 |
Two-tailed p-value |
0.0000166 |
95% CI for the Mean Difference |
13.71 to 33.23 |
Interpretation of Welch’s t-test
The p-value (p ≈ 0.0000166) is far below the conventional significance level of 0.05. The null hypothesis is therefore rejected.
The result indicates that the difference in the mean scores of monarchies and republics is statistically significant. On average, monarchies score approximately 23.47 percentile-rank points higher than republics.
The 95% confidence interval for the mean difference extends from approximately 13.71 to 33.23 points. Because this interval does not include zero, it is consistent with the conclusion that the difference between the two group means is statistically significant.
It is important to note that the indicator is reported as a percentile rank. The difference of 23.47 points should therefore not be interpreted as meaning that monarchies are “23.47 percent safer” than republics. Rather, it represents the difference between the average positions of the two groups on the indicator’s percentile-rank scale.
3. Mann–Whitney U Test
To examine the difference between the two groups from another perspective, the non-parametric Mann–Whitney U test was also conducted. This test is based on the ranks of the observations and does not depend on an assumption of normally distributed data.
The hypotheses were defined as follows:
Null hypothesis (H₀): There is no statistically significant difference in the rank distributions of the indicator between the two groups.
Alternative hypothesis (H₁): The rank distributions of the indicator differ between the two groups.
Mann–Whitney U Test Results
Statistic |
Value |
U statistic |
3,152 |
Two-tailed p-value |
0.0000535 |
Interpretation of the Mann–Whitney U Test
The p-value (p ≈ 0.0000535) is far below the 0.05 significance level. The null hypothesis is therefore rejected.
This test likewise indicates that the indicator values differ significantly between the two groups in terms of their ranks. Given that both the mean and median are substantially higher among monarchies than among republics, the observed difference is in the direction of higher indicator values for monarchies.
The consistency between the two tests is important. Welch’s t-test identifies a statistically significant difference in the means, while the Mann–Whitney U test provides significant evidence of a difference in the rank distributions of the two groups. The result is therefore not dependent on the choice of a single statistical method.
4. Effect Size
To assess the standardized magnitude of the observed difference between the two groups, Hedges’ g was calculated:
Hedges’ g ≈ 0.87
By conventional benchmarks, this represents a large effect size. Thus, the observed difference between monarchies and republics is not only statistically significant but also substantial in standardized magnitude.
The positive sign indicates that monarchies have a higher mean score than republics. Since higher values on this indicator represent a more favorable position in terms of political stability and the absence of violence and terrorism, the direction of the effect size is fully consistent with the descriptive statistics.
Summary
In the 2023 data, the mean score on the Political Stability and Absence of Violence/Terrorism indicator is 65.08 for monarchies and 41.61 for republics. The corresponding medians are 67.30 and 39.10, respectively. Both descriptive measures therefore point toward better performance among monarchies.
Both inferential tests also identify a statistically significant difference between the two groups:
Test |
Result |
Welch’s t-test |
p = 0.0000166 → Significant |
Mann–Whitney U |
p = 0.0000535 → Significant |
In addition, Hedges’ g ≈ 0.87 indicates a large effect size, while the 95% confidence interval for the mean difference, 13.71 to 33.23 percentile-rank points, lies entirely above zero.
Conclusion
The 2023 data show that monarchies worldwide performed better, on average, than republics on the Political Stability and Absence of Violence/Terrorism indicator. The higher mean and median among monarchies, the very strong statistical significance found by both tests, and the large effect size all point in the same direction. Thus, the observed difference is not only substantial descriptively but is also supported by strong statistical evidence of a difference between the two groups.
These findings, however, do not by themselves establish that regime type is the direct cause of the observed difference. A variety of factors—including levels of development, geographical conditions, social structures, natural resources, and countries’ geopolitical environments—may also influence political stability. Moreover, some factors, such as wars or foreign interventions, may themselves be partly influenced by the quality of governance and by governments’ domestic and foreign policies. Consequently, as with any observational study, fully disentangling cause and effect remains inherently difficult.
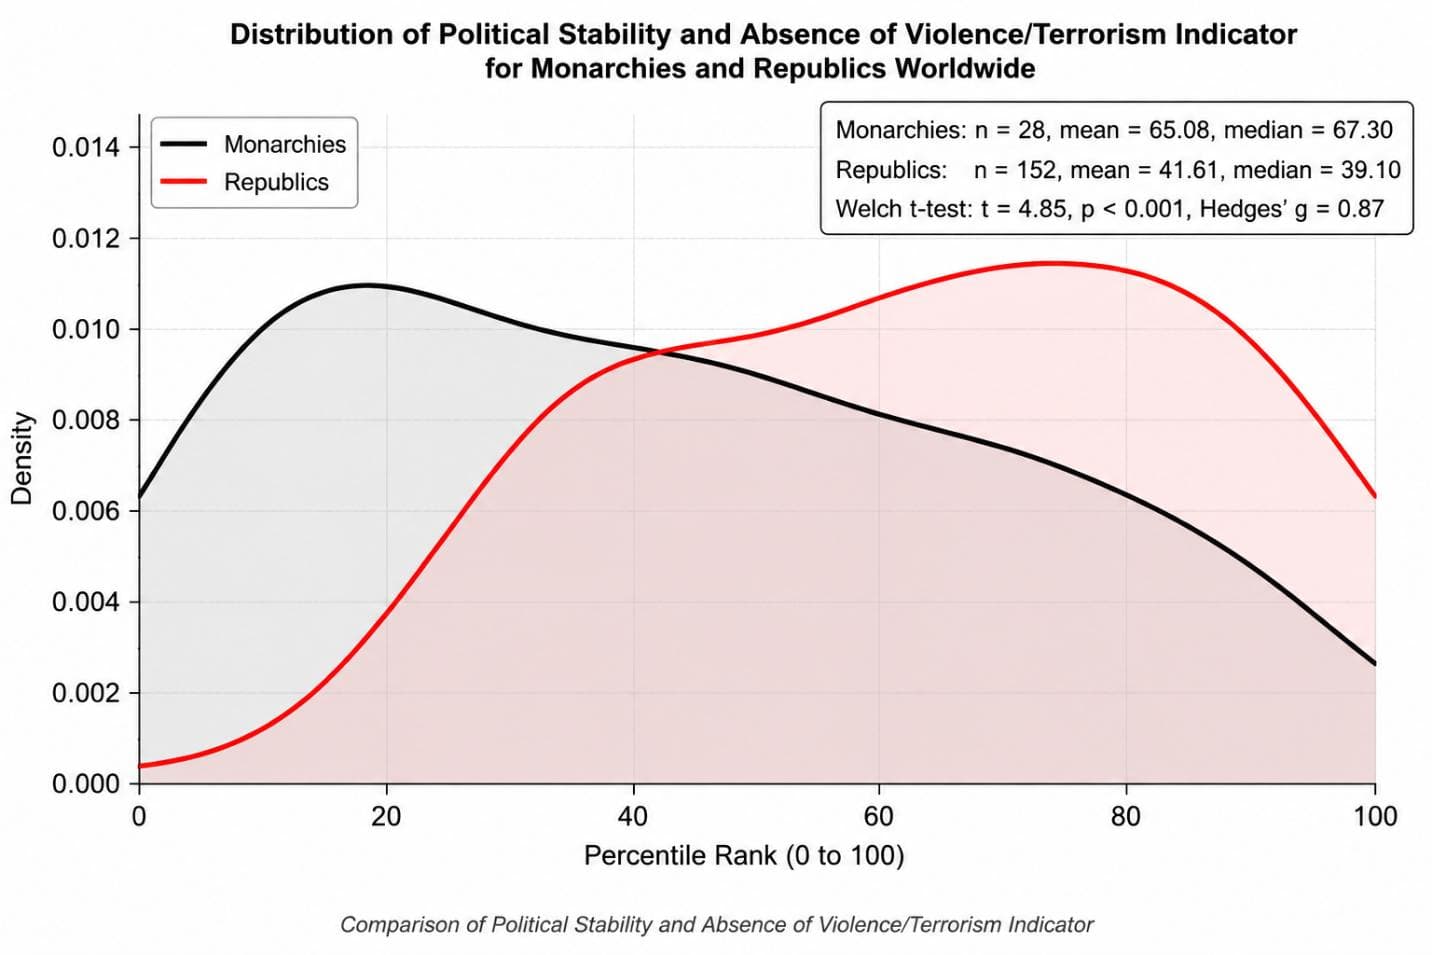
The distribution of the Political Stability and Absence of Violence/Terrorism indicator across countries worldwide shows that the distribution for monarchies is shifted toward higher values relative to that of republics. Since higher values on this indicator represent greater political stability and a lower likelihood of violence and instability, this shift indicates that monarchies in this dataset exhibit, on average, higher levels of political stability.
The mean indicator score is 65.08 for monarchies and 41.61 for republics. The corresponding medians are 67.30 and 39.10, respectively. Thus, the observed difference is not driven solely by a few countries with exceptionally high scores; it is also evident in the central part of the distributions.
The partial overlap between the two curves reflects considerable variation among countries within both groups. Nevertheless, the greater concentration of the monarchy distribution at higher indicator values reveals a distinct overall pattern between the two groups. The statistical tests presented below assess whether this observed difference is also statistically significant.
Comparison of the “Political Stability and Absence of Violence/Terrorism” Indicator between Constitutional and Non-Constitutional Monarchies Worldwide
Descriptive Statistics
Indicator |
Constitutional Monarchies |
Semi-Constitutional and Absolute Monarchies |
Number of countries |
15 |
13 |
Mean |
63.36 |
67.05 |
Median |
62.10 |
70.10 |
Sample SD |
19.34 |
26.82 |
Statistical Significance Test (Welch’s t-test)
- t = −0.412
- p = 0.684
Therefore, the difference between the two group means is not statistically significant.
Effect Size
- Hedges’ g = −0.16
This value indicates a very small effect size.
Magnitude of the Descriptive Difference
The mean score on the Political Stability and Absence of Violence/Terrorism indicator is 63.36 for constitutional monarchies and 67.05 for semi-constitutional and absolute monarchies. Thus, descriptively, the latter group scores approximately 3.69 percentile-rank points higher. The corresponding medians are 62.10 for constitutional monarchies and 70.10 for semi-constitutional and absolute monarchies.
Nevertheless, there is considerable dispersion within both groups, particularly among semi-constitutional and absolute monarchies, where the sample standard deviation is 26.82, compared with 19.34 among constitutional monarchies.
Statistical Significance
To assess whether the difference between the two group means extends beyond random sampling variation, Welch’s t-test was conducted. The test indicates that the difference is not statistically significant (t = −0.412, p = 0.684).
Effect Size
The estimated Hedges’ g is −0.16, corresponding to a very small effect size. The negative sign simply reflects the direction of the comparison: the mean score for constitutional monarchies is slightly lower than that for semi-constitutional and absolute monarchies. The magnitude of the effect indicates that the practical difference between the two types of monarchy is small.
Conclusion
Based on the 2023 data, there is no statistical evidence that constitutional monarchies and semi-constitutional and absolute monarchies differ in their performance on the Political Stability and Absence of Violence/Terrorism indicator. The difference between the group means is small, statistically non-significant, and accompanied by a very small effect size. Thus, for this indicator, the distinction between these two types of monarchy is not associated with a substantial difference in security-related performance.
Comparison of the “Political Stability and Absence of Violence/Terrorism” Indicator between Commonwealth Realms and Republics Worldwide
Descriptive Statistics
Based on the classification used in the current dataset, the Commonwealth group includes 14 countries, while the global republic group includes 152 countries.
Indicator |
Commonwealth Realms |
Republics Worldwide |
Number of countries |
14 |
152 |
Mean |
75.84 |
41.61 |
Median |
80.60 |
39.10 |
Sample SD |
18.17 |
27.46 |
The mean score on the Political Stability and Absence of Violence/Terrorism indicator is 75.84 for the Commonwealth realms and 41.61 for republics worldwide. Thus, the Commonwealth realms have a mean score approximately 34.23 percentile-rank points higher than that of the republics.
The median is also substantially higher among the Commonwealth realms: 80.60, compared with 39.10 for republics. The fact that both the mean and median point in the same direction indicates that the descriptive advantage of the Commonwealth realms is not driven solely by a few exceptional countries, but is also evident in the central part of the distribution.
Scores are also more dispersed among republics. The sample standard deviation is 27.46 for republics, compared with 18.17 for the Commonwealth realms. Thus, in addition to having a lower mean, the republic group displays greater variation in performance on this indicator.
Statistical Significance
To assess the statistical significance of the difference between the two group means, Welch’s t-test was used. The results are:
- t = 6.408
- Approximate df = 18.97
- p = 0.0000038
- p < 0.001
The difference between the Commonwealth realms and republics worldwide is therefore highly statistically significant.
The 95% confidence interval for the difference between the group means is:
23.05 to 45.41 percentile-rank points
Because the entire confidence interval lies above zero, the data provide strong statistical evidence that the mean score of the Commonwealth realms is higher than that of republics worldwide.
It is important to note that these values are percentile ranks. Thus, the 34.23-point difference should not be interpreted as meaning that the Commonwealth realms are “34.23 percent more stable” or “34.23 percent safer.” Rather, it represents the difference between the average positions of the two groups on the indicator’s percentile-rank scale.
Effect Size
The estimated effect size is:
Hedges’ g = 1.27
This represents a large effect size. Thus, the observed difference is not only statistically significant but also substantial in standardized terms. In other words, the separation between the two groups is large relative to the variability observed within them.
Conclusion
The 2023 data show that the Commonwealth realms, on average, performed substantially better than republics worldwide on the Political Stability and Absence of Violence/Terrorism indicator. Their mean score was approximately 34.23 percentile-rank points higher; the difference was highly statistically significant, and the standardized effect size was large.
In this comparison, membership in the Commonwealth-realm group is therefore associated with higher levels of political stability and absence of violence and terrorism. However, because this is an observational comparison, the finding does not by itself establish a causal relationship between constitutional structure and political stability. Other factors—including levels of development, geography, social structure, and the geopolitical environment—may also contribute to the observed difference.
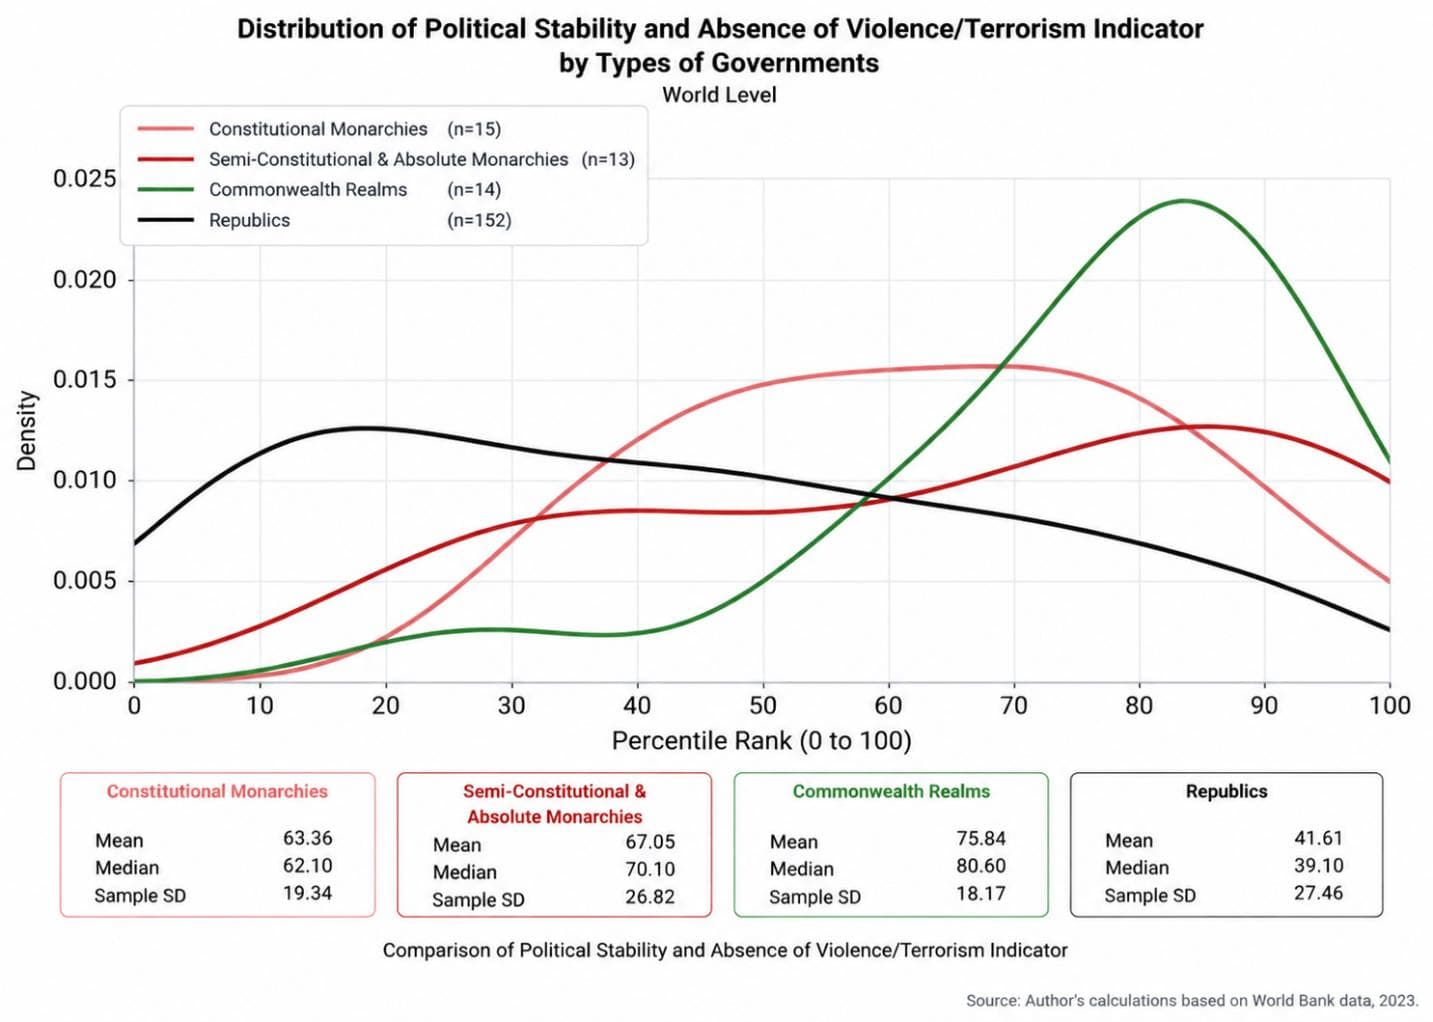
The figure shows the distribution of the Political Stability and Absence of Violence/Terrorism indicator across four groups of political systems: constitutional monarchies, semi-constitutional and absolute monarchies, Commonwealth realms, and republics. Unlike bar charts, which display only the mean of each group, the kernel density estimation (KDE) plot illustrates how country scores within each group are distributed across the full range of the indicator.
All three monarchy-related groups—constitutional monarchies, semi-constitutional and absolute monarchies, and Commonwealth realms—are shifted toward higher scores relative to republics. By contrast, the distribution for republics is more concentrated in the low-to-middle range of the indicator and also exhibits greater dispersion.
Among the three monarchy-related groups, the Commonwealth realms show the strongest concentration at the upper end of the scale, indicating relatively high levels of political stability among most countries in this group. Constitutional monarchies and semi-constitutional and absolute monarchies display comparatively similar distributions, with substantial overlap between their curves. This pattern is consistent with the statistical results reported in this chapter, which indicate that the difference between these two groups is not statistically significant.
Overall, the figure suggests that the observed difference between monarchies and republics is not driven solely by a small number of exceptionally high- or low-performing countries. Rather, the overall distribution of the data also shows a greater concentration of monarchy-related groups at higher levels of political stability and absence of violence. Nevertheless, the overlap among the curves indicates that political system is only one of the factors associated with variation in this indicator; historical, economic, social, and geopolitical factors may also contribute to differences in country performance.