

Monarchy & Republic in the Laboratory of History by N. Fakhr - HTML preview
Download the book in PDF, ePub for a complete version.
Comparison of the Gini Index: Monarchies and Republics Across Continents and in the Middle East
Comparison of the Gini Index: Monarchies and Republics in Asia
In this section, the Gini Index of Asian countries is compared between two groups:
- Asian monarchies
- Asian republics
Two statistical tests were conducted to examine differences between the groups:
- Welch’s t-test to compare the means
- Mann–Whitney U test to compare the distributions
1. Descriptive Statistics
Group |
Countries (n) |
Mean |
Median |
Population SD |
Asian monarchies |
7 |
33.87 |
33.50 |
3.42 |
Asian republics |
31 |
34.26 |
34.50 |
4.62 |
Interpretation of the Descriptive Statistics
The mean Gini Index is 33.87 among Asian monarchies and 34.26 among Asian republics.
Since a lower Gini Index indicates lower inequality, the descriptive statistics suggest that Asian monarchies have, on average, a slightly lower level of inequality.
However, the difference between the means is very small:
33.87 − 34.26 = −0.39
Thus, the observed difference is less than one Gini point.
The medians also differ only slightly:
- Monarchies: 33.50
- Republics: 34.50
At the descriptive level, therefore, the two groups exhibit very similar patterns. Statistical tests are required to determine whether the small observed difference is statistically meaningful.
2. Welch’s t-test for the Difference in Means
The hypotheses were defined as follows:
Null hypothesis (H₀): The mean Gini Index is equal in Asian monarchies and republics.
Alternative hypothesis (H₁): The mean Gini Index differs between the two groups.
Results of Welch’s t-test
Statistic |
Value |
Mean — Asian monarchies |
33.87 |
Mean — Asian republics |
34.26 |
Mean difference |
−0.39 |
t-statistic |
−0.210 |
Approximate degrees of freedom |
12.06 |
p-value |
0.837 |
Interpretation of Welch’s t-test
The p-value (p = 0.837) is substantially greater than the conventional 5% significance level. The null hypothesis is therefore not rejected.
This result indicates that the difference in the mean Gini Index between Asian monarchies and republics is not statistically significant.
In other words, the available data provide no statistical evidence that the two groups differ in their mean level of inequality.
3. Mann–Whitney U Test
To examine the overall distributions without assuming normality, the Mann–Whitney U test was also conducted.
The hypotheses were defined as follows:
Null hypothesis (H₀): There is no significant difference in the rank distribution of Gini values between the two groups.
Alternative hypothesis (H₁): The rank distributions of Gini values differ between the two groups.
Results of the Mann–Whitney U Test
Statistic |
Value |
U-statistic |
103 |
p-value |
0.872 |
Interpretation of the Mann–Whitney U Test
The p-value (p = 0.872) is substantially greater than the 5% significance level. The null hypothesis is therefore not rejected.
This test likewise provides no statistically significant evidence of a rank-based difference in Gini values between Asian monarchies and republics.
Conclusion
For the Gini Index data used in this study for Asia:
Group |
Mean Gini Index |
Monarchies |
33.87 |
Republics |
34.26 |
Asian monarchies have a slightly lower mean Gini Index, but the difference is very small and neither statistical test identifies it as significant:
- Welch’s t-test: p = 0.837
- Mann–Whitney U test: p = 0.872
Therefore, among the Asian countries examined, no statistically significant difference in the Gini Index is observed between monarchies and republics. Although the mean Gini Index is slightly lower among monarchies, the difference is too small to be statistically distinguished between the two groups in the available data.
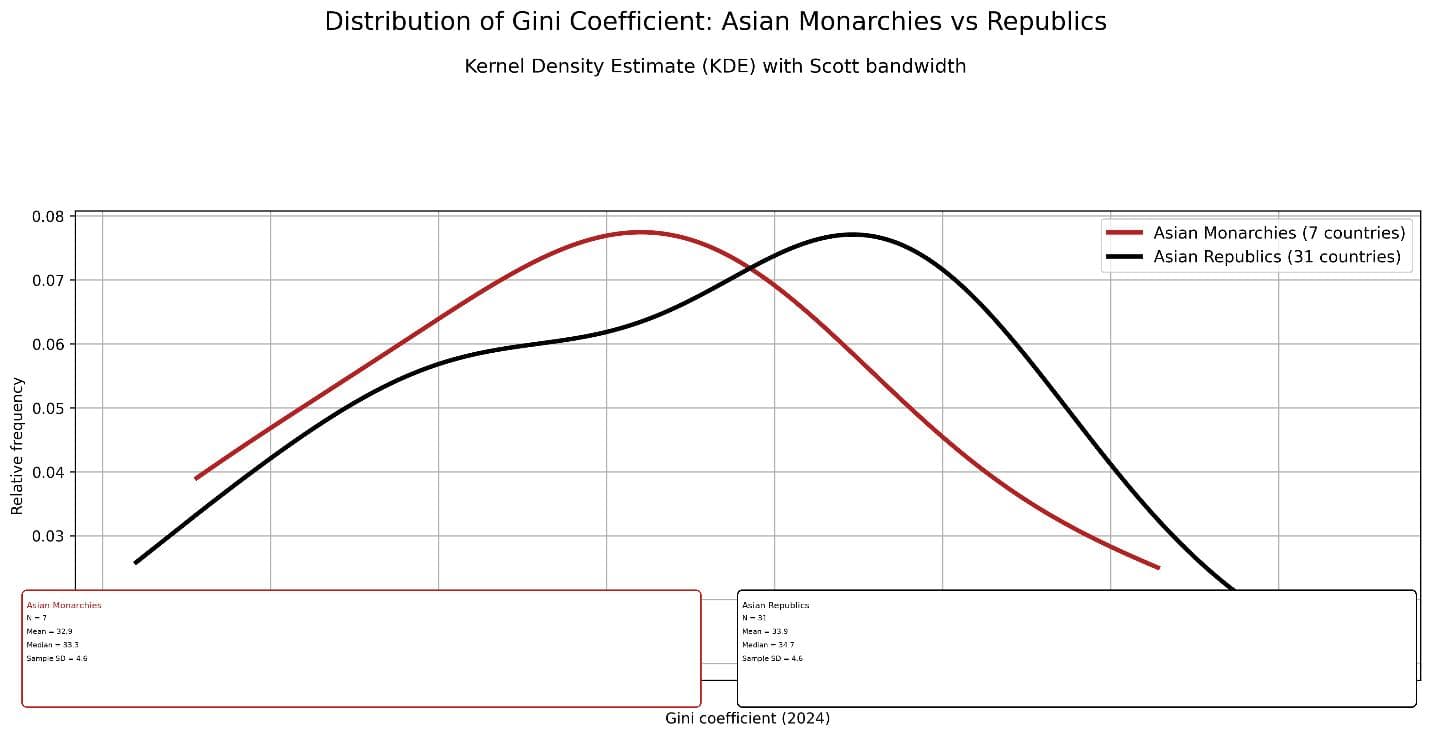
The distribution of the Gini Index across Asian countries shows that monarchies and republics exhibit very similar patterns, with substantial overlap between their curves.
The mean Gini Index is 32.9 for Asian monarchies and 33.9 for Asian republics, while the corresponding medians are 33.3 and 34.7, respectively. Since a lower Gini Index indicates lower inequality, the descriptive statistics suggest that Asian monarchies have slightly lower Gini values.
However, the close proximity and substantial overlap of the two distributions indicate that the observed difference is limited. Statistical tests are therefore necessary to determine whether this small difference is statistically meaningful or simply reflects sampling variation.
Comparison of the Gini Index: Monarchies and Republics in Europe
Europe is one of the most suitable regions for an intra-regional comparison of government systems because its countries are relatively similar in terms of development levels, historical background, and economic structures. In this section, the Gini Index of European countries is compared between monarchies and republics.
1. Descriptive Statistics
Group |
Countries (n) |
Mean |
Median |
Population SD |
European monarchies |
8 |
29.70 |
29.60 |
2.98 |
European republics |
33 |
31.11 |
31.80 |
3.86 |
Interpretation of the Descriptive Statistics
The mean Gini Index is 29.70 among European monarchies and 31.11 among European republics.
Since a lower Gini Index indicates lower inequality, the descriptive statistics suggest that European monarchies in this sample have, on average, lower Gini values.
The medians point in the same direction:
- Monarchies: 29.60
- Republics: 31.80
Thus, at the descriptive level, European monarchies exhibit somewhat lower inequality. However, the difference between the two groups is relatively modest, and statistical tests are required to determine whether it is statistically significant.
2. Welch’s t-test for the Difference in Means
The hypotheses were defined as follows:
Null hypothesis (H₀): The mean Gini Index is equal in European monarchies and republics.
Alternative hypothesis (H₁): The mean Gini Index differs between the two groups.
Results of Welch’s t-test
Statistic |
Value |
Mean — European monarchies |
29.70 |
Mean — European republics |
31.11 |
Mean difference |
−1.41 |
t-statistic |
−1.067 |
Approximate degrees of freedom |
12.72 |
p-value |
0.306 |
Interpretation of Welch’s t-test
The p-value (p = 0.306) is greater than the conventional 5% significance level. The null hypothesis is therefore not rejected.
Although the mean Gini Index is lower among European monarchies, the difference in means is not statistically significant.
In other words, the available data do not provide sufficient statistical evidence to conclude that European monarchies and republics differ in their mean level of inequality.
3. Mann–Whitney U Test
To examine the overall distributions without assuming normality, the Mann–Whitney U test was also conducted.
The hypotheses were defined as follows:
Null hypothesis (H₀): There is no significant difference in the rank distribution of Gini values between the two groups.
Alternative hypothesis (H₁): The rank distributions of Gini values differ between the two groups.
Results of the Mann–Whitney U Test
Statistic |
Value |
U-statistic |
99 |
p-value |
0.285 |
Interpretation of the Mann–Whitney U Test
The p-value (p = 0.285) is greater than the 5% significance level. The null hypothesis is therefore not rejected.
This test likewise provides no statistically significant evidence of a rank-based difference in Gini values between European monarchies and republics.
Conclusion
For the available European Gini Index data:
Group |
Mean Gini Index |
Monarchies |
29.70 |
Republics |
31.11 |
European monarchies have a lower mean Gini Index and therefore exhibit lower inequality at the descriptive level. However, neither statistical test identifies the difference as significant:
- Welch’s t-test: p = 0.306
- Mann–Whitney U test: p = 0.285
Therefore, among the European countries for which data are available, monarchies have a lower average Gini Index than republics, but the difference is not statistically significant. The available evidence is therefore insufficient to establish a systematic difference in inequality between the two groups.
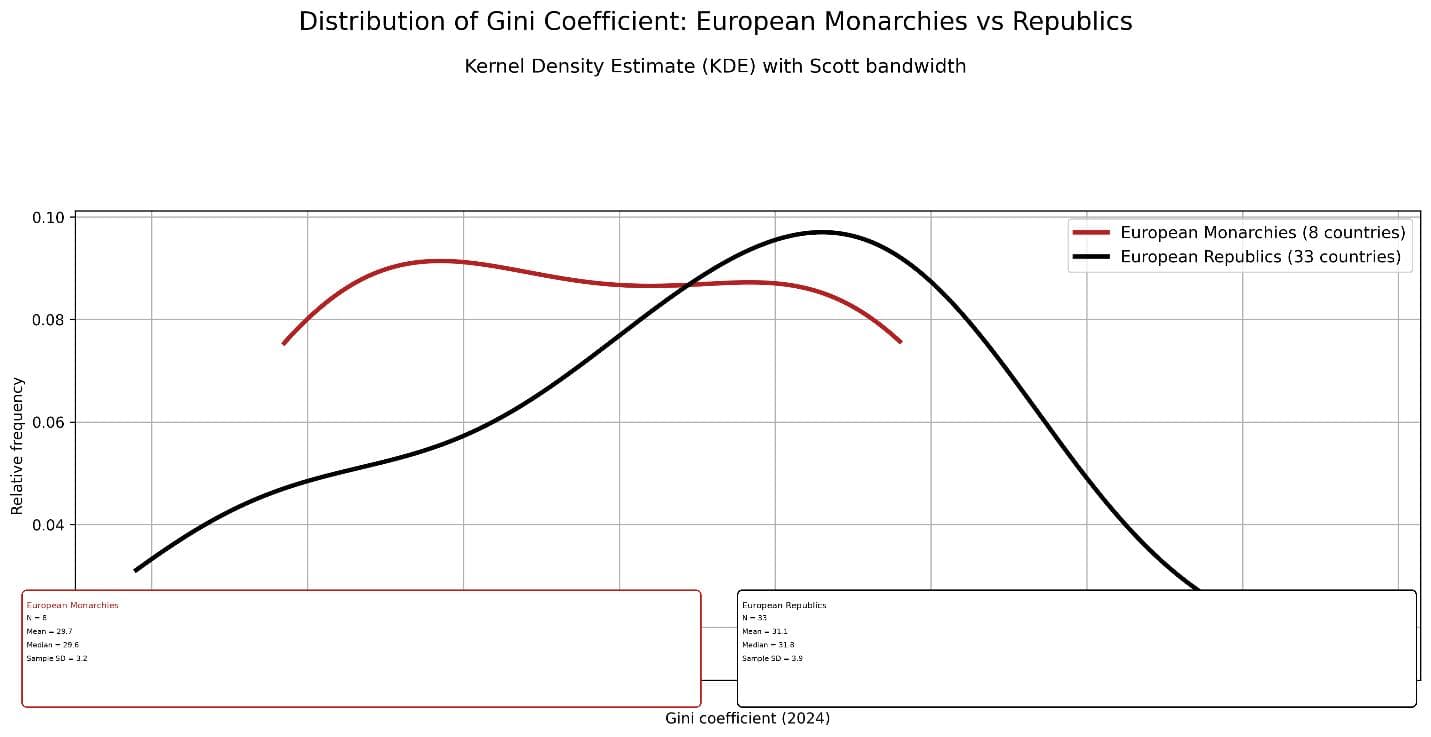
The distribution of the Gini Index across European countries shows that the curve for monarchies is slightly shifted toward lower values. Since a lower Gini Index indicates lower income inequality, this pattern suggests that European monarchies in this dataset tend, on average, to exhibit lower levels of inequality.
The mean Gini Index is 29.7 for European monarchies and 31.1 for European republics. The medians are 29.6 and 31.8, respectively. Thus, the observed difference is not confined to a few particular observations but is also visible in the central values of the two distributions.
Despite this shift, the two curves overlap substantially, indicating that the difference between the groups is relatively modest. Whether the observed difference is statistically significant should therefore be assessed using the statistical tests presented in the analysis.
Comparison of the Gini Index Between European Monarchies and European Republics That Have Never Been Communist
To examine whether a history of communist rule might affect the results of the comparison between European monarchies and republics, European republics with a history of communist government were excluded from the sample in this robustness test. This left 8 European monarchies to be compared with 12 European republics that had never experienced communist rule.
Descriptive Statistics
Form of Government |
Number of Countries |
Mean |
Median |
Sample SD |
European Monarchies |
8 |
29.70 |
29.60 |
3.19 |
European Republics (No History of Communist Rule) |
12 |
32.06 |
32.60 |
2.59 |
After excluding republics with a history of communist rule, the difference between the two groups became larger than in the comparison of Europe as a whole. The mean Gini Index of republics with no history of communist rule is approximately 2.36 points higher than that of the monarchies. The medians point in the same direction: 32.60 for the republics compared with 29.60 for the monarchies.
Since a lower Gini Index indicates lower inequality, the descriptive statistics suggest that, within this subsample, European monarchies exhibit a more equal distribution of income or consumption.
Statistical Significance Test
Welch’s t-test was used to compare the means of the two groups. The result was:
t = −1.74, p = 0.105
Therefore, at the 0.05 significance level, the null hypothesis of equal means cannot be rejected, and there is insufficient statistical evidence to conclude that the mean Gini Index differs significantly between the two groups.
Nevertheless, the p-value is lower than in the previous comparison that included all European republics (p ≈ 0.31). This change is consistent with the larger descriptive difference between the two groups, although it should not, by itself, be interpreted as independent evidence of a genuine difference.
Effect Size
The standardized effect size in this comparison is:
Hedges’ g ≈ −0.80
The negative sign indicates that the mean Gini Index is lower among the monarchies and should not be interpreted as having any independent normative meaning. The absolute magnitude of the effect, approximately 0.80, falls within the range conventionally regarded as a large effect.
This distinction is important because it indicates that, although Welch’s test does not reach statistical significance at the 5 percent level, the observed standardized difference is not small. Given the limited number of countries in the two groups, however, the estimated effect size should also be interpreted with caution.
Conclusion
This robustness test produces a noteworthy result. If the lower Gini Index observed among European monarchies in the initial comparison were primarily attributable to the presence of republics with a communist past, one would expect the difference between the two groups to decrease after those countries were excluded. In the available data, however, the opposite occurs: after excluding republics with a history of communist rule, the difference in the mean Gini Index between monarchies and republics becomes larger.
Therefore, the descriptively lower Gini Index of European monarchies cannot be attributed to the inclusion of post-communist republics in the comparison group. Within this subsample, both the mean and median Gini Index remain lower among monarchies, and the estimated effect size is also large.
However, Welch’s test does not reach statistical significance at the conventional 5 percent level (p = 0.105). Accordingly, this result should be interpreted as noteworthy descriptive evidence and a useful robustness check, rather than conclusive statistical evidence of a difference between the two groups.
Comparison of the Gini Index Between Monarchies and Republics in Africa, the Americas, and Oceania
Africa
In Africa, the difference in the mean Gini Index between monarchies and republics is small, and Welch’s test likewise does not indicate a statistically significant difference between the two groups. The effect size is also small. Therefore, based on the available data, there is insufficient statistical evidence of a systematic difference in inequality between African monarchies and republics.
The Americas
In the Americas, the comparison between Commonwealth realms and republics produces a similar result. Although the mean Gini Index differs slightly between the two groups, the difference is not statistically significant, and the effect size remains small. Therefore, the available data provide insufficient evidence of a systematic difference in inequality between Commonwealth realms and republics in the Americas.
Oceania
In Oceania, the comparison of Commonwealth realms and monarchies with available data against republics likewise reveals no statistically significant difference. In addition, the limited number of countries with available data in the groups being compared increases the uncertainty of the estimates. Accordingly, the available data do not provide sufficient evidence to establish a systematic difference in inequality across forms of government in this region.
Comparison of the Gini Index Between Monarchies and Republics in the Middle East
Descriptive Statistics
In this section, 3 Middle Eastern monarchies and 10 Middle Eastern republics for which Gini Index data were available from the World Bank were compared.
Form of Government |
Number of Countries |
Mean |
Median |
Sample SD |
Monarchies |
3 |
31.73 |
33.70 |
4.67 |
Republics |
10 |
34.30 |
35.70 |
5.18 |
Descriptively, the mean Gini Index in Middle Eastern monarchies is approximately 2.6 points lower than in the republics. Since lower values of this index indicate lower inequality, the observed difference points toward lower inequality among the monarchies. The median is also lower among the monarchies, while the dispersion of the data is relatively similar in the two groups.
Interpretation of the Results
1. Magnitude of the Descriptive Difference
The corrected data show that the mean Gini Index of Middle Eastern monarchies is not higher, but lower than that of the region’s republics. The difference between the two groups is approximately 2.6 points, indicating that the monarchies with available data have, on average, lower Gini Index values.
The medians point in the same direction: 33.70 for monarchies compared with 35.70 for republics. However, only three monarchies in the region have data included in this analysis. Estimates for this group are therefore subject to considerable uncertainty and should be interpreted with caution.
2. Statistical Significance Test
Welch’s test showed that the difference between the group means is not statistically significant:
t = −0.814, p = 0.466
Therefore, the null hypothesis of equal means cannot be rejected at the 0.05 significance level. In other words, although the monarchies with available data have a lower mean Gini Index, the available statistical evidence is insufficient to conclude that the mean Gini Index differs significantly between the two groups.
This result does not establish that the two groups are equal. It simply indicates that, given the available data, the null hypothesis of equal means cannot be rejected at the conventional significance level.
3. Effect Size
The standardized effect size in this comparison is approximately:
Hedges’ g ≈ −0.50
The negative sign indicates that the mean Gini Index is lower among the monarchies and carries no independent normative meaning. The absolute magnitude of the effect, approximately 0.50, falls within the range conventionally regarded as a medium effect.
Thus, although Welch’s test does not identify a statistically significant difference, the observed standardized difference is not negligible. However, because only three monarchies are included in this comparison, the effect-size estimate itself is subject to considerable uncertainty and should be interpreted cautiously.
Conclusion
In the Middle East, monarchies with available data have both a lower mean and a lower median Gini Index than republics, while the observed effect size is in the medium range. Nevertheless, Welch’s test does not find the difference between the group means to be statistically significant (p = 0.466), and the very limited number of monarchies with available data increases the uncertainty surrounding the estimate.
Therefore, unlike the much clearer findings for GDP per capita and GDP per capita at purchasing power parity, the Gini Index results for the Middle East do not provide sufficient statistical evidence of a systematic difference between the two forms of government. At the same time, the direction of the descriptive statistics is also inconsistent with the proposition that monarchies exhibit greater inequality: in the available data, both the mean and median Gini Index are lower among the monarchies.
This final point is particularly relevant to the broader analysis: the Gini data do not indicate that the economic advantage observed for monarchies in the preceding indicators has been accompanied by greater income inequality.