

Monarchy & Republic in the Laboratory of History by N. Fakhr - HTML preview
Download the book in PDF, ePub for a complete version.
Gini Index
So far, the economic indicators examined in this study have shown that monarchies have, on average, performed better than republics. However, this raises an important question: Is greater wealth alone sufficient to evaluate the success of a system of government? If the wealth generated in a country is concentrated largely in the hands of a small segment of society, while the majority of citizens receive little benefit from it, can such economic performance still be regarded as successful?
To address this question, we must examine not only how much wealth is produced, but also how that wealth is distributed. One of the most widely used measures of economic inequality is the Gini index. It measures inequality in the distribution of income or, in some countries, consumption. A lower Gini value indicates a more equal distribution, whereas a higher value indicates greater inequality. In the World Bank's scale, a value of 0 represents perfect equality and a value of 100 represents perfect inequality.
This direction should be kept in mind throughout the analyses that follow. Unlike GDP per capita and purchasing power per capita, a higher value of the Gini index does not represent better performance; in terms of economic equality, lower values indicate more equal outcomes.
At the same time, a low Gini index does not necessarily imply better overall economic performance, nor is a high Gini index by itself sufficient grounds for a negative assessment of an economy. The relationship between economic growth and inequality is complex and can vary across countries and periods. Rapid economic transformation, for example, may be accompanied by changes in inequality as different groups benefit from new economic opportunities at different rates. The Gini index should therefore be interpreted alongside other measures of welfare and development rather than in isolation. The World Bank likewise cautions that the Gini measures relative inequality and that differences in underlying income and consumption surveys can affect cross-country comparability.
Accordingly, the purpose of this section is not simply to determine which form of government has the lower Gini index. Rather, it is to examine whether the higher levels of economic welfare observed in the countries of the two groups are also associated with a more equal distribution of income or consumption. This comparison brings us one step closer to evaluating another fundamental objective of government: economic justice.
The data used in this chapter were obtained from the World Bank and refer to 2024 or the nearest available year for each country (Appendix RDS-C01). Countries for which no data were available were excluded from the analysis. The results presented in this chapter are therefore based on the most recent available observations for countries with sufficient data.
Global Comparison of the Gini Index: Monarchies and Republics
Indicator: Gini Index
Data year: 2024 or the nearest available year
Source: World Bank
The Gini Index is one of the most widely used measures of inequality in the distribution of income or consumption. Its value typically ranges from 0 to 100: lower values indicate a more equal distribution and less inequality, while higher values indicate greater inequality. Therefore, unlike indicators such as GDP per capita and purchasing power per capita, a lower value is preferable from the standpoint of economic equality.
In this section, the Gini Index is compared between the world’s monarchies and republics. In addition to descriptive statistics, two statistical tests are used: Welch’s t-test to compare group means and the Mann–Whitney U test to compare the rank distributions of the data. Hedges’ g is also calculated to measure the standardized magnitude of the difference between the two groups.
1. Descriptive Statistics
Group |
Countries (n) |
Mean |
Median |
Sample Standard Deviation |
Monarchies |
19 |
33.35 |
32.40 |
7.34 |
Republics |
143 |
36.61 |
35.90 |
7.04 |
Interpretation of the Descriptive Statistics
The mean Gini Index is 33.35 among monarchies and 36.61 among republics. Since a lower Gini value indicates less inequality, monarchies in this dataset show, on average, a lower level of inequality.
The medians point in the same direction: 32.40 for monarchies and 35.90 for republics. Thus, both the mean and the central value of the distribution are lower in the monarchy group.
The sample standard deviations are also very similar: 7.34 among monarchies and 7.04 among republics. The observed difference between the groups is therefore not accompanied by a substantial difference in overall dispersion.
Descriptive statistics alone, however, cannot determine whether the observed difference is statistically significant. Inferential tests are therefore required.
2. Welch’s t-test for the Difference in Means
The hypotheses were defined as follows:
Null hypothesis (H₀): The mean Gini Index is equal in monarchies and republics.
Alternative hypothesis (H₁): The mean Gini Index differs between the two groups.
Results of Welch’s t-test
Statistic |
Value |
Mean — Monarchies |
33.35 |
Mean — Republics |
36.61 |
Mean difference |
−3.25 |
t-statistic |
−1.824 |
Welch’s adjusted degrees of freedom |
22.63 |
Two-tailed p-value |
0.081 |
95% confidence interval for the mean difference |
−6.95 to 0.44 |
Hedges’ g |
−0.46 |
Effect size |
Small to moderate; close to moderate |
Interpretation of Welch’s t-test
The p-value (p ≈ 0.081) is above the pre-specified significance level of 0.05. The null hypothesis is therefore not rejected at the 5% level.
In other words, although the mean Gini Index is approximately 3.25 points lower among monarchies than among republics, Welch’s test does not provide sufficient evidence to conclude that the group means differ significantly at the conventional 5% level.
The 95% confidence interval for the mean difference extends from approximately −6.95 to 0.44. Because this interval includes zero, it is consistent with the non-significant result of the Welch test.
This does not establish that the two group means are equal. It simply means that, given the available data and the chosen significance threshold, there is insufficient statistical evidence to reject the hypothesis of equal means.
Effect Size
To assess the magnitude of the observed difference, Hedges’ g was also calculated. Its value is approximately −0.46. The negative sign indicates that the mean Gini Index is lower among monarchies than among republics; it should not be interpreted as a negative effect in a value-laden sense.
In absolute terms, |g| ≈ 0.46, indicating a small-to-moderate effect, close to moderate. Thus, even though Welch’s test does not reach statistical significance at the 5% level, the standardized magnitude of the observed difference is not negligible.
This distinction is important: the p-value reflects the strength of statistical evidence against the null hypothesis, whereas the effect size describes the magnitude of the observed difference.
3. Mann–Whitney U Test
To examine the difference between the two groups from another perspective, the non-parametric Mann–Whitney U test was also conducted. This test is based on the ranks of the observations and does not require the data to follow a normal distribution.
The hypotheses were defined as follows:
Null hypothesis (H₀): There is no significant difference in the rank distribution of Gini values between the two groups.
Alternative hypothesis (H₁): The rank distributions of Gini values differ between the two groups.
Results of the Mann–Whitney U Test
Statistic |
Value |
U-statistic |
922.5 |
Two-tailed p-value |
0.023 |
Interpretation of the Mann–Whitney U Test
The p-value (p ≈ 0.023) is below the 0.05 significance level. The null hypothesis is therefore rejected.
This result indicates that the Gini values of the two groups differ significantly in their rank distributions. Since both the mean and median Gini Index are lower among monarchies, the observed direction of the difference is toward lower Gini values in the monarchy group.
At first glance, the Mann–Whitney result may appear inconsistent with the Welch result, but there is no contradiction. Welch’s test specifically evaluates differences in means, whereas the Mann–Whitney test is based on the ranks of the observations and captures a different aspect of the difference between the groups. It is therefore possible for one test to reach statistical significance while the other does not.
Without additional assumptions about the shapes of the two distributions, the Mann–Whitney test should also not be interpreted simply as a test of differences in medians.
Which Test Is More Appropriate for These Data?
In this study, Welch’s t-test and the Mann–Whitney U test examine different aspects of the comparison between monarchies and republics and should not be treated as substitutes for one another.
Welch’s test specifically addresses whether the mean Gini Index differs between the two groups. It is appropriate for groups with unequal sample sizes and unequal variances. The difference in sample size—19 monarchies versus 143 republics—is therefore not, by itself, a reason to regard Welch’s test as inappropriate.
The Mann–Whitney test, by contrast, is based on ranks and examines whether values in one group tend systematically to occupy higher or lower ranks than those in the other. Because it does not depend on an assumption of normality, it provides complementary information about the difference between the groups.
The most appropriate approach in this study is therefore to report both tests, rather than selecting one according to which produces a statistically significant result.
Conclusion
In the available data, the mean Gini Index is 33.35 among monarchies and 36.61 among republics, while the corresponding medians are 32.40 and 35.90. Both descriptive measures therefore point toward lower inequality in the monarchy group.
The standardized effect size is approximately 0.46 in absolute magnitude, indicating a small-to-moderate difference, close to moderate.
However, the two inferential tests do not produce identical results. Welch’s t-test, which evaluates differences in means, does not reach statistical significance at the 5% level (p ≈ 0.081), whereas the Mann–Whitney U test indicates a statistically significant rank-based difference between the two groups (p ≈ 0.023).
The most cautious conclusion, therefore, is that monarchies in the available data have lower Gini values than republics in both mean and median terms, and the standardized magnitude of the difference is not negligible. The Mann–Whitney test provides statistically significant evidence of a rank-based difference between the groups, while the evidence for a difference in means does not reach the conventional 5% significance threshold in Welch’s test.
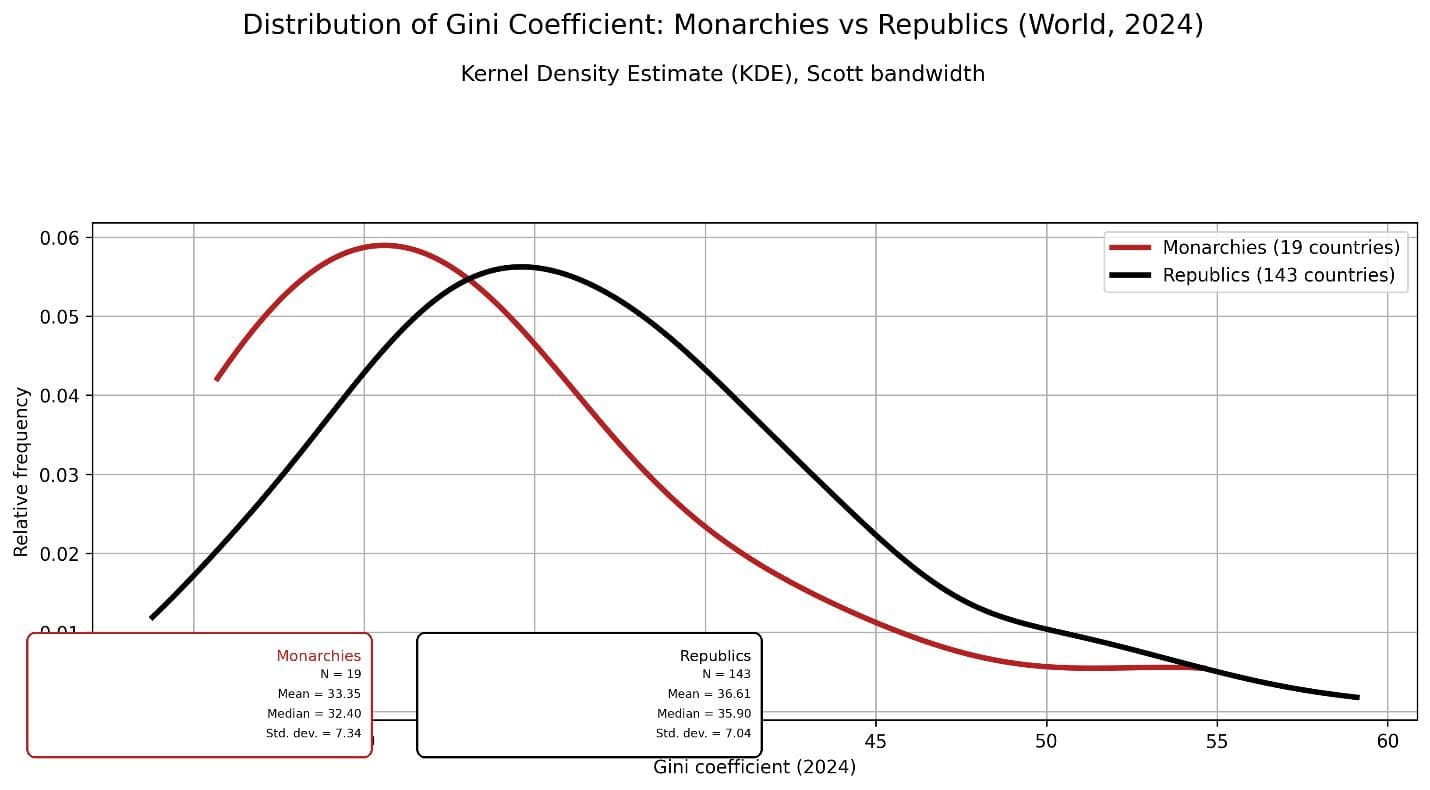
The distribution of the Gini Index across countries shows that the curve for monarchies is shifted slightly toward lower values relative to republics. Since a lower Gini Index indicates lower income inequality, this shift suggests that, in this dataset, monarchies tend to exhibit lower levels of income inequality on average.
The mean Gini Index is 33.35 for monarchies and 36.61 for republics. The corresponding medians are 32.40 and 35.90, respectively. Thus, the observed difference is not confined to a few particular observations but is also visible in the central tendency of the distributions.
Nevertheless, the two curves overlap substantially, indicating considerable variation within both groups. The distributional pattern alone therefore cannot establish either statistical significance or a causal relationship between government type and inequality. The statistical tests reported in the accompanying analysis are required to assess the significance of the observed differences.
Comparison of the Gini Index: Constitutional vs. Semi-Constitutional and Absolute Monarchies Worldwide
Following the overall comparison between monarchies and republics, a comparison within the monarchy group allows us to examine whether differences in monarchical structure are associated with differences in the level of income inequality.
For this purpose, monarchies were divided into two groups:
- Constitutional monarchies
- Semi-constitutional and absolute monarchies
Two statistical tests were used to examine differences between the groups:
- Welch’s t-test to compare the means
- Mann–Whitney U test to compare the distributions
1. Descriptive Statistics
Group |
Countries (n) |
Mean |
Median |
Population SD |
Constitutional monarchies |
13 |
32.50 |
32.40 |
5.24 |
Semi-constitutional and absolute monarchies |
6 |
35.20 |
31.80 |
9.86 |
Interpretation of the Descriptive Statistics
The mean Gini Index is 32.50 among constitutional monarchies and 35.20 among semi-constitutional and absolute monarchies.
Since a lower Gini Index indicates lower inequality, the descriptive statistics suggest that, in this sample, constitutional monarchies have a lower average Gini Index, indicating somewhat lower income inequality.
However, the difference between the two groups is relatively modest, and dispersion is substantially greater among semi-constitutional and absolute monarchies. Statistical tests are therefore required to determine whether the observed difference is sufficiently robust to be distinguished from sampling variation.
2. Welch’s t-test for the Difference in Means
The hypotheses were defined as follows:
Null hypothesis (H₀): The mean Gini Index is equal in the two types of monarchy.
Alternative hypothesis (H₁): The mean Gini Index differs between the two types of monarchy.
Results of Welch’s t-test
Statistic |
Value |
Mean — Constitutional monarchies |
32.50 |
Mean — Semi-constitutional and absolute monarchies |
35.20 |
Mean difference |
−2.70 |
t-statistic |
−0.579 |
Approximate degrees of freedom |
6.21 |
p-value |
0.583 |
Interpretation of Welch’s t-test
The p-value (p = 0.583) is substantially greater than the conventional 5% significance level. The null hypothesis is therefore not rejected.
Although the mean Gini Index is lower among constitutional monarchies, the observed difference is not statistically significant in this dataset.
In other words, the available data do not provide sufficient statistical evidence to conclude that the two types of monarchy differ in their mean level of inequality.
3. Mann–Whitney U Test
To examine the distributions without assuming normality, the Mann–Whitney U test was also conducted.
The hypotheses were defined as follows:
Null hypothesis (H₀): There is no significant difference in the rank distribution of Gini values between the two groups.
Alternative hypothesis (H₁): The rank distributions of Gini values differ between the two groups.
Results of the Mann–Whitney U Test
Statistic |
Value |
U-statistic |
36 |
p-value |
0.831 |
Interpretation of the Mann–Whitney U Test
The p-value (p = 0.831) is substantially greater than the 5% significance level. The null hypothesis is therefore not rejected.
This test likewise provides no statistically significant evidence of a rank-based difference in Gini values between the two types of monarchy.
Conclusion
For the Gini Index data used in this study:
Group |
Mean Gini Index |
Constitutional monarchies |
32.50 |
Semi-constitutional and absolute monarchies |
35.20 |
Constitutional monarchies have a lower mean Gini Index in this sample. However, neither statistical test identifies a significant difference:
- Welch’s t-test: p = 0.583
- Mann–Whitney U test: p = 0.831
Therefore, in the available Gini Index data, there is no statistically significant evidence that inequality differs between constitutional monarchies and semi-constitutional or absolute monarchies. Although the mean Gini Index is lower among constitutional monarchies, the observed difference is not sufficiently robust to distinguish the two groups statistically.
Comparison of the Gini Index: Commonwealth Realms and Republics Worldwide
Following the overall comparison between monarchies and republics, it is also useful to examine the Commonwealth Realms separately. These countries share a historical and constitutional connection to the British monarchy, while differing considerably in their economic and social structures.
In this section, the Gini Index of the Commonwealth Realms is compared with that of the world’s republics to determine whether the two groups differ in their levels of income inequality.
1. Descriptive Statistics
Group |
Countries (n) |
Mean |
Median |
Population SD |
Commonwealth Realms |
9 |
38.97 |
39.90 |
4.28 |
Republics |
143 |
36.61 |
35.90 |
7.02 |
Interpretation of the Descriptive Statistics
The mean Gini Index is 38.97 among the Commonwealth Realms and 36.61 among the world’s republics.
Since a lower Gini Index indicates lower inequality, the descriptive statistics suggest that, in this dataset, the Commonwealth Realms have a somewhat higher average Gini Index than republics, indicating somewhat greater inequality.
The medians point in the same direction:
- Commonwealth Realms: 39.90
- Republics: 35.90
Thus, unlike the overall comparison between monarchies and republics, the Commonwealth Realms in this comparison are not associated with lower Gini values.
However, the number of Commonwealth Realms for which data are available is small. Statistical tests are therefore required to determine whether the observed difference is sufficiently robust to distinguish the two groups statistically.
2. Welch’s t-test for the Difference in Means
The hypotheses were defined as follows:
Null hypothesis (H₀): The mean Gini Index is equal in the Commonwealth Realms and republics.
Alternative hypothesis (H₁): The mean Gini Index differs between the two groups.
Results of Welch’s t-test
Statistic |
Value |
Mean — Commonwealth Realms |
38.97 |
Mean — Republics |
36.61 |
Mean difference |
2.36 |
t-statistic |
1.550 |
Approximate degrees of freedom |
11.04 |
p-value |
0.149 |
Interpretation of Welch’s t-test
The p-value (p = 0.149) is greater than the conventional 5% significance level. The null hypothesis is therefore not rejected.
Although the mean Gini Index is higher among the Commonwealth Realms, the difference in means is not statistically significant.
In other words, the available data do not provide sufficient statistical evidence to conclude that mean inequality differs between the Commonwealth Realms and the world’s republics.
3. Mann–Whitney U Test
To examine the difference between the two groups without assuming normality, the Mann–Whitney U test was also conducted.
The hypotheses were defined as follows:
Null hypothesis (H₀): There is no significant difference in the rank distribution of Gini values between the two groups.
Alternative hypothesis (H₁): The rank distributions of Gini values differ between the two groups.
Results of the Mann–Whitney U Test
Statistic |
Value |
U-statistic |
830 |
p-value |
0.146 |
Interpretation of the Mann–Whitney U Test
The p-value (p = 0.146) is above the 5% significance level. The null hypothesis is therefore not rejected.
This test likewise provides no statistically significant evidence of a rank-based difference in Gini values between the Commonwealth Realms and the world’s republics.
Conclusion
For the Gini Index data used in this study:
Group |
Mean Gini Index |
Commonwealth Realms |
38.97 |
Republics |
36.61 |
The Commonwealth Realms have a higher mean Gini Index in this sample, indicating greater inequality on average. However, neither statistical test identifies a significant difference:
- Welch’s t-test: p = 0.149
- Mann–Whitney U test: p = 0.146
Therefore, the available Gini Index data provide no statistically significant evidence of a difference in inequality between the Commonwealth Realms and the world’s republics. Although both the mean and median Gini values are higher among the Commonwealth Realms, the observed difference cannot be statistically distinguished from sampling variation in this dataset.
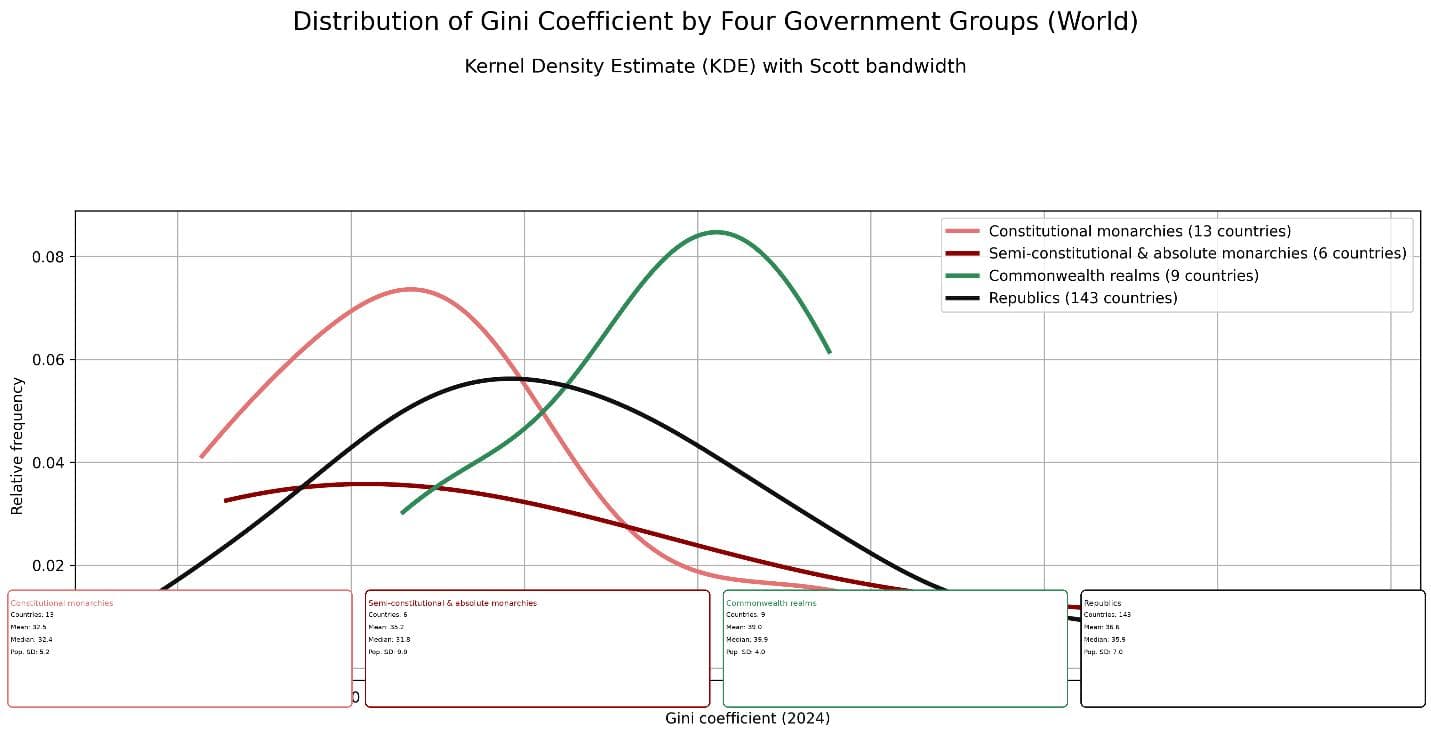
The distribution of the Gini Index across the four government groups shows that patterns of inequality are not identical across them. Since lower Gini values indicate lower inequality, constitutional monarchies, with a mean of 32.5, have the lowest average among the four groups, whereas the Commonwealth Realms, with a mean of 39.0, have the highest.
Semi-constitutional and absolute monarchies, with a mean of 35.2, and republics, with a mean of 36.6, occupy intermediate positions. The location of the curves also indicates that the distribution for constitutional monarchies is more concentrated at lower Gini values, whereas the distribution for the Commonwealth Realms is shifted toward higher values.
Despite these observed differences, the substantial overlap among the four curves indicates that statistical comparisons are necessary to determine whether the differences between the groups are significant. The shapes of the distributions alone do not provide sufficient grounds for definitive conclusions.