

Monarchy & Republic in the Laboratory of History by N. Fakhr - HTML preview
Download the book in PDF, ePub for a complete version.
Comparison of Purchasing Power per Capita between Monarchies and Republics across Continents and in the Middle East
Following the global analysis, a regional comparison can help determine whether the pattern observed worldwide is also replicated within individual geographic regions. Asia, with its considerable economic and political diversity, is one of the most important regions for such a comparison.
Comparison of Purchasing Power per Capita between Monarchies and Republics in Asia
1. Descriptive Statistics
Group |
Countries (n) |
Mean |
Median |
Population SD |
Asian Monarchies |
13 |
51,615.02 |
52,726.20 |
33,162.82 |
Asian Republics |
31 |
21,911.26 |
14,664.60 |
26,357.24 |
Interpretation of the Descriptive Statistics
The 2023 data show that mean purchasing power per capita was approximately 51.6 thousand international dollars in Asian monarchies, compared with approximately 21.9 thousand international dollars in Asian republics.
Thus, in this sample, mean purchasing power per capita in Asian monarchies was approximately 2.4 times that of Asian republics.
The medians reveal an even more pronounced difference:
- Monarchies: 52,726 international dollars
- Republics: 14,665 international dollars
This indicates that the observed difference is not merely driven by a small number of countries with exceptionally high values; it is also evident at the center of the distributions.
Nevertheless, both groups exhibit substantial dispersion. Inferential statistical tests were therefore conducted to determine whether the observed difference is statistically significant.
2. Welch’s t-test for the Difference in Means
The hypotheses were defined as follows:
Null hypothesis (H₀):
Mean purchasing power per capita is equal in Asian monarchies and Asian republics.
Alternative hypothesis (H₁):
Mean purchasing power per capita differs between the two groups.
Results of Welch’s t-test
Statistic |
Value |
Mean — Asian monarchies |
51,615.02 |
Mean — Asian republics |
21,911.26 |
Mean difference |
29,703.76 |
t-statistic |
2.772 |
Approximate degrees of freedom |
18.361 |
p-value |
0.0124 |
Interpretation of Welch’s t-test
The p-value (p = 0.0124) is below the conventional significance level of 0.05. The null hypothesis is therefore rejected.
This result indicates that the difference in mean purchasing power per capita between Asian monarchies and republics is statistically significant in this dataset.
In other words, under the null hypothesis of equal population means, an observed difference at least this extreme would be relatively unlikely.
3. Mann–Whitney U Test
Because economic data may depart substantially from a normal distribution, the Mann–Whitney U test was also conducted to examine whether the two groups differ more generally in the distribution of purchasing power per capita.
The hypotheses were defined as follows:
Null hypothesis (H₀):
There is no systematic difference between the distributions of purchasing power per capita in the two groups.
Alternative hypothesis (H₁):
The distributions of purchasing power per capita differ between the two groups.
Results of the Mann–Whitney U Test
Statistic |
Value |
U-statistic |
319 |
p-value |
0.00262 |
Interpretation of the Mann–Whitney U Test
The p-value (p = 0.00262) is below the 0.05 significance threshold. The null hypothesis is therefore rejected.
This test also indicates a statistically significant difference between the distributions of purchasing power per capita in Asian monarchies and republics.
The agreement between the two independent tests strengthens the statistical evidence: Welch’s test identifies a significant difference in the means, while the Mann–Whitney test indicates a broader systematic difference in the distributions.
Conclusion
The 2023 data for Asia show:
Group |
Mean Purchasing Power per Capita |
Monarchies |
51,615 international dollars |
Republics |
21,911 international dollars |
Both statistical tests identify a significant difference:
- Welch’s t-test: p = 0.0124
- Mann–Whitney U test: p = 0.00262
Thus, among the Asian countries included in this analysis, monarchies had substantially higher purchasing power per capita than republics, and the observed difference is statistically significant.
This finding is consistent with the global comparison. Its persistence within Asia is particularly noteworthy because the analysis restricts the comparison to a single geographic region, although substantial historical, cultural, and economic heterogeneity remains within Asia itself. As throughout this study, however, these findings establish a statistical association rather than a causal relationship.
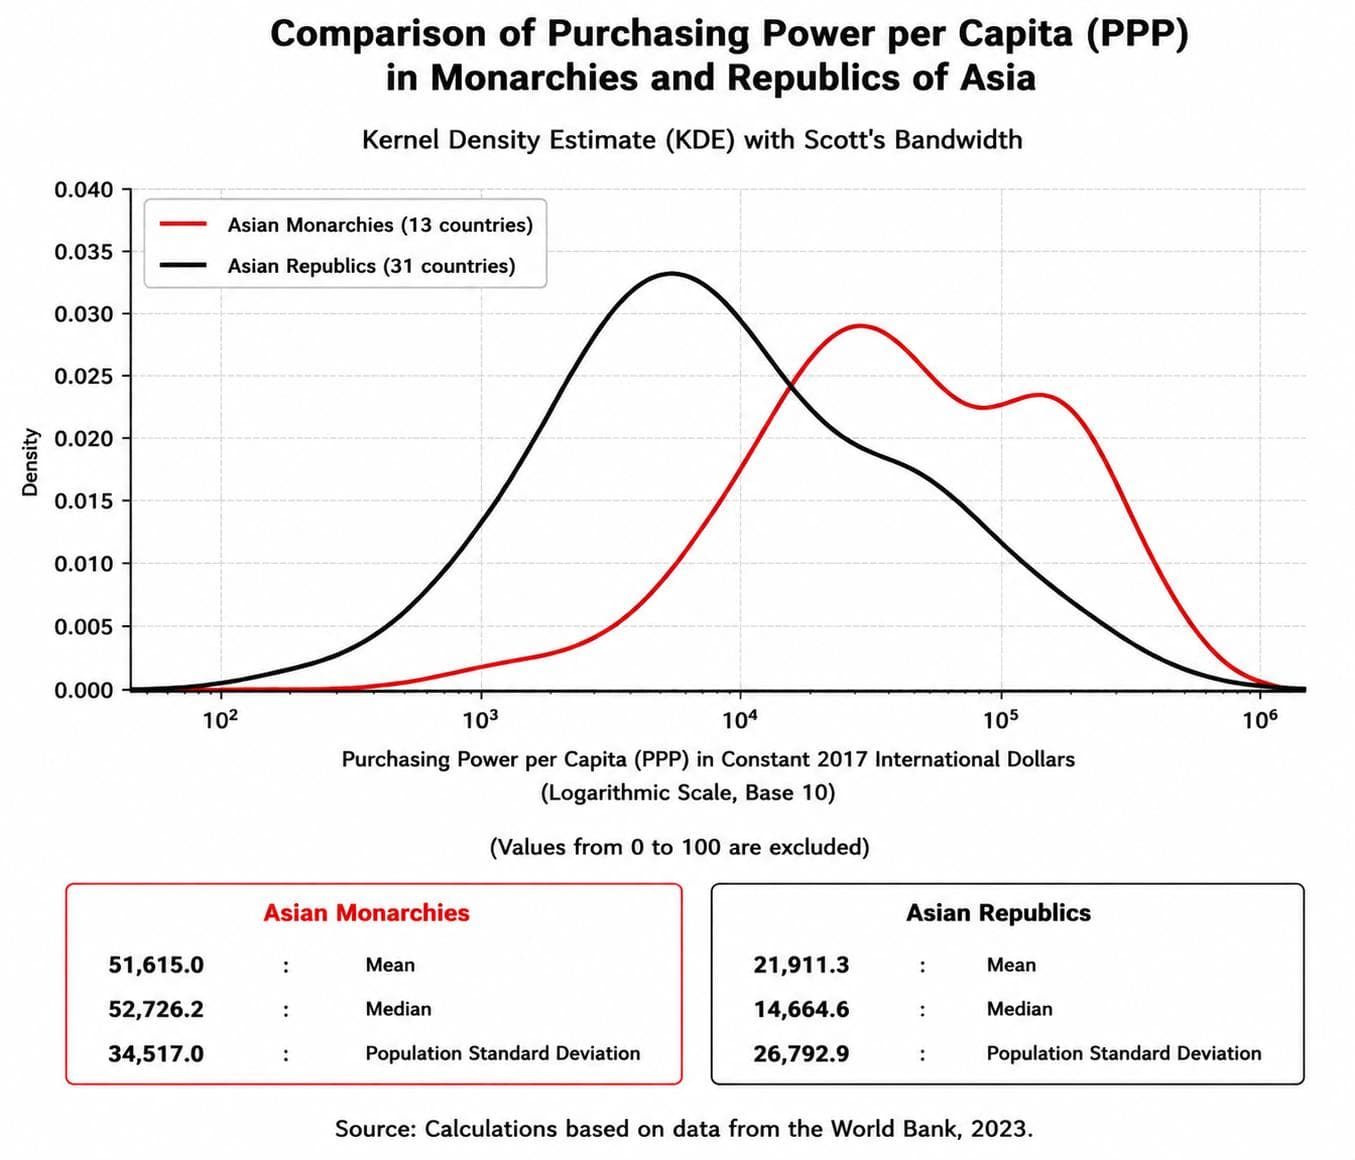
The distribution of purchasing power per capita across Asian countries shows that the curve for monarchies is shifted toward higher values relative to that of republics. Mean purchasing power per capita is approximately 51.6 thousand international dollars in Asian monarchies, compared with approximately 21.9 thousand international dollars in Asian republics.
The medians also differ substantially. Half of the monarchies have purchasing power per capita above approximately 52.7 thousand international dollars, whereas the corresponding median for republics is approximately 14.7 thousand international dollars.
Despite considerable dispersion within both groups, the distribution of monarchies is more concentrated at higher levels of purchasing power per capita. The statistical tests presented in this section assess whether this observed difference is also statistically significant.
Comparison of Purchasing Power per Capita between Monarchies and Republics in Europe
Europe is one of the most suitable regions for comparing systems of government, as many countries on the continent are relatively similar in terms of economic development, historical background, and cultural ties. An intra-regional comparison can therefore reduce, to some extent, the influence of the substantial differences that exist across world regions.
In this section, purchasing power per capita in European countries is compared between monarchies and republics.
1. Descriptive Statistics
Group |
Number of Countries (n) |
Mean |
Median |
Population SD |
European Monarchies |
8 |
62,184.91 |
62,463.20 |
25,763.48 |
European Republics |
34 |
46,712.56 |
45,024.35 |
25,894.72 |
Interpretation of Descriptive Statistics
According to the 2023 data, mean purchasing power per capita was approximately 62.2 thousand international dollars in European monarchies, compared with approximately 46.7 thousand international dollars in European republics.
Thus, in this sample, the mean purchasing power per capita of European monarchies was approximately 15.5 thousand international dollars higher than that of European republics.
The medians point in the same direction:
- Monarchies: 62,463 international dollars
- Republics: 45,024 international dollars
The consistency between the differences in the means and medians suggests that the observed gap is not driven solely by a small number of exceptionally high-income countries, but is also evident in the central part of the distributions.
However, dispersion is quite similar in the two groups. Inferential statistical tests were therefore conducted to determine whether the observed difference is statistically significant.
2. Welch’s Test for the Difference in Means
Hypotheses
Null hypothesis (H₀):
The mean purchasing power per capita is equal in European monarchies and European republics.
Alternative hypothesis (H₁):
The mean purchasing power per capita differs between the two groups.
Results of Welch’s t-test
Statistic |
Value |
Mean — European Monarchies |
62,184.91 |
Mean — European Republics |
46,712.56 |
Difference in Means |
15,472.35 |
t-statistic |
1.482 |
Approximate Degrees of Freedom |
11.674 |
p-value |
0.165 |
Interpretation of Welch’s t-test
The p-value is greater than the conventional 5% significance level. The null hypothesis is therefore not rejected.
Although mean purchasing power per capita is higher among European monarchies, given the sample sizes and dispersion of the data, the difference is not statistically significant in this dataset.
In other words, the available data do not provide sufficient statistical evidence to conclude that the two groups have different mean levels of purchasing power per capita.
3. Mann–Whitney U Test
The non-parametric Mann–Whitney U test was also conducted to examine whether the overall distributions of the two groups differ.
Hypotheses
Null hypothesis (H₀):
The distributions of purchasing power per capita do not differ significantly between the two groups.
Alternative hypothesis (H₁):
The distributions of purchasing power per capita differ between the two groups.
Results of the Mann–Whitney U Test
Statistic |
Value |
U statistic |
82 |
p-value |
0.132 |
Interpretation of the Mann–Whitney U Test
The p-value is greater than the 5% significance level. The null hypothesis is therefore not rejected.
Like Welch’s test, the Mann–Whitney U test does not provide sufficient statistical evidence to confirm a difference between the distributions of purchasing power per capita in European monarchies and republics in this dataset.
Conclusion
The 2023 European data show the following:
Group |
Mean Purchasing Power per Capita |
Monarchies |
62,185 international dollars |
Republics |
46,713 international dollars |
European monarchies have a higher mean purchasing power per capita, but neither statistical test reaches the conventional threshold for statistical significance:
- Welch’s t-test: p = 0.165
- Mann–Whitney U test: p = 0.132
Thus, although European monarchies have a higher average purchasing power per capita in the sample examined, the available statistical evidence is insufficient to conclude that the difference between the two groups is statistically significant.
Overall, when republics with a history of communist rule are excluded from the comparison, the numerical advantage of European monarchies remains, but the gap between the two groups narrows substantially and is not statistically significant. This suggests that part of the difference observed between monarchies and the full set of European republics is associated with the lower purchasing power per capita of countries with a communist past. Nevertheless, even when monarchies are compared only with republics without a history of communist rule, both the mean and median remain higher among the monarchies.
One further limitation should be considered when interpreting these results. World Bank purchasing-power-per-capita data were unavailable for two European monarchies, Liechtenstein and Monaco, and these countries were therefore excluded from the calculations. Given that both are among the wealthiest countries in Europe, their inclusion, had comparable data been available, would likely have raised the mean purchasing power per capita of the monarchy group and potentially widened the observed gap relative to European republics without a history of communist rule. However, because actual comparable data for these two countries were unavailable in the dataset used, the magnitude of this potential effect cannot be determined.
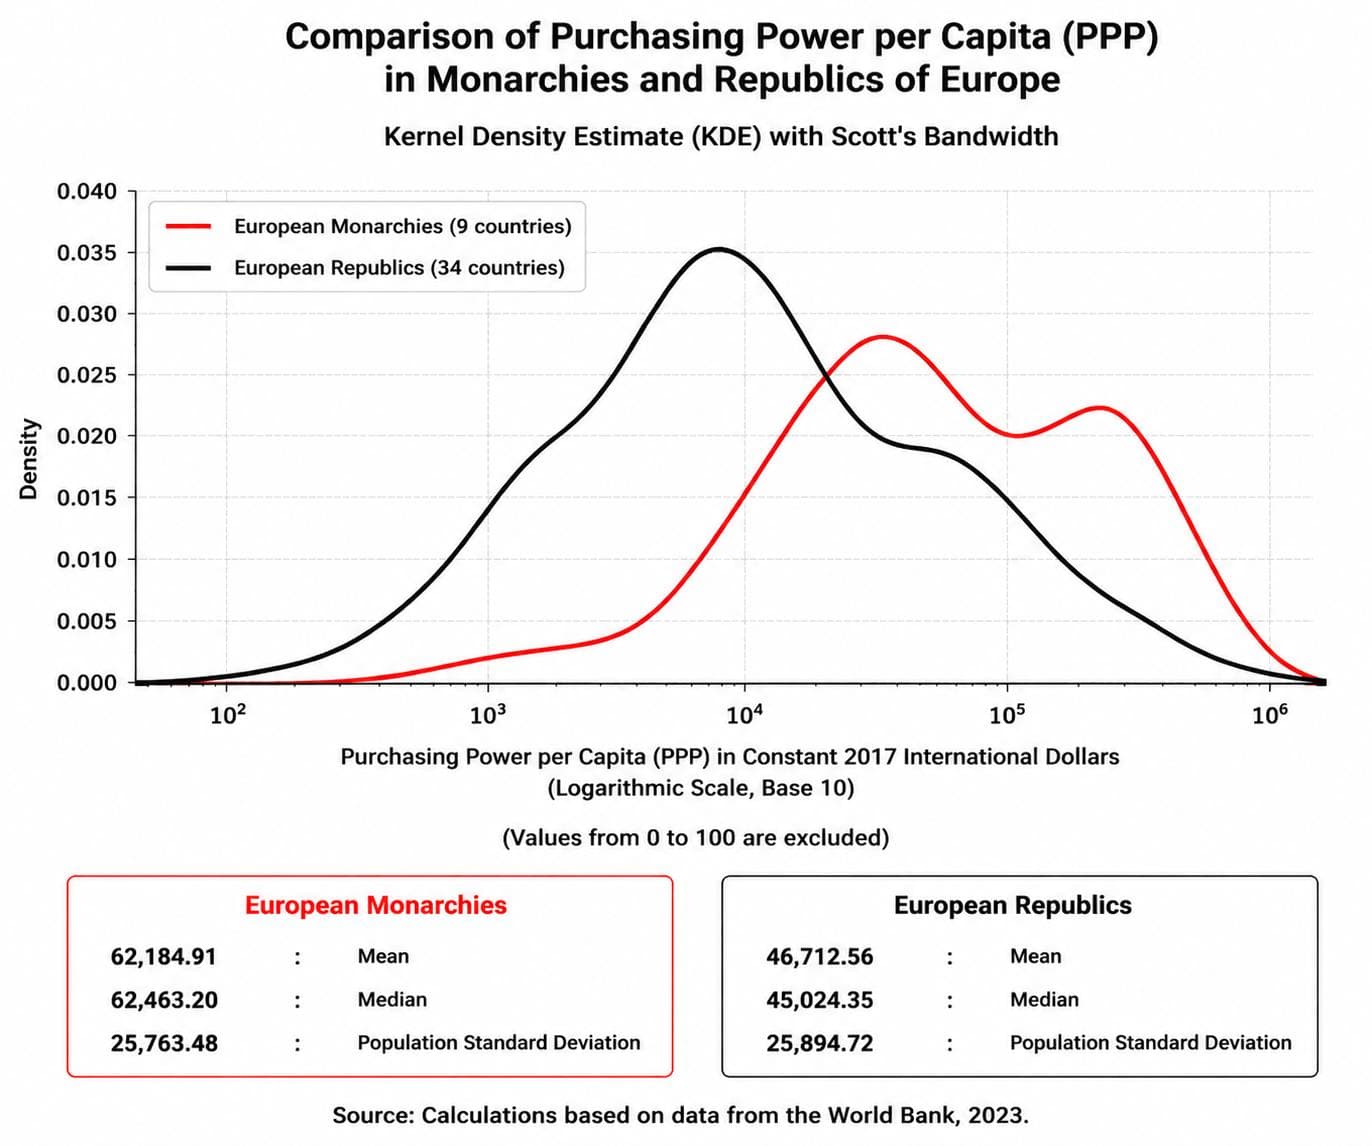
The distribution of purchasing power per capita across European countries shows that the curve for monarchies is shifted toward higher values relative to that for republics. Mean purchasing power per capita is approximately 83.1 thousand international dollars in European monarchies, compared with approximately 50.9 thousand international dollars in European republics.
The medians also differ substantially, at approximately 72.6 thousand international dollars for European monarchies and 48.1 thousand international dollars for European republics. This indicates that the distribution of monarchies is concentrated at higher levels of purchasing power per capita.
Although the two curves overlap to some extent, the overall rightward shift of the monarchy distribution is clearly visible. The statistical tests presented below assess whether this observed difference is also statistically significant.
Comparison of Purchasing Power per Capita between European Monarchies and Republics with No History of Communist Rule
Descriptive Statistics
Indicator |
European Monarchies |
Republics with No History of Communist Rule |
Number of Countries |
9 |
13 |
Mean PPP per Capita |
83,056 international dollars |
72,239 international dollars |
Median |
72,630 international dollars |
67,101 international dollars |
Sample Standard Deviation |
29,959 international dollars |
22,860 international dollars |
Mean purchasing power per capita is 10,818 international dollars higher among the monarchies, approximately 15% higher than among European republics with no history of communist rule. The median is also approximately 5,529 international dollars higher among the monarchies.
Welch’s t-test
The two-sided Welch’s t-test produced the following results:
t = 0.914, df = 14.21, p = 0.376
Thus, the difference between the two group means is not statistically significant at the 5% level.
The effect size is Hedges’ g = 0.401, indicating a small-to-moderate effect in the direction of higher PPP per capita among the monarchies.
Mann–Whitney U Test
To ensure that the conclusion did not depend solely on a comparison of means, the non-parametric Mann–Whitney U test was also conducted:
U = 72, p = 0.385
Conclusion
This test likewise indicates that the difference between the two groups is not statistically significant at the 5% level.
Importantly, despite their different statistical foundations, both tests lead to a consistent conclusion: after excluding republics with a history of communist rule, the monarchies still have higher mean and median PPP per capita, but the available statistical evidence is insufficient to establish a statistically significant difference.
Another limitation should be considered when interpreting this result. In the World Bank dataset used in this study, purchasing power per capita data were unavailable for Liechtenstein and Monaco, and these two monarchies were therefore excluded from the calculations. Since both are among Europe’s wealthiest countries, it is possible that, had comparable data been available, the mean for the monarchy group would have been higher and the gap between the two groups wider. However, because the required data were unavailable from the source used in this study, the magnitude and actual impact of their inclusion cannot be calculated.
Overall, this robustness check suggests that the communist historical legacy accounts for part, but not all, of the observed difference in Europe. Once this historical factor is removed from the comparison, the descriptive advantage of the monarchies remains, although the available evidence is insufficient to establish a statistically significant difference between the two groups.
Comparison of Purchasing Power per Capita between Monarchies and Republics in Africa, the Americas, and Oceania
Africa
Africa differs considerably from Asia and Europe in terms of the distribution of political systems. The continent has only three monarchies, compared with fifty republics. This substantial imbalance limits the statistical power of the comparison and requires greater caution in interpreting the results. Nevertheless, examining Africa remains valuable because it allows us to assess whether the pattern observed in the global comparisons is also present on this continent.
Descriptive Statistics
Among the three African monarchies, mean purchasing power per capita is 8,031 international dollars, compared with 7,154 international dollars among the fifty African republics. The difference between the two means is relatively small, although the medians show a somewhat larger gap. Income dispersion, meanwhile, is considerably greater among the African republics, indicating greater economic heterogeneity within this group.
Group |
Number of Countries |
Mean |
Median |
Standard Deviation |
Monarchies |
3 |
8,031 |
9,903 |
4,516 |
Republics |
50 |
7,154 |
4,107 |
7,119 |
Interpretation
Welch’s test indicates that the observed difference is not statistically significant (p ≈ 0.777), while the effect size is also very small (Hedges’ g ≈ 0.12). Thus, unlike in some other regions of the world, the African data do not indicate that type of government is associated with a substantial difference in purchasing power per capita. In this region, therefore, economic performance cannot be explained simply by whether a country is a monarchy or a republic.
The Americas
There are no independent monarchies in the Americas. However, several countries on the continent are Commonwealth realms and, in constitutional terms, are classified as constitutional monarchies. Since these countries were examined separately earlier, this section provides only a comparison of their economic performance with that of the republics of the Americas.
Descriptive Statistics
This study includes 9 Commonwealth realms and 25 republics in the Americas. Mean purchasing power per capita is 29,052 international dollars in the Commonwealth realms, compared with 25,081 international dollars in the republics. The median is also higher among the Commonwealth realms (26,254 international dollars) than among the republics (21,282 international dollars). The standard deviations of the two groups are quite similar, suggesting broadly comparable levels of dispersion.
Group |
Number of Countries |
Mean |
Median |
Standard Deviation |
Commonwealth Realms |
9 |
29,052 |
26,254 |
16,282 |
Republics |
25 |
25,081 |
21,282 |
16,454 |
Interpretation
Although both the mean and median purchasing power per capita are higher among the Commonwealth realms than among the republics of the Americas, Welch’s test indicates that the difference is not statistically significant (p ≈ 0.542), and the effect size is small (Hedges’ g ≈ 0.24). The regional data therefore do not provide sufficient evidence to attribute the observed difference to type of government. Nevertheless, the direction of the difference is consistent with the broader pattern observed in the global comparison and is therefore not inconsistent with the wider findings of this study.
Oceania
Oceania also has an uneven distribution of political systems. There is only one independent monarchy in the region, Tonga. In addition, the study includes five Commonwealth realms and eight republics. Because a single independent monarchy does not permit a meaningful statistical comparison between monarchies and republics, the analysis focuses primarily on the Commonwealth realms and republics, while Tonga is reported separately to provide a complete picture.
Descriptive Statistics
Tonga, the only independent monarchy in Oceania, has a purchasing power per capita of 2,599 international dollars. By comparison, mean purchasing power per capita among the five Commonwealth realms is 29,122 international dollars, compared with 9,233 international dollars among the eight republics.
Although the median among the Commonwealth realms (7,338 international dollars) is slightly lower than that of the republics (7,864 international dollars), the presence of the two large economies of Australia and New Zealand raises the group mean substantially. This also explains the much larger standard deviation among the Commonwealth realms.
Group |
Number of Countries |
Mean |
Median |
Standard Deviation |
Independent Monarchy (Tonga) |
1 |
2,599 |
2,599 |
— |
Commonwealth Realms |
5 |
29,122 |
7,338 |
33,507 |
Republics |
8 |
9,233 |
7,864 |
5,528 |
Interpretation
Although mean purchasing power per capita is substantially higher among the Commonwealth realms than among the republics of Oceania, much of this difference is driven by the two large economies of Australia and New Zealand. Welch’s test indicates that the observed difference is not statistically significant (p ≈ 0.274), although the effect size (Hedges’ g ≈ 0.72) is larger than those observed in Africa and the Americas. The Oceania data alone are therefore insufficient to support a conclusion about the role of government type and should be interpreted alongside evidence from other regions.
Conclusion
Africa, the Americas, and Oceania all face limitations related to small or highly unbalanced sample sizes. Consequently, none of these regions alone provides a sufficiently strong basis for a definitive judgment about the relationship between type of government and purchasing power per capita. Nevertheless, examining these regions remains informative because none produces evidence that directly contradicts the broader pattern observed in the global comparisons.
These three regions therefore do not constitute the primary empirical basis of the argument developed in this study. Rather, their results complement the evidence from other regions and contribute to a more comprehensive picture of the relationship between type of government and countries’ economic performance.
Comparison of Purchasing Power per Capita between Monarchies and Republics in the Middle East
Descriptive Statistics for the Middle East
Given the importance of the Middle East as a natural laboratory for comparing monarchies and republics, as discussed earlier, we can now examine the results for purchasing power per capita.
This study includes 7 monarchies and 9 republics in the Middle East. The results show that the difference between the two groups remains substantial even after adjusting for differences in price levels and the purchasing power of money across countries.
Mean purchasing power per capita is 64,201 international dollars in the Middle Eastern monarchies, compared with 25,685 international dollars in the region’s republics. In other words, mean purchasing power per capita in the Middle Eastern monarchies is approximately 2.5 times that of the republics.
The median confirms the same pattern. Median purchasing power per capita is 64,224 international dollars among the monarchies and 18,540 international dollars among the republics. Because the median is less affected by extremely high values than the mean, the consistency between these two measures indicates that the observed difference is not simply the result of one or two exceptionally wealthy countries but is also reflected in the broader distribution of the data.
The standard deviation is higher among the monarchies (36,167 international dollars) than among the republics (21,452 international dollars). This indicates that considerable variation exists within the region’s monarchies as well. Nevertheless, this dispersion does not prevent their overall level of purchasing power per capita from remaining substantially higher than that of the Middle Eastern republics.
Group |
Number of Countries |
Mean |
Median |
Standard Deviation |
Monarchies |
7 |
64,201 |
64,224 |
36,167 |
Republics |
9 |
25,685 |
18,540 |
21,452 |
Interpretation
1. Magnitude of the Descriptive Difference
The first notable finding is the magnitude of the difference between the two groups. Mean purchasing power per capita in the Middle Eastern monarchies is approximately 2.5 times that of the region’s republics, and the median confirms the same pattern. The consistency between the mean and median suggests that the observed advantage cannot be attributed solely to a few exceptionally wealthy countries; rather, the difference is also visible across the broader distribution.
The descriptive statistics therefore provide an initial indication that the pattern previously observed globally and in some other regions of the world is also present in the Middle East.
2. Statistical Significance
Although descriptive statistics are informative, they are not sufficient on their own to establish whether the observed difference could plausibly be due to sampling variability. Welch’s t-test was therefore used to assess the statistical significance of the difference.
The results indicate that the difference between Middle Eastern monarchies and republics is statistically significant (p ≈ 0.033). The null hypothesis of equal group means is therefore rejected, and the available data support the presence of a difference in economic performance between the monarchies and republics in this regional sample.
3. Effect Size
Statistical significance alone does not indicate whether the magnitude of an observed difference is substantively important. For this reason, the effect size was also calculated.
Hedges’ g ≈ 1.27, which is conventionally regarded as a large effect size. This indicates that the difference between the two groups is not only statistically detectable but also substantial in standardized terms.
4. Conclusion
Overall, the Middle Eastern data present a consistent picture across all three levels of analysis: descriptive statistics, inferential testing, and effect size. The region’s monarchies have substantially higher mean and median purchasing power per capita, the difference is statistically significant, and its standardized magnitude is large.
The importance of this finding becomes more apparent when considering that the comparison is conducted within a region whose countries share, to a greater extent than in many global comparisons, important historical, cultural, geographical, and economic characteristics. This greater regional comparability reduces some—though not all—of the contextual heterogeneity that complicates global comparisons. The Middle East can therefore be regarded as one of the more informative regional tests of the central hypothesis examined in this study.
As with all observational research, however, these findings are not sufficient on their own to establish a causal relationship between type of government and economic performance. Nevertheless, the convergence of the descriptive statistics, statistical significance, and large effect size, together with the greater contextual similarity of the countries being compared, provides substantial empirical support for the hypothesis that type of government may be one of the factors associated with differences in countries’ economic performance.
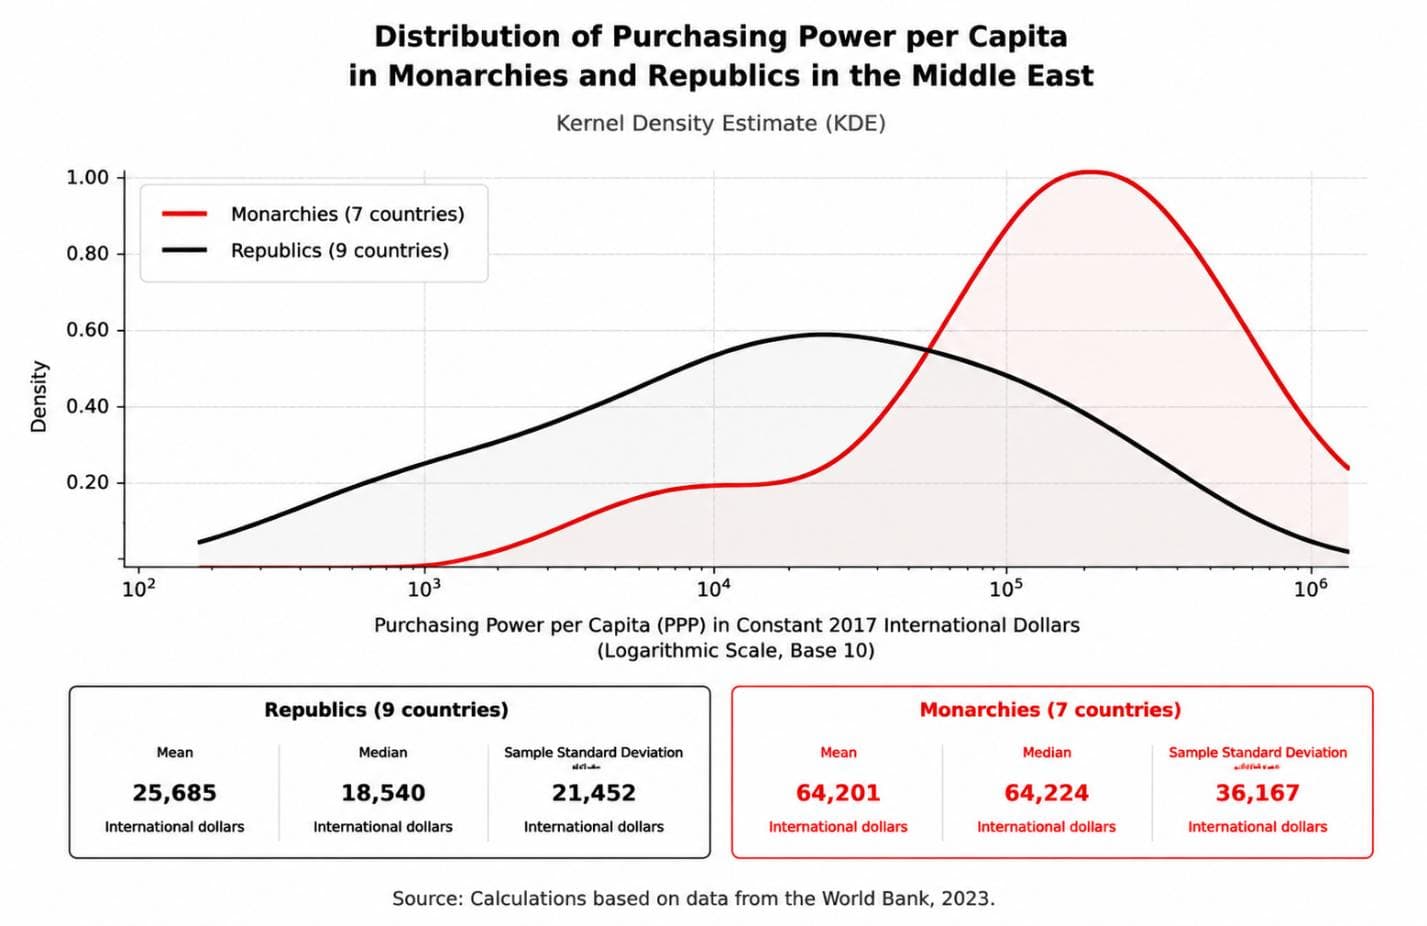
The distribution of purchasing power per capita in Middle Eastern countries shows a pronounced rightward shift for monarchies relative to republics. Average purchasing power per capita is approximately $64.2 thousand in Middle Eastern monarchies, compared with about $25.7 thousand in the region’s republics.
The medians also differ substantially: approximately $64.2 thousand for monarchies versus $18.5 thousand for republics. This indicates that the higher values observed among monarchies are not merely the result of a few exceptionally wealthy countries; rather, the central part of their distribution is also concentrated at considerably higher levels of purchasing power.
Despite substantial dispersion within both groups, the overall separation between the two distributions is clearly visible. Indeed, the visual contrast in the Middle East appears stronger than in Europe and even Asia. Nevertheless, the apparent separation of the curves cannot by itself establish statistical significance, making the inferential tests reported in the analysis essential for determining whether the observed difference is statistically supported.