

Monarchy & Republic in the Laboratory of History by N. Fakhr - HTML preview
Download the book in PDF, ePub for a complete version.
Purchasing Power per Capita
In the previous section, we found that GDP per capita is significantly higher in the world’s monarchies than in republics. Nominal income, however, does not always provide a complete picture of living standards, because the prices of goods and services vary across countries. A country may have a lower per capita income, yet because of its lower cost of living, its citizens may be able to purchase more goods and services with that income.
For example, although Afghanistan’s GDP per capita is only $413, that amount of income in Afghanistan has purchasing power equivalent to approximately $2,203 in the United States. To account for such differences, economists use GDP per capita based on Purchasing Power Parity (PPP). This measure adjusts for differences in price levels across countries and is therefore generally more suitable for comparing living standards internationally. For brevity, throughout this chapter we will refer to this indicator as “Purchasing Power per Capita.” Its unit of measurement is the international dollar.
Comparing this indicator also serves as a robustness check on the findings of the previous chapter. If the difference observed between monarchies and republics persists after adjusting for differences in price levels, we can be more confident that the pattern is not merely a consequence of differences in currency values or living costs, but remains visible in a measure that more closely reflects the actual purchasing power of citizens.
The data used in this chapter were obtained from the World Bank (Appendix RDS-B01). Data were unavailable for a number of countries, and those countries were therefore excluded from the calculations.
As in the previous chapter, the analysis begins with a global comparison between monarchies and republics. Next, to examine the role of the monarchical institution more closely, the performance of the Commonwealth realms is compared with that of republics. Constitutional monarchies and non-constitutional monarchies are then examined separately to determine whether the observed differences are associated simply with the presence or absence of a monarchy, or whether the form of monarchy may also be relevant.
The same statistical framework used in the previous chapter is retained here. Descriptive statistics and distribution plots are presented first, followed by the results of statistical tests. Finally, robustness checks are used to assess the stability of the findings.
Global Comparison of Purchasing Power per Capita: Monarchies and Republics
Data source: World Bank
Indicator: GDP per capita, PPP (current international $)
Data year: 2023
To examine differences in economic performance between the two forms of government, purchasing power per capita was compared across the world’s monarchies and republics. By adjusting for differences in price levels across countries, this indicator provides a more comparable measure of the actual purchasing power of citizens.
In addition to descriptive statistics, two independent statistical tests were conducted. Welch’s t-test was used to assess differences in group means, while the Mann–Whitney U test was used to examine differences in the overall distributions.
1. Descriptive Statistics
Group |
Countries (n) |
Mean |
Median |
Population SD |
Monarchies |
26 |
55,784.75 |
58,224.00 |
38,018.66 |
Republics |
148 |
23,435.44 |
15,320.35 |
24,756.62 |
Interpretation of the Descriptive Statistics
Based on the 2023 data, mean purchasing power per capita was approximately 55,785 international dollars among monarchies, compared with approximately 23,435 international dollars among republics.
In other words, the mean for monarchies was approximately 2.4 times that of republics.
The difference between the medians is also substantial. The median was approximately 58,224 international dollars for monarchies and 15,320 international dollars for republics. Because the median is less sensitive than the mean to extremely high or low values, this difference indicates that the observed gap is not merely the result of a small number of exceptionally high-income countries.
Nevertheless, both groups exhibit considerable dispersion. Inferential statistical tests were therefore conducted to determine whether the observed differences are statistically significant.
2. Welch’s t-test for the Difference in Means
Welch’s t-test was used to compare the means of the two groups because, unlike the conventional Student’s t-test, it does not require the assumption of equal variances.
The hypotheses were defined as follows:
Null hypothesis (H₀):
Mean purchasing power per capita is equal in the two groups.
Alternative hypothesis (H₁):
Mean purchasing power per capita differs between the two groups.
Results of Welch’s t-test
Statistic |
Value |
Mean — Monarchies |
55,784.75 |
Mean — Republics |
23,435.44 |
Mean difference |
32,349.31 |
t-statistic |
4.109 |
Approximate degrees of freedom |
28.710 |
p-value |
0.000302 |
Interpretation of Welch’s t-test
The resulting p-value (p = 0.000302) is far below the conventional significance level of 0.05.
The null hypothesis is therefore rejected, indicating that the observed difference in mean purchasing power per capita between monarchies and republics is statistically significant.
In other words, under the null hypothesis of equal population means, an observed difference of this magnitude would be highly unlikely to arise from sampling variation alone.
3. Mann–Whitney U Test
Because economic data are often non-normally distributed and may be influenced by countries with exceptionally high or low values, the non-parametric Mann–Whitney U test was also conducted.
Rather than directly comparing group means, this test assesses whether observations in one group generally tend to rank higher than observations in the other.
The hypotheses were defined as follows:
Null hypothesis (H₀):
There is no systematic difference between the distributions of purchasing power per capita in the two groups.
Alternative hypothesis (H₁):
The distributions of purchasing power per capita differ between the two groups.
Results of the Mann–Whitney U Test
Statistic |
Value |
U-statistic |
2,943 |
p-value |
0.000017 |
Interpretation of the Mann–Whitney U Test
The p-value (p = 0.000017) is well below the 0.05 significance threshold.
The null hypothesis is therefore rejected. The test provides strong evidence that the distributions of purchasing power per capita differ significantly between monarchies and republics.
This result is consistent with Welch’s t-test. Taken together, the two tests indicate that the observed difference is not confined to the group means: the broader distribution of purchasing power per capita also differs significantly between monarchies and republics.
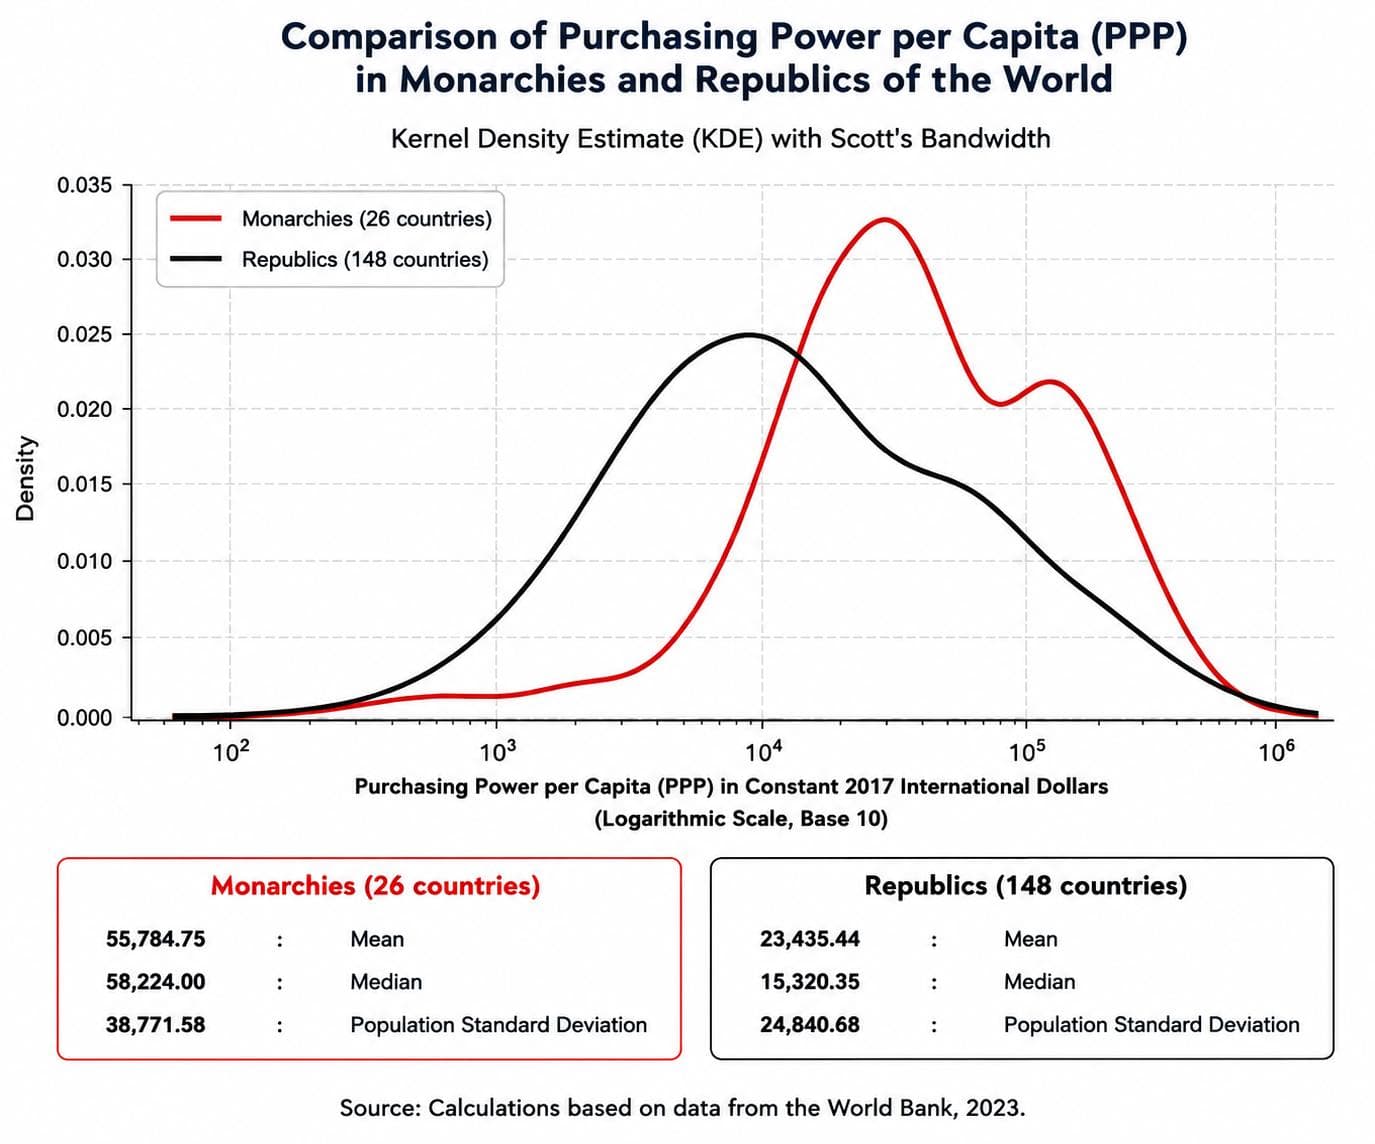
The kernel density estimate (KDE) shows that the distribution of purchasing power per capita among the world’s monarchies is noticeably shifted toward higher values. The monarchy curve (red) is more heavily concentrated at higher income levels, whereas the republic curve (black) is concentrated primarily at lower levels. This difference is also evident in the descriptive statistics: mean purchasing power per capita is 55,784.75 international dollars in monarchies, compared with 23,435.44 international dollars in republics. Likewise, the median for monarchies (58,224) is substantially higher than that for republics (15,320.35).
This pattern indicates that, in the 2023 data, monarchies tend to occupy higher levels of economic well-being, while republics display greater dispersion and a substantial proportion are concentrated at lower levels of purchasing power per capita. As with the other indicators examined in this study, however, this descriptive pattern does not by itself establish a causal relationship between regime type and economic well-being. The statistical significance of the difference between the two groups must therefore be evaluated using the inferential tests reported in the analysis.
Comparison of Purchasing Power per Capita between Constitutional and Non-Constitutional Monarchies Worldwide
Following the overall comparison between monarchies and republics, the next step is to examine differences within the monarchy group itself. This comparison investigates whether the structure of monarchy—specifically, the extent to which the monarch’s power is legally constrained—is associated with observable differences in economic well-being.
For this purpose, monarchies were divided into two groups:
- Constitutional monarchies
- Non-constitutional monarchies
In addition to descriptive statistics, two independent statistical tests were conducted:
- Welch’s t-test to compare group means
- Mann–Whitney U test to compare the distributions
1. Descriptive Statistics
Group |
Countries (n) |
Mean |
Median |
Population SD |
Constitutional monarchies |
15 |
58,806.33 |
60,786.70 |
38,519.64 |
Non-constitutional monarchies |
11 |
51,664.40 |
53,083.40 |
36,928.37 |
Interpretation of the Descriptive Statistics
Based on the 2023 data, mean purchasing power per capita was approximately 58,806 international dollars in constitutional monarchies and 51,664 international dollars in non-constitutional monarchies.
Thus, in this dataset, constitutional monarchies had an average purchasing power per capita approximately 7,142 international dollars higher than that of non-constitutional monarchies.
The medians show a similar difference:
- Constitutional monarchies: 60,787 international dollars
- Non-constitutional monarchies: 53,083 international dollars
The fact that both the mean and median point in the same direction suggests that the observed difference is not simply driven by a small number of countries with exceptionally high or low values.
However, dispersion is substantial in both groups, and their standard deviations are relatively similar. Inferential tests were therefore conducted to determine whether the observed difference is statistically significant.
2. Welch’s t-test for the Difference in Means
The hypotheses were defined as follows:
Null hypothesis (H₀):
Mean purchasing power per capita is equal in the two types of monarchy.
Alternative hypothesis (H₁):
Mean purchasing power per capita differs between the two types of monarchy.
Results of Welch’s t-test
Statistic |
Value |
Mean — Constitutional monarchies |
58,806.33 |
Mean — Non-constitutional monarchies |
51,664.40 |
Mean difference |
7,141.93 |
t-statistic |
0.459 |
Approximate degrees of freedom |
22.064 |
p-value |
0.651 |
Interpretation of Welch’s t-test
The resulting p-value (p = 0.651) is substantially greater than the conventional significance level of 0.05.
The null hypothesis is therefore not rejected.
In other words, although constitutional monarchies have a higher mean purchasing power per capita in this dataset, the observed difference is not statistically significant. The available evidence therefore does not support the conclusion that the two groups have different population means.
3. Mann–Whitney U Test
Because economic data may deviate from a normal distribution, the non-parametric Mann–Whitney U test was also conducted.
The hypotheses were defined as follows:
Null hypothesis (H₀):
There is no systematic difference between the distributions of purchasing power per capita in the two groups.
Alternative hypothesis (H₁):
The distributions of purchasing power per capita differ between the two groups.
Results of the Mann–Whitney U Test
Statistic |
Value |
U-statistic |
89 |
p-value |
0.755 |
Interpretation of the Mann–Whitney U Test
The resulting p-value (p = 0.755) is also substantially greater than the 0.05 significance threshold.
The null hypothesis is therefore not rejected.
Consistent with Welch’s t-test, the Mann–Whitney U test provides no statistically significant evidence of a difference between the two groups.
Conclusion
In the 2023 purchasing-power-per-capita data, constitutional monarchies have a higher mean than non-constitutional monarchies:
- Constitutional monarchies: 58,806 international dollars
- Non-constitutional monarchies: 51,664 international dollars
However, neither statistical test indicates a statistically significant difference:
- Welch’s t-test: p = 0.651
- Mann–Whitney U test: p = 0.755
Therefore, in this dataset, the distinction between constitutional and non-constitutional monarchy is not associated with a statistically significant difference in purchasing power per capita.
Comparison of Purchasing Power per Capita between Commonwealth Realms and Republics Worldwide
Following the overall comparison between monarchies and republics, a supplementary question arises: Do the Commonwealth realms, which have a historical and constitutional connection to the British monarchy, differ significantly from the world’s republics in terms of economic well-being?
To address this question, purchasing power per capita was compared between the two groups. In addition to descriptive statistics, two independent statistical tests were conducted:
- Welch’s t-test to compare group means
- Mann–Whitney U test to compare the distributions
1. Descriptive Statistics
Group |
Countries (n) |
Mean |
Median |
Population SD |
Commonwealth realms |
14 |
28,704.38 |
23,045.05 |
21,526.94 |
Republics |
148 |
23,435.44 |
15,320.35 |
24,756.62 |
Interpretation of the Descriptive Statistics
Based on the 2023 data, mean purchasing power per capita was approximately 28,704 international dollars in the Commonwealth realms and 23,435 international dollars in the world’s republics.
Thus, the mean for the Commonwealth realms was approximately 5,269 international dollars higher than that of the republics.
The medians show a similar pattern:
- Commonwealth realms: 23,045 international dollars
- Republics: 15,320 international dollars
This difference indicates that the Commonwealth realms also have higher values around the center of the distribution.
However, the number of Commonwealth realms in this comparison is much smaller than the number of republics (14 versus 148 countries), and there is substantial dispersion in both groups. Inferential tests were therefore conducted to determine whether the observed difference is statistically reliable.
2. Welch’s t-test for the Difference in Means
Welch’s t-test evaluates whether the difference between the two group means is statistically significant after accounting for sample size and variability.
The hypotheses were defined as follows:
Null hypothesis (H₀):
Mean purchasing power per capita is equal in the Commonwealth realms and republics.
Alternative hypothesis (H₁):
Mean purchasing power per capita differs between the two groups.
Results of Welch’s t-test
Statistic |
Value |
Mean — Commonwealth realms |
28,704.38 |
Mean — Republics |
23,435.44 |
Mean difference |
5,268.94 |
t-statistic |
0.835 |
Approximate degrees of freedom |
16.199 |
p-value |
0.416 |
Interpretation of Welch’s t-test
The resulting p-value (p = 0.416) is greater than the conventional significance level of 0.05.
The null hypothesis is therefore not rejected.
In other words, although mean purchasing power per capita is higher among the Commonwealth realms, the difference is not statistically significant in this sample. The available evidence is therefore insufficient to conclude that the two groups have different population means.
3. Mann–Whitney U Test
Because economic data may have asymmetric or non-normal distributions, the Mann–Whitney U test was also conducted to determine whether the overall distributions of the two groups differ.
The hypotheses were defined as follows:
Null hypothesis (H₀):
There is no systematic difference between the distributions of purchasing power per capita in the two groups.
Alternative hypothesis (H₁):
The distributions of purchasing power per capita differ between the two groups.
Results of the Mann–Whitney U Test
Statistic |
Value |
U-statistic |
1,244 |
p-value |
0.216 |
Interpretation of the Mann–Whitney U Test
The resulting p-value (p = 0.216) is greater than the 0.05 significance threshold.
The null hypothesis is therefore not rejected.
Consistent with Welch’s t-test, the Mann–Whitney U test provides no statistically significant evidence of a difference between the Commonwealth realms and republics in this dataset.
Conclusion
In the 2023 purchasing-power-per-capita data:
Group |
Mean Purchasing Power per Capita |
Commonwealth realms |
28,704 international dollars |
Republics |
23,435 international dollars |
The Commonwealth realms have higher mean and median purchasing power per capita than the world’s republics. However:
- Welch’s t-test: p = 0.416
- Mann–Whitney U test: p = 0.216
Neither test identifies the observed difference as statistically significant.
Therefore, in this dataset, membership in the Commonwealth-realm group is not, by itself, associated with a statistically demonstrable difference in purchasing power per capita relative to the world’s republics.
This result differs from the overall comparison between monarchies and republics. In the global comparison, the advantage observed for monarchies was statistically significant and accompanied by a large effect size; when the analysis is restricted to the Commonwealth realms, however, the gap between the two groups becomes smaller and is no longer statistically significant. The small number of Commonwealth realms and the substantial variation in economic development among them may partly explain this greater statistical uncertainty.
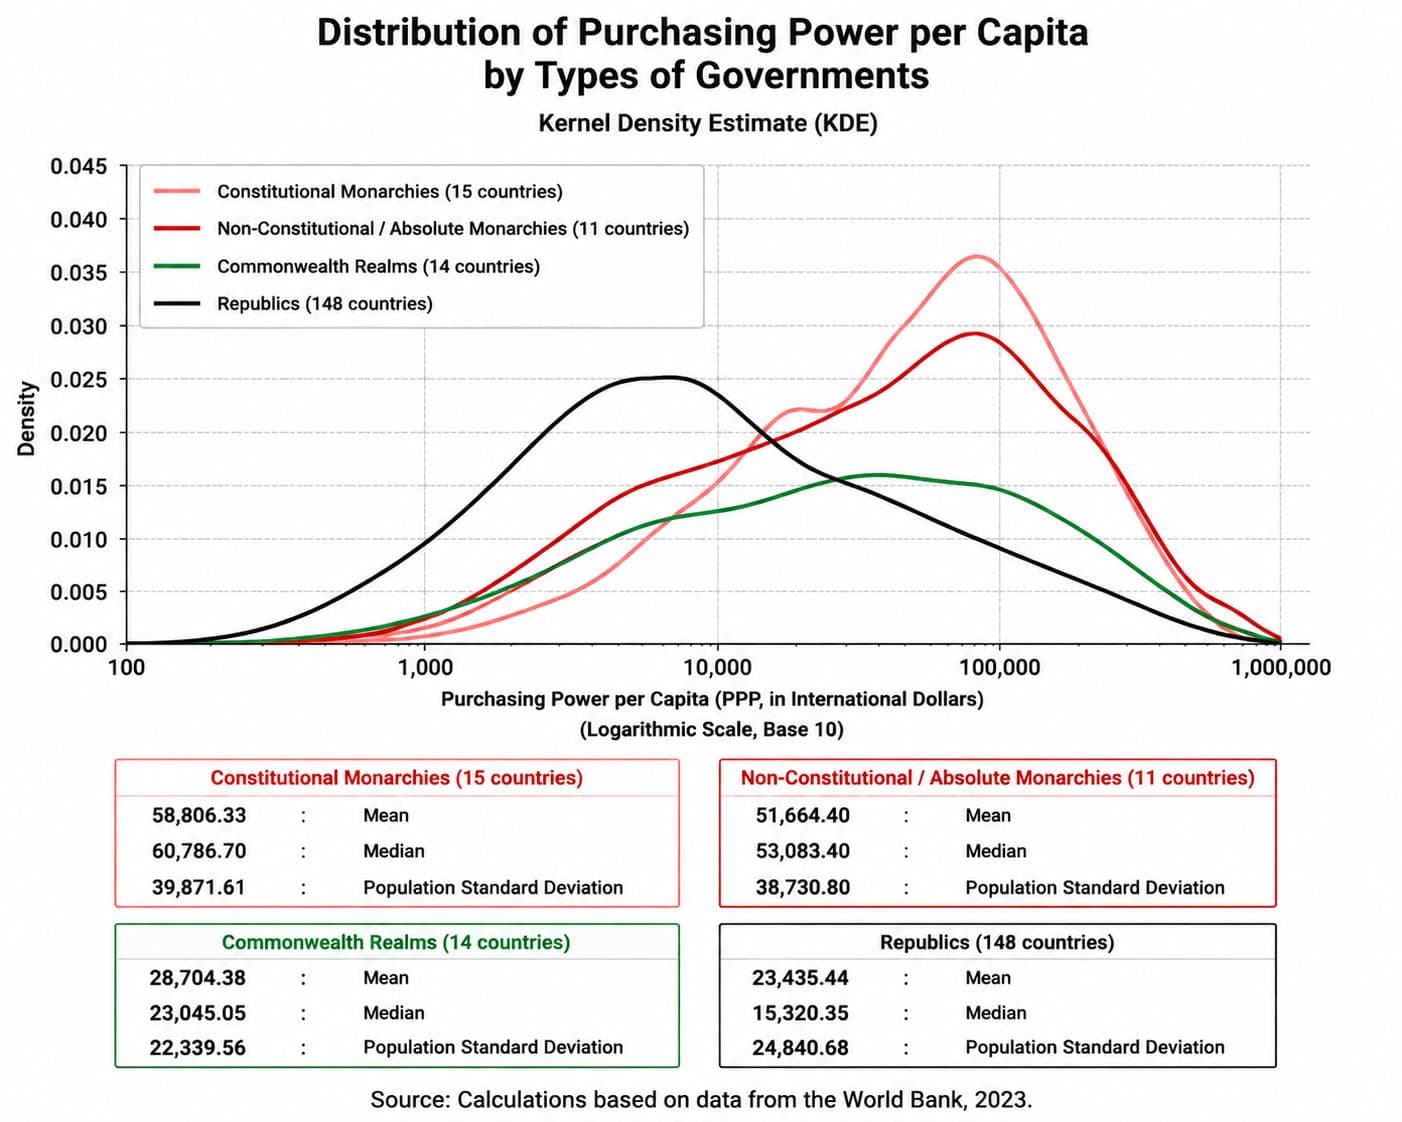
The distribution of purchasing power per capita across the four groups shows that the curves for constitutional monarchies and non-constitutional monarchies are shifted toward the higher end of the income scale, whereas the distributions of republics and Commonwealth realms are more concentrated at lower levels.
Constitutional monarchies have the highest mean purchasing power per capita among the four groups, at approximately 58.8 thousand international dollars, followed by semi-constitutional and absolute monarchies at approximately 51.7 thousand. By comparison, the mean is about 28.7 thousand for the Commonwealth realms and 23.4 thousand for republics.
The positions of the curves also indicate that a substantial proportion of monarchies are located in the higher ranges of the distribution. Nevertheless, the considerable dispersion within all four groups means that differences in means alone are insufficient for drawing firm conclusions; statistical tests are required to determine whether the observed differences are statistically significant.