

Monarchy & Republic in the Laboratory of History by N. Fakhr - HTML preview
Download the book in PDF, ePub for a complete version.
Comparison of GDP per Capita Between Monarchies and Republics Across Continents and in the Middle East
In the previous sections, we compared the economic performance of monarchies and republics at the global level using GDP per capita. Although such a comparison provides an overall picture of the differences between the two forms of government, some of the observed differences may be influenced by the wide variation among countries in their history, culture, geography, economic structure, or regional conditions.
One way to assess the robustness of the findings is to repeat the same analysis using samples that are more homogeneous in certain respects. Countries within the same continent generally share more similarities than countries across the world as a whole, particularly in terms of historical background, geographic setting, economic interactions, cultural characteristics, and, to some extent, political institutions. Comparing monarchies and republics within each continent can therefore help determine whether the pattern observed at the global level also appears in settings where countries share relatively similar conditions.
In addition to the continental comparisons, the Middle East is examined separately. Despite its internal diversity, the region shares a number of historical, climatic, cultural, religious, and geopolitical characteristics. It therefore provides another useful setting for examining the relationship between the type of government and countries’ economic performance.
For each region, we first examine the distribution of the data and the descriptive statistics. The difference between monarchies and republics is then evaluated using Welch’s t-test, while the effect size is reported using Hedges’ g. This allows us to assess not only whether the observed difference is statistically significant, but also how large that difference is.
For Europe, an additional robustness check is conducted. In this analysis, republics with a history of communist rule are excluded from the sample to determine whether the observed pattern persists after this change in sample composition. If the results remain similar under this more restricted comparison, we can be more confident that the findings are not simply a product of the particular composition of the original sample, but reflect a more robust pattern.
Comparison of GDP per Capita Between Monarchies and Republics in Asia
With substantial numbers of both monarchies and republics, Asia is one of the most suitable continents for comparing the performance of these two forms of government. Although Asian countries differ considerably in their levels of development, natural resources, and economic structures, they share more historical, geographical, and cultural characteristics with one another than countries across the world as a whole. Examining Asia can therefore help determine whether the pattern observed in the global analysis also appears within a regional setting.
Descriptive Statistics
Among Asian countries, the mean GDP per capita is $27,339 for monarchies and $9,750 for republics. In other words, the average GDP per capita of Asian monarchies is approximately 2.8 times that of the continent’s republics.
However, as emphasized in the previous sections, the mean alone cannot provide a complete picture of the data, since it may be influenced by a small number of countries with exceptionally high or low incomes. For this reason, the median, sample standard deviation, and the overall shape of the distribution are also examined alongside the mean.
Inferential Statistics
To assess whether the observed difference between Asian monarchies and republics could simply be attributed to sampling variation, Welch’s t-test was used.
The results show that the difference in mean GDP per capita between the two groups is statistically significant (p < 0.05). The effect size, measured by Hedges’ g, is also in the large range, indicating that the difference is not only statistically significant but also substantial in magnitude.
Summary
The data for Asia therefore show the same general pattern observed in the global comparison. In this sample, Asian monarchies have, on average, a higher GDP per capita than Asian republics, and the statistical test indicates that this difference cannot readily be attributed to random sampling variation.
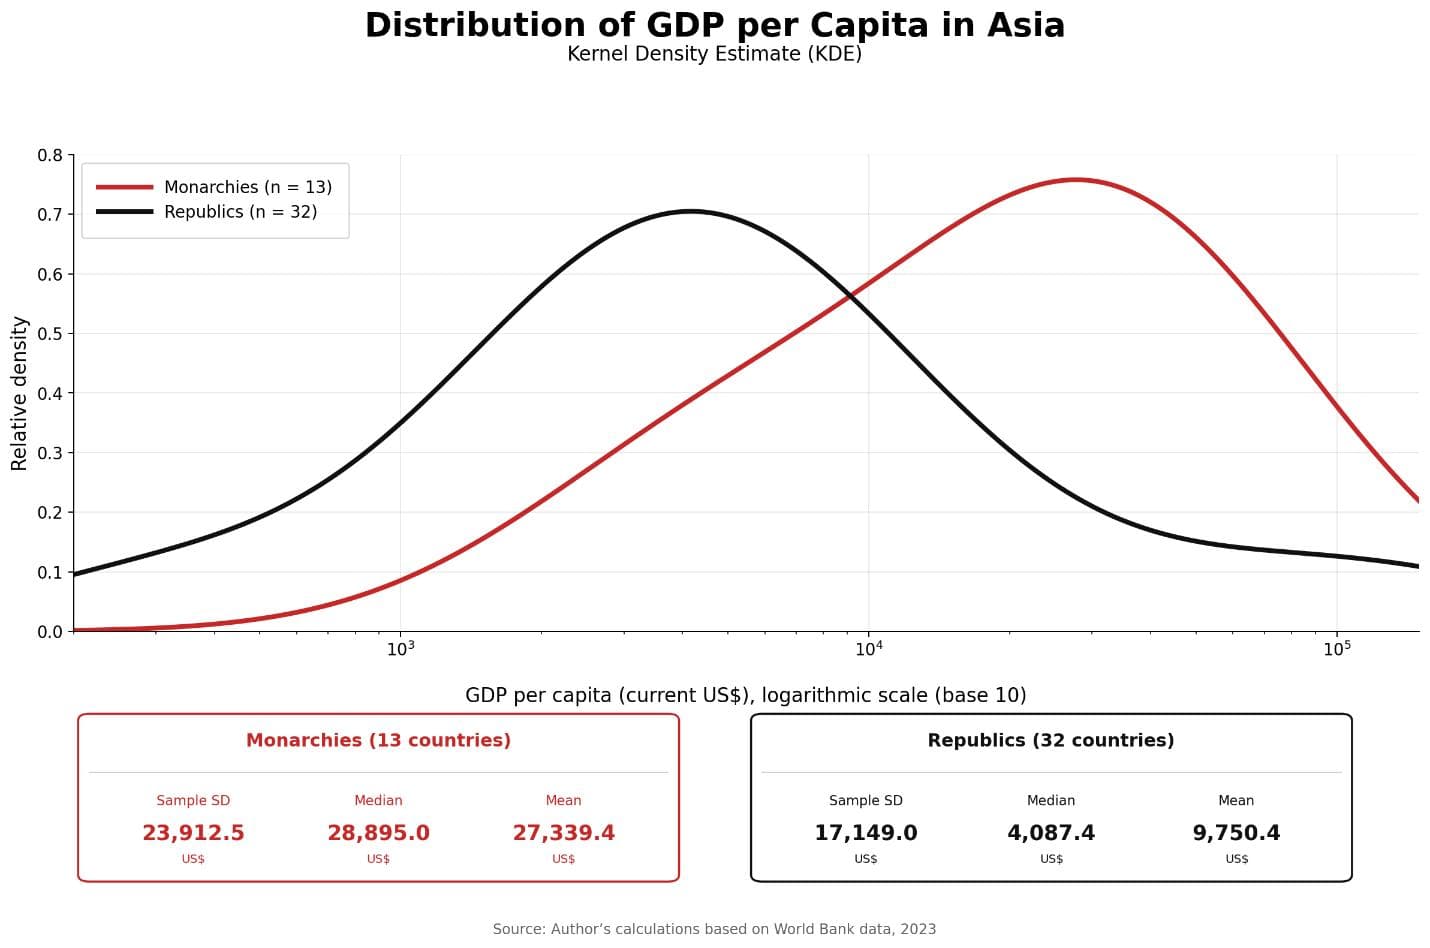
The chart shows a clear descriptive shift in the distribution of GDP per capita in Asia. Monarchies are concentrated at substantially higher income levels than republics, with both their mean ($27,339) and median ($28,895) well above those of republics ($9,750 and $4,087, respectively).
The distributions nevertheless overlap, indicating that the two groups are not completely separate and that countries with different income levels exist in both. The republics also show a pronounced right-skewed distribution, with most countries concentrated at relatively low income levels and a smaller number extending into much higher levels.
Overall, the chart is consistent with the descriptive statistics: Asian monarchies tend to occupy the higher end of the GDP-per-capita distribution, while Asian republics are more heavily concentrated at lower levels. The statistical significance of this difference, however, must be assessed through the inferential tests presented separately.
Comparison of GDP per Capita between Monarchies and Republics in Europe
Europe provides one of the most suitable settings for comparing the economic performance of monarchies and republics. Many countries on the continent share considerable similarities in their levels of development, legal systems, economic structures, human capital, and degree of integration into the global economy. Comparing the two forms of government within Europe can therefore reduce some of the heterogeneity present in the global comparison and provide a more focused regional test of the observed pattern.
European countries, however, have not followed identical historical trajectories. A substantial number of the continent’s republics spent a significant part of the twentieth century under communist rule. The institutional and economic legacies of this historical experience may still be reflected in their current levels of development. For this reason, the European analysis is conducted in two stages. First, all European monarchies and republics are compared. Then, as a robustness check, republics with a history of communist rule are excluded from the sample to assess whether the main result remains stable under this alternative sample specification.
Descriptive Statistics
The main European sample consists of 11 monarchies and 34 republics. Mean GDP per capita is $92,065.8 among European monarchies and $31,206.2 among the continent’s republics. Thus, the mean for monarchies is approximately 2.95 times that of republics.
Median GDP per capita is also substantially higher among monarchies: $62,536.7, compared with $23,827.3 among republics. The higher median indicates that the difference between the two groups is not merely the result of one or a few exceptionally wealthy countries; it is also evident in the central part of the distribution.
The sample standard deviation is $66,495.6 for monarchies and $25,038.3 for republics. The greater dispersion among monarchies indicates that these countries are not homogeneous in terms of GDP per capita, with some very high-income monarchies lying far above the other members of the group. For this reason, examining the full shape of the distribution is particularly important alongside the mean and median.
Inferential Statistics
To compare the means of the two groups, Welch’s t-test was used. Unlike the classical Student’s t-test, Welch’s test does not assume equal variances and is therefore more appropriate for the European data, where dispersion is clearly greater among monarchies than among republics.
The test result is as follows:
Since the p-value is below the 0.05 significance level, the null hypothesis of equal group means is rejected. More precisely, in the sample examined, the difference in mean GDP per capita between European monarchies and republics is statistically significant.
The effect size based on Hedges’ g is approximately:
This value indicates a very large effect size. The observed difference is therefore not only statistically significant but also substantial in magnitude.
Interpretation
The results of the main European analysis are consistent with the pattern observed in the global comparison and in the analysis of Asia. European monarchies have higher GDP per capita than the continent’s republics in terms of both the mean and the median. The distribution plot likewise shows that a substantial portion of the monarchy distribution is concentrated at higher income levels.
This result, however, does not by itself establish that the form of government causes the observed economic difference. Differences in the historical trajectories of European countries—including the experience of communist rule in many republics—may account for part of the observed gap. Therefore, to assess the robustness of the result, the comparison should be repeated using an alternative specification of the republic sample.
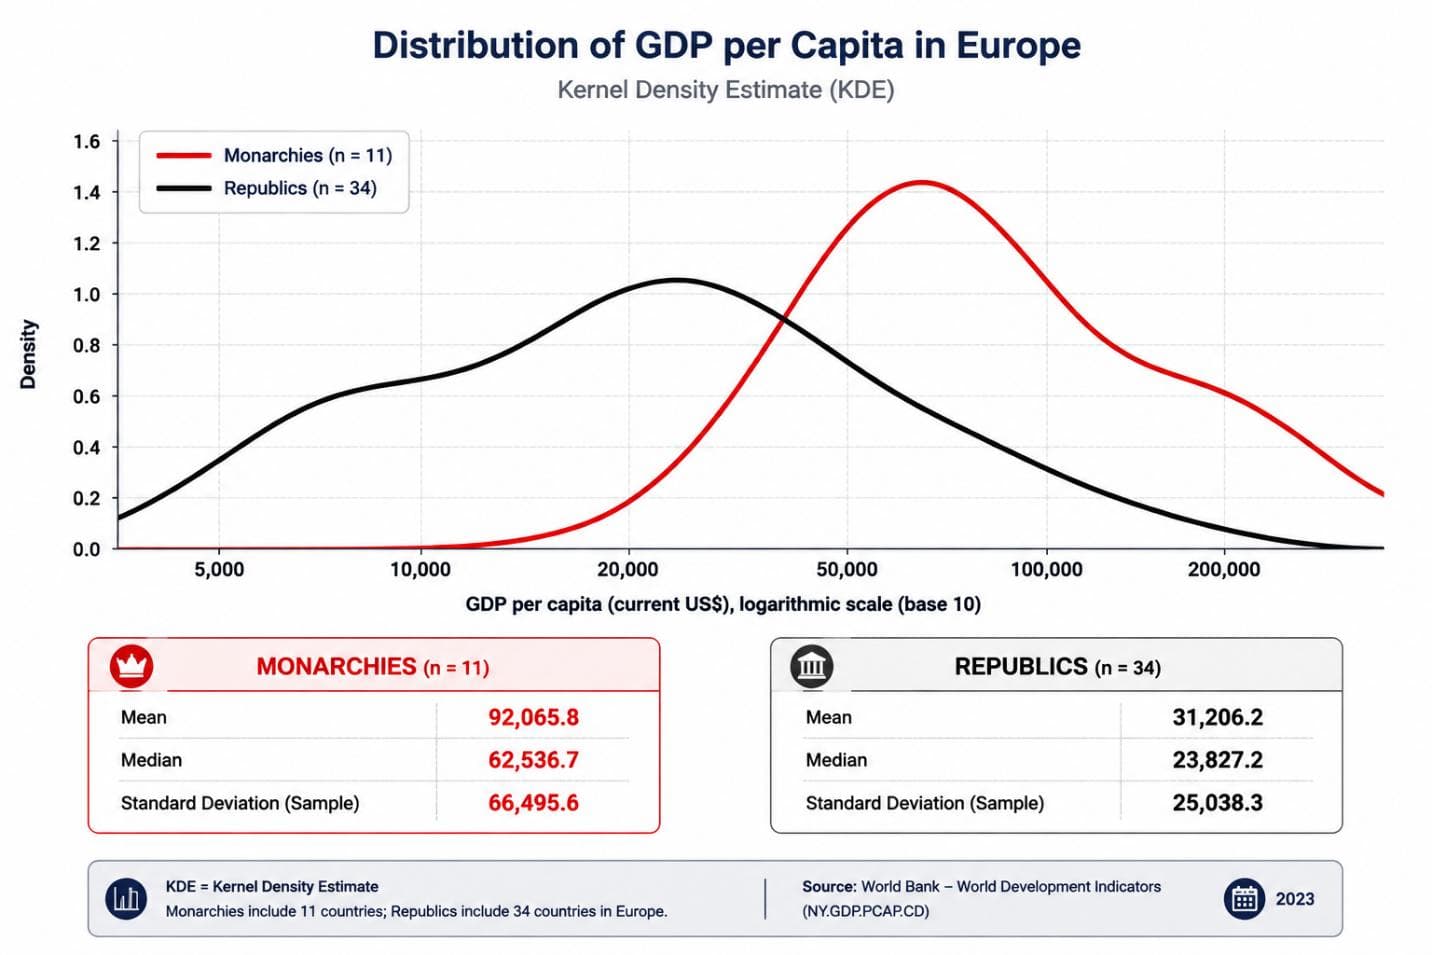
The chart shows a clear descriptive difference between the two groups. The distribution of GDP per capita among European monarchies is shifted substantially toward higher income levels than that of European republics. Monarchies have both a much higher mean ($92,066) and median ($62,537) than republics ($31,206 and $23,827, respectively).
The wider spread of the monarchy curve also indicates greater variation within this group, partly reflecting the presence of several exceptionally high-income monarchies. Nevertheless, the large difference in medians suggests that the observed gap is not driven solely by a few very wealthy countries.
Overall, European monarchies are concentrated at considerably higher levels of GDP per capita than European republics, although the overlap between the distributions shows that the two groups are not completely separate. As with the previous comparisons, the chart is descriptive and does not by itself establish either statistical significance or causality.
Robustness Check for Europe
In the next stage, European republics with a history of communist rule are excluded from the sample, and the remaining republics are compared with the monarchies. This analysis should not be interpreted as fully controlling for the effects of communism. Rather, its purpose is to address a narrower question: whether the main result remains robust when the sample is defined differently.
Robustness Check: Excluding Former Communist Republics in Europe
One possible objection is that the observed difference between European monarchies and republics may reflect historical differences between Western and Eastern Europe rather than differences in form of government. Many European republics were under communist rule until only a few decades ago, and the legacy of those systems may still affect their current levels of economic development. It could therefore be argued that including these countries lowers the average GDP per capita of republics and exaggerates the observed gap between the two groups.
To examine this possibility, a robustness check is conducted in which republics with a history of communist rule are excluded from the sample and the statistical analysis is repeated. An important methodological point, however, should be kept in mind. Excluding these countries does not necessarily bring us closer to a more accurate estimate of the underlying difference between monarchies and republics. On the contrary, one could argue that the tendency of some republics to develop communist regimes may itself have been one of the possible historical outcomes associated with republican systems. If so, excluding these countries would mean removing part of the historical experience of republics from the analysis.
This robustness check should therefore not be interpreted as an attempt to estimate the “true effect” of the form of government. Instead, it addresses a more limited counterfactual question: how large would the economic difference between European monarchies and republics be if the European republics that experienced communist rule were excluded from the comparison? Excluding former communist republics does not necessarily provide a “truer” picture of the monarchy–republic comparison. Accordingly, the findings of this section do not replace the main results of the study; they simply show how robust the original result is to this particular objection.
Descriptive Statistics
In this robustness check, 21 European republics with a history of communist rule were excluded from the sample, leaving 13 republics with no such history. The same 11 European monarchies from the previous analysis were retained unchanged. The purpose of this comparison is to examine how much of the economic difference between the two forms of government remains after excluding the possible influence of the communist legacy.
The descriptive statistics are presented in the table below.
Group |
Number of Countries |
Mean |
Median |
Sample Standard Deviation |
Monarchies |
11 |
$92,065.77 |
$62,536.70 |
$66,495.55 |
Republics with no history of communist rule |
13 |
$54,320.30 |
$52,745.80 |
$25,577.50 |
As the table shows, excluding former communist republics substantially increases the mean GDP per capita of the republic group. Nevertheless, the mean for monarchies remains considerably higher than that of republics with no history of communist rule. The medians of the two groups also become much closer than in the original analysis, suggesting that part of the initial gap was associated with the lower economic performance of former communist republics, although the difference does not disappear entirely.
Inferential Statistics
To determine whether the remaining difference is statistically significant, Welch’s t-test was again applied. Given the unequal variances and different sample sizes of the two groups, this test remains the more appropriate method for comparing their means.
The results are:
- Welch’s t = 1.775
- Degrees of freedom = 11.84
- p = 0.100
- Hedges’ g = 0.749
In this analysis, the p-value is greater than the conventional 0.05 significance level. Therefore, within this subsample, there is insufficient statistical evidence to reject the null hypothesis of equal means at the 5% significance level.
The effect size, however, remains substantial. Hedges’ g = 0.749 falls in the medium-to-large range. In other words, although the observed difference is no longer statistically significant at the 0.05 level, its estimated magnitude remains notable.
The smaller sample resulting from the exclusion of 21 republics also increases statistical uncertainty and reduces the power of the test. Thus, the absence of statistical significance should not be interpreted as evidence that the two groups are economically equivalent.
Interpretation
This robustness check shows that a substantial part of the original gap between European monarchies and republics becomes smaller when former communist republics are excluded, but the gap does not disappear. The mean GDP per capita of monarchies remains considerably higher, while the difference between the medians becomes much narrower. Thus, the descriptive advantage of European monarchies in the full sample cannot be attributed solely to the inclusion of former communist republics.
At the same time, as explained at the beginning of this section, this analysis should not be interpreted as an estimate of the “net effect” of the form of government. Excluding former communist republics removes from the analysis part of the historical path followed by some European republics. The robustness check therefore addresses a narrower counterfactual question: how does the monarchy–republic comparison change when European republics that experienced communist rule are excluded?
Accordingly, the main findings of the study remain based on the complete sample. This robustness check provides a more qualified conclusion: the descriptive economic gap remains after former communist republics are excluded, and the effect size remains substantial, but the difference is no longer statistically significant at the 0.05 level.
Comparison of GDP per Capita between Monarchies and Republics in Africa, the Americas, and Oceania
After examining Asia and Europe, we now turn to three other regions of the world: Africa, the Americas, and Oceania. Unlike the two previous continents, these regions contain very few independent monarchies, making comparisons with high statistical power difficult. Africa has only three independent monarchies; the Americas have none, so the only possible comparison is between republics and Commonwealth realms; and Oceania has only one independent monarchy, alongside several Commonwealth realms and republics.
Because the aim of this book is to identify reliable patterns in global data, the main emphasis is placed on comparisons with sufficiently large samples. The discussion of these three regions is therefore kept relatively brief, reporting only the most important descriptive statistics and, where appropriate, statistical test results.
This brevity does not imply that these regions are unimportant; it simply reflects the limitations of the available samples. The next section, by contrast, will focus on the Middle East, where both monarchies and republics are well represented and where countries share many historical, cultural, geographical, and, to a considerable extent, natural-resource characteristics. The comparison between the two forms of government in the Middle East may therefore provide one of the fairest and most informative tests in this study.
Africa
Africa differs considerably from Asia and Europe in the distribution of its political systems. The continent has only three monarchies, compared with fifty republics. This substantial imbalance limits the statistical power of the comparison and requires greater caution in interpreting the results. Nevertheless, examining Africa remains useful because it allows us to see whether the pattern observed in other regions of the world is also present on this continent.
Descriptive Statistics
Among the three African monarchies, mean GDP per capita is $2,782, compared with $2,649 among the fifty African republics. The difference between the two means is very small, although the median is higher among monarchies. Income dispersion is also considerably greater among African republics, indicating substantial economic heterogeneity within this group.
Group |
Number of Countries |
Mean |
Median |
Sample Standard Deviation |
Monarchies |
3 |
$2,782 |
$3,672 |
$1,651 |
Republics |
50 |
$2,649 |
$1,590 |
$3,208 |
Inferential Statistics
The results of Welch’s t-test likewise indicate that the observed difference between the two groups is not statistically significant (p ≈ 0.91), while the effect size is essentially negligible (Hedges’ g ≈ 0.04). Thus, the available data provide no evidence of a statistically significant difference in mean GDP per capita between African monarchies and republics.
The Americas
There are no independent monarchies in the Americas. However, several countries in the region are Commonwealth realms: independent states that recognize the British monarch as their head of state and are constitutionally classified as monarchies. Since these countries have already been examined separately, this section provides only a brief regional comparison of their economic performance with that of republics in the Americas.
Given the small number of Commonwealth realms, the findings in this section should be regarded primarily as descriptive rather than as having the same inferential weight as the comparisons for Asia, Europe, or the Middle East.
Descriptive Statistics
The sample for the Americas includes 9 Commonwealth realms and 25 republics. Mean GDP per capita is $20,202 among the Commonwealth realms, compared with $13,923 among the republics. Median GDP per capita is also higher among the Commonwealth realms ($13,980) than among the republics ($10,044). The standard deviations of the two groups are very similar, indicating broadly comparable levels of income dispersion.
Group |
Number of Countries |
Mean |
Median |
Sample Standard Deviation |
Commonwealth realms |
9 |
$20,202 |
$13,980 |
$15,322 |
Republics |
25 |
$13,923 |
$10,044 |
$15,540 |
Interpretation
Although both mean and median GDP per capita are higher among the Commonwealth realms than among the republics of the Americas, the small number of Commonwealth realms means that this finding should be treated primarily as a descriptive observation rather than a firm statistical conclusion. Nevertheless, the direction of the difference is consistent with the broader pattern observed in the global comparison.
Oceania
Oceania is also highly unbalanced in terms of forms of government. The region contains only one independent monarchy, Tonga, together with five Commonwealth realms and eight republics included in this study. Because a single independent monarchy provides no basis for meaningful statistical inference, the analysis here focuses on the descriptive comparison between Commonwealth realms and republics, while Tonga is reported separately for completeness.
Descriptive Statistics
Tonga, the only independent monarchy in Oceania, has a GDP per capita of $4,682. By comparison, mean GDP per capita among the region’s five Commonwealth realms is $24,780, while the mean among its eight republics is $6,606.
Although median GDP per capita among the Commonwealth realms ($5,465) is only slightly higher than among the republics ($5,004), the mean for the Commonwealth group is substantially higher because of the presence of the two large, high-income economies of Australia and New Zealand. This also explains the much larger standard deviation among the Commonwealth realms.
Group |
Number of Countries |
Mean |
Median |
Sample Standard Deviation |
Independent monarchy (Tonga) |
1 |
$4,682 |
$4,682 |
— |
Commonwealth realms |
5 |
$24,780 |
$5,465 |
$29,647 |
Republics |
8 |
$6,606 |
$5,004 |
$4,432 |
Interpretation
With only one independent monarchy, Oceania does not provide a sufficient basis for a direct statistical comparison between monarchies and republics. The descriptive comparison between Commonwealth realms and republics shows a substantially higher mean GDP per capita for the former, but this difference is strongly influenced by Australia and New Zealand. The much smaller difference between the two medians illustrates this clearly.
Accordingly, the results for Oceania should also be treated as descriptive evidence rather than as a firm statistical conclusion.
The Middle East: The Fairest Test for Comparing Monarchy and Republic
So far, the results of this study have shown that, both globally and in Asia and Europe, countries with monarchical systems have, on average, performed better economically than republics. Yet an important question remains: are these differences actually related to the form of government, or do they mainly reflect the very different historical, cultural, geographical, and economic conditions found across regions of the world?
The Middle East provides a particularly useful setting in which to examine this question. Compared with many other regions, the countries of the Middle East share significant similarities in historical background, culture, religion, geography, climate, and, to a considerable extent, natural resources. Many of these countries were, until less than a century ago, either part of the Ottoman Empire or under the influence of colonial powers, and many began the process of modern state-building during roughly the same historical period. Moreover, a large share of the world’s oil and gas reserves is concentrated in this region, and both Middle Eastern monarchies and republics—although to varying degrees—have benefited from these resources.
From a methodological perspective, these similarities are particularly important. In comparative research, the more similar the units being compared are in their background conditions, the better the opportunity to examine the role of the main variable of interest. In this book, that variable is the form of government. Therefore, if a meaningful difference between monarchies and republics is still observed in a region where countries share many historical, cultural, geographical, and economic characteristics, it becomes more difficult to explain that difference solely in terms of environmental or historical factors.
In other words, global comparisons inevitably involve many potential confounding factors, since the countries being compared come from very different continents, cultures, climates, and historical paths. In the Middle East, however, a substantial number of these background conditions are shared across the two groups. The region can therefore be viewed as a useful natural laboratory for comparing monarchy and republic—one in which some potential confounding factors are reduced, allowing the relationship between the form of government and economic performance to be examined under more comparable conditions.
Unlike Africa, the Americas, and Oceania, where the number of monarchies is very small, the Middle East contains substantial representation of both forms of government. On one side are the monarchies of Saudi Arabia, Bahrain, Jordan, Kuwait, Oman, Qatar, and the United Arab Emirates. On the other are republics such as Iran, Iraq, Syria, Lebanon, Yemen, and Israel. This relatively balanced representation, combined with the broad regional similarities among these countries, gives this comparison particular analytical value.
For this reason, the analysis in this section is more than simply another regional comparison. It represents one of the most important tests of the book’s central hypothesis. If the pattern observed at the global level also appears in the Middle East, such a finding would strengthen the hypothesis that the form of government may be one of the factors associated with differences in countries’ performance. As with any observational study, however, these results cannot by themselves establish a causal relationship. They can nevertheless provide important empirical evidence relevant to that hypothesis.
It is now time to put this natural laboratory to the test—a region in which monarchies and republics have existed side by side for decades within a broadly shared historical and regional setting, allowing their records to provide one of the clearest empirical tests of the relationship between form of government and economic performance.
Comparison of GDP per Capita between Monarchies and Republics in the Middle East
Descriptive Statistics for the Middle East
Having explained the importance of the Middle East as a natural laboratory for comparing monarchy and republic, we can now begin by examining the descriptive statistics for the two groups.
This study includes 7 monarchies and 10 republics in the Middle East. The results reveal a striking difference in their economic performance.
Mean GDP per capita is $37,678 among Middle Eastern monarchies, compared with $12,115 among the region’s republics. In other words, average GDP per capita in Middle Eastern monarchies is more than three times that of the region’s republics.
The median shows the same pattern. Median GDP per capita is $29,084 among the monarchies and $4,008 among the republics. Because the median is less sensitive than the mean to extremely high values, the fact that both measures point in the same direction suggests that the observed difference is not simply the result of one or two exceptionally wealthy countries, but is also visible in the broader distribution of the data.
The standard deviation is higher among the monarchies ($24,419) than among the republics ($16,500). This indicates that although the region’s monarchies generally have higher income levels, there is also considerable variation within the group. Jordan’s GDP per capita, for example, is far below that of Qatar or the United Arab Emirates. Despite this variation, however, the overall level of GDP per capita remains substantially higher among the monarchies.
Group |
Number of Countries |
Mean |
Median |
Sample Standard Deviation |
Monarchies |
7 |
$37,678 |
$29,084 |
$24,419 |
Republics |
10 |
$12,115 |
$4,008 |
$16,500 |
Statistical Test
To determine whether the difference between the two group means can reasonably be distinguished from random variation, Welch’s t-test was applied. The two-sided test produced the following results:
t = 2.272, df = 10.44, p = 0.045
The difference in mean GDP per capita between Middle Eastern monarchies and republics is therefore statistically significant at the 5% level.
The estimated effect size, Hedges’ g = 1.124, also indicates a large effect. Thus, the difference between the two groups is not only statistically detectable but also substantial in magnitude.
Interpretation
These results are important for several reasons. First, the difference between the group means is substantial. Second, the fact that both the mean and the median point in the same direction suggests that the gap is not simply driven by a few exceptionally wealthy countries. Third, the difference appears within a region whose countries share many more historical, cultural, and geographical characteristics than the countries included in a global comparison.
For this reason, the Middle Eastern findings are particularly informative. Although descriptive statistics alone cannot establish a definitive conclusion—and the small number of countries calls for appropriate caution—they provide an initial indication that the same broad pattern previously observed globally and in Asia and Europe is also present within this natural laboratory.
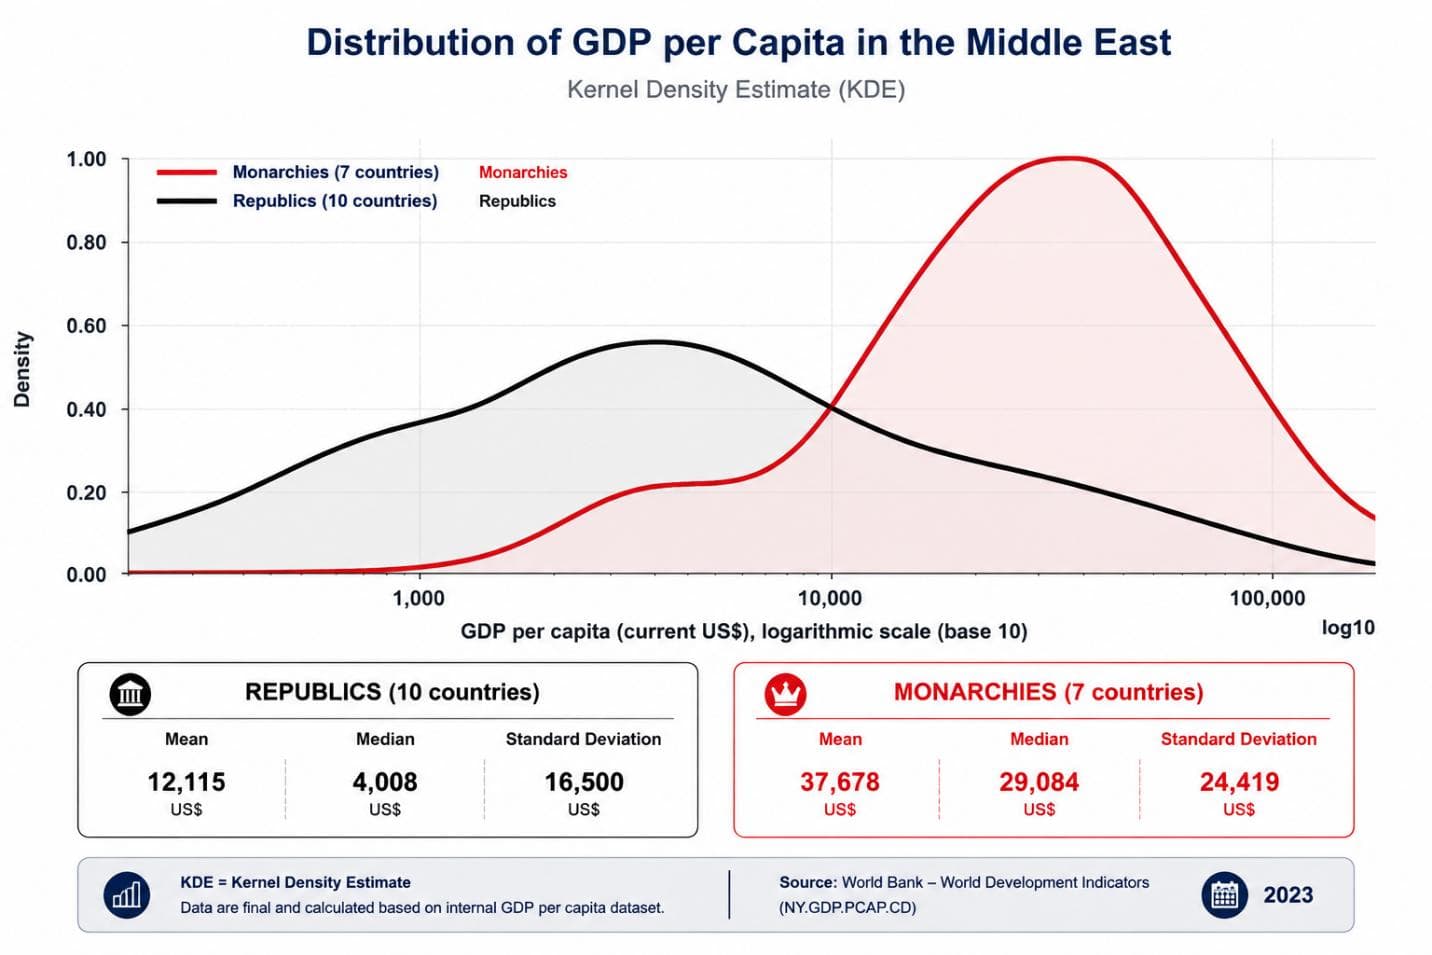
The distribution shows a clear shift toward higher GDP per capita among Middle Eastern monarchies compared with the region’s republics. Monarchies have both a substantially higher mean ($37,678 vs. $12,115) and median ($29,084 vs. $4,008), indicating that the difference is not driven solely by one or two exceptionally wealthy countries. The republican distribution is concentrated much more heavily at lower income levels, whereas the monarchy distribution peaks considerably farther to the right.
Although the two distributions overlap, the overall pattern indicates a pronounced descriptive economic advantage for monarchies in the region. This visual evidence is consistent with the Welch’s t-test reported in the analysis (p ≈ 0.045) and the large effect size (Hedges’ g ≈ 1.12), while not by itself establishing a causal relationship between regime type and economic performance.