

Monarchy & Republic in the Laboratory of History by N. Fakhr - HTML preview
Download the book in PDF, ePub for a complete version.
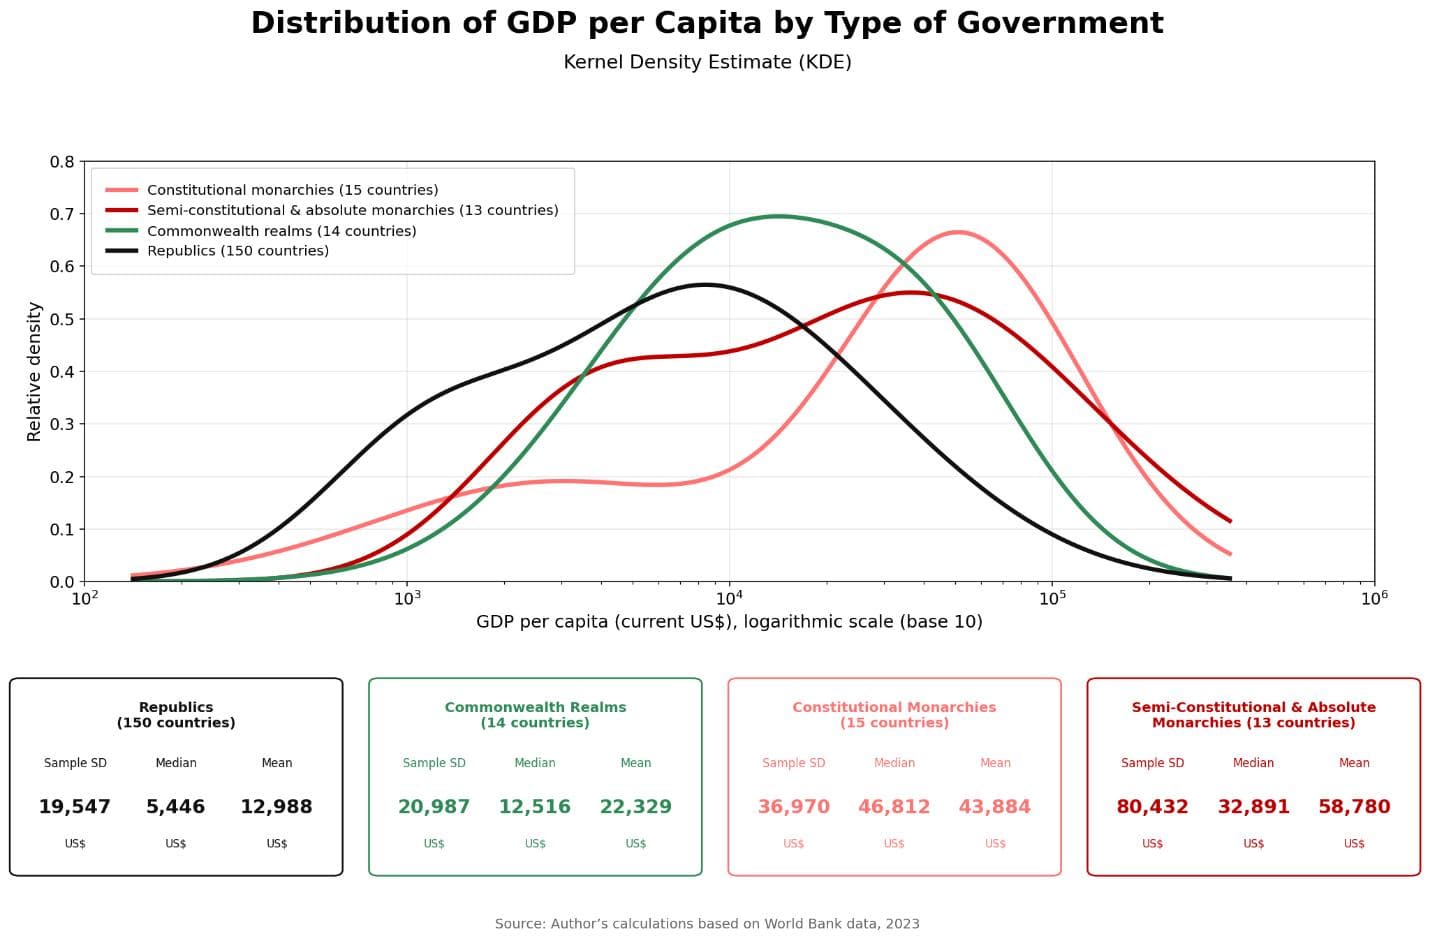
The chart shows that the distribution of GDP per capita in all three monarchy-related groups is, overall, shifted toward higher values than in the republics. Constitutional monarchies, with a median of about $46,812, show the greatest concentration at higher income levels, and their distribution is also relatively more compact. Semi-constitutional and absolute monarchies have the highest mean, but their broader curve indicates much greater variation, with both middle-income countries and a few exceptionally wealthy countries within the group.
The Commonwealth realms occupy an intermediate position between the other monarchy groups and the republics. Both their mean and median are higher than those of the republics, although the gap is smaller than for the other two monarchy groups. By contrast, the republics are more heavily concentrated at lower levels of GDP per capita and have the lowest mean and median of all four groups.
Overall, the chart reveals a fairly clear descriptive pattern: constitutional monarchies are most concentrated at higher income levels; semi-constitutional and absolute monarchies have a very high mean but much greater dispersion; the Commonwealth realms occupy an intermediate position; and republics are concentrated mainly in the lower part of the distribution. However, the overlap between the curves shows that the groups are not completely separate, and the chart alone cannot establish statistical significance or a causal relationship.