

Monarchy & Republic in the Laboratory of History by N. Fakhr - HTML preview
Download the book in PDF, ePub for a complete version.
Global Comparison of GDP per Capita: Monarchies and Republics
Now that we have introduced GDP per capita as our first measure of welfare, we can compare monarchies and republics using this indicator.
The data in this section are drawn primarily from the World Bank database for 2023 (Appendix RDS-A01). In the few cases where 2023 data were unavailable for a country, the most recently published figure was used in order to include as many countries as possible in the analysis.
We will first examine the distribution of the data and the descriptive statistics for the two groups. We will then use a statistical test to determine whether the observed difference between their mean GDP per capita values is statistically significant.
One of the first questions readers may ask is whether any apparent advantage of monarchies is simply driven by a handful of oil-rich countries with exceptionally high incomes. This is an entirely reasonable question and one that should not be overlooked. Later in this chapter, we will therefore examine oil-rich countries separately to better understand how much this factor may be influencing the results.
Before turning to the statistical tests, however, let us first look at the distribution of GDP per capita across the two groups.
Descriptive Statistics for GDP per Capita
The kernel density distribution provides an overall picture of the difference between the two groups. For a more precise comparison, however, we also need to examine the main descriptive statistics. The table below shows the number of countries in each group, along with the mean, median, standard deviation, minimum, and maximum GDP per capita.
Statistic |
Monarchies |
Republics |
Number of countries |
28 |
150 |
Mean GDP per capita |
$50,800 |
$12,988 |
Median |
$34,654 |
$5,446 |
Sample standard deviation |
$60,342 |
$19,547 |
Minimum |
$921 |
$250 |
Maximum |
$256,800 |
$106,819 |
The values in the table were calculated from data for 28 monarchies and 150 republics.
The first striking difference between the two groups is their mean. Average GDP per capita is approximately $50,800 in monarchies, compared with $12,988 in republics. Thus, the average GDP per capita of monarchies is about 3.91 times that of republics. The absolute difference between the two means is approximately $37,812 per person.
The mean alone, however, is not enough to describe these data, since a small number of countries with exceptionally high values can pull the average upward. This makes the comparison of medians particularly important. The median GDP per capita is approximately $34,654 among monarchies and $5,446 among republics. In other words, the median GDP per capita of monarchies is about 6.36 times that of republics.
This suggests that the observed difference between the two groups is not simply the result of a few exceptionally high values at the upper end of the distribution. Even when we use the median, which is less sensitive to extreme values, a substantial gap between the two groups remains.
In both groups, the mean is higher than the median. This is consistent with the shape of the distribution and indicates that GDP per capita in both groups is skewed toward higher values. Among monarchies, countries such as Monaco, Liechtenstein, and Luxembourg are found at the upper end of the distribution, while among republics, Ireland, Switzerland, Singapore, and the United States occupy the higher end.
The standard deviation is also considerably larger among monarchies. The sample standard deviation is approximately $60,342 for monarchies, compared with $19,547 for republics. This indicates that monarchies form a much more diverse group in terms of GDP per capita: they include countries with values below $1,000 as well as countries with values above $200,000.
The range of the data tells a similar story. Among monarchies, GDP per capita ranges from approximately $921 in Lesotho to about $256,800 in Monaco. Among republics, it ranges from approximately $250 in Burundi to about $106,819 in Ireland.
Overall, the descriptive statistics reveal three main features of the data. First, both the mean and the median GDP per capita are substantially higher among monarchies than among republics. Second, GDP per capita varies more widely among monarchies. Third, the distributions of both groups are asymmetric and influenced by very high values at the upper end.
The descriptive statistics therefore reveal a substantial difference between the two groups, but they do not yet tell us how statistically reliable that difference is, given the variability of the data and the unequal number of countries in the two groups. To answer that question, the next section examines the difference between the means using Welch’s t-test.
Statistical Inference
So far, the distribution graph and descriptive statistics have given us an initial picture of the difference between monarchies and republics. One question, however, remains: does the observed difference reflect a genuine difference between the two groups, or could it simply be the result of natural variation in the data?
This is the question addressed by inferential statistics. While descriptive statistics summarize and describe the available data, inferential statistics help us determine whether the patterns we observe are also statistically reliable.
Because the same method will be used repeatedly in later chapters, it is useful to explain its basic principles here once. Readers who are not interested in the methodological details may skip this section and go directly to the test results, since each result will be interpreted in plain language. Those who would like a more detailed understanding of the methodology can refer to the Research Methodology appendix, which provides a fuller discussion of the research design, the theoretical basis of the statistical tests, the selection of indicators, and the limitations of the study.
In this study, differences between the means of two groups are tested using Welch’s t-test. This test is designed to compare the means of two independent groups and is particularly appropriate when the groups differ in size or when the variability of their data is unequal.
Both conditions apply in the present study. The number of monarchies and republics is not the same, and, as we saw in the descriptive statistics, the variability in GDP per capita also differs substantially between the two groups. Welch’s t-test was therefore chosen to assess whether the difference between their means is statistically significant.
The logic of the test is straightforward. We begin by assuming that there is no real difference between the means of the two groups and that the observed difference is simply the result of random variation in the data. This assumption is known as the null hypothesis (H₀).
The alternative hypothesis (H₁), by contrast, states that the two group means are different and that the observed difference cannot be attributed to chance alone.
The test then calculates how likely it would be, if the null hypothesis were true, to observe a difference as large as the one found in the data—or an even larger one. This probability is expressed by the p-value.
Following common practice in the social and empirical sciences, this study uses a significance level of 0.05. If the p-value is below 0.05, the null hypothesis is rejected and the observed difference is considered statistically significant.
Statistical significance, however, does not by itself establish a causal relationship. The test tells us only that the observed difference is unlikely to be explained by chance alone. Understanding why the difference exists, and what other factors may contribute to it, requires further analysis.
The same statistical approach will be applied throughout the following chapters, where appropriate to the nature of each indicator. This explanation therefore provides the methodological foundation for the statistical analyses used throughout the book.
Now that the basis of the inferential method is clear, we can examine the test results for GDP per capita in monarchies and republics.
Statistical Significance Test for the Difference in GDP per Capita
Having examined the distribution of the data, calculated the descriptive statistics, and introduced the method of statistical inference, we can now ask whether the observed difference in GDP per capita between monarchies and republics is also statistically significant.
For this purpose, Welch’s t-test was applied to data from 28 monarchies and 150 republics. As explained in the previous section, this test is appropriate for comparing the means of two independent groups when their sample sizes and levels of variability differ. The results are presented below.
Statistic |
Value |
Number of monarchies |
28 |
Number of republics |
150 |
Mean for monarchies |
$50,800 |
Mean for republics |
$12,988 |
Difference in means |
$37,812 |
t-statistic |
3.284 |
Welch’s degrees of freedom |
28.07 |
p-value |
0.00275 |
95% confidence interval for the mean difference |
$14,228 to $61,397 |
Effect size (Hedges’ g) |
1.27 |
The test yields a p-value of approximately 0.00275, well below the significance level of 0.05. We therefore reject the null hypothesis that the two groups have equal mean GDP per capita. In other words, the observed difference between monarchies and republics is unlikely to be explained by random variation alone and is statistically significant.
The effect size, which measures the magnitude of the difference, is approximately 1.27 (Hedges’ g = 1.27). This indicates that the difference between the two groups is not only statistically significant but also large in practical terms. In addition, the 95% confidence interval for the difference between the means ranges from approximately $14,228 to $61,397. Because the entire interval lies above zero, it further supports the finding that mean GDP per capita is higher among monarchies than among republics.
Statistical significance, however, does not by itself explain the cause of this difference. One important question is whether oil-rich countries with exceptionally high incomes are driving up the average among monarchies. In the next section, we therefore repeat the comparison after excluding oil-rich countries to assess how much this factor may be contributing to the result.
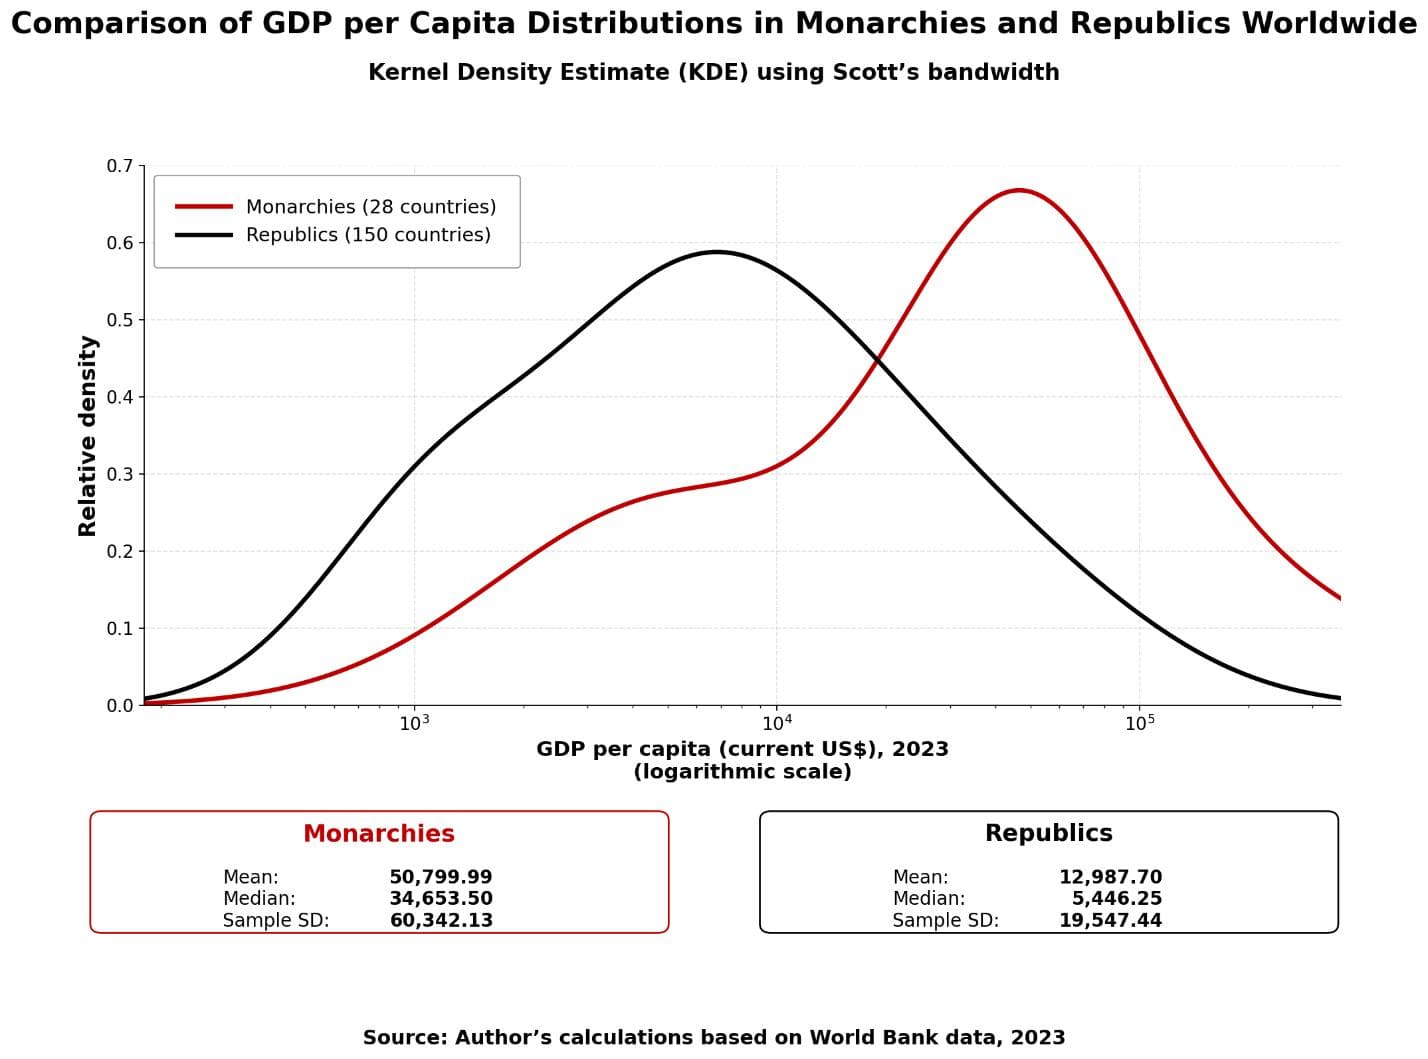
The chart shows that the distribution of GDP per capita among monarchies is, overall, shifted toward higher values than the distribution among republics. Most republics are concentrated at lower levels of GDP per capita, while the monarchy curve shows greater density at higher levels.
At the same time, the considerable overlap between the two curves indicates that the groups are not completely separate. Both include countries with a wide range of income levels. The broad and asymmetric shape of the distributions also reflects the substantial variation within each group.
Overall, the chart is descriptively consistent with the summary statistics: both the mean and the median GDP per capita are substantially higher among monarchies than among republics. The chart alone, however, is not sufficient to establish statistical significance or a causal relationship. These questions must be examined using descriptive statistics and inferential tests.
Excluding Oil-Rich Countries from the Sample
One question that may arise when interpreting the results of this chapter is whether the higher average GDP per capita among monarchies is simply driven by a handful of oil-rich countries with exceptionally high incomes. To address this possibility, the statistical analysis was repeated after excluding the world’s major oil powers.
Before conducting this analysis, however, we first need to define what is meant by an “oil-rich country.” In this study, countries are classified as oil-rich on the basis of their proven oil reserves, rather than their level of oil production or exports.
The reason for this choice is that oil reserves can largely be regarded as a natural and geological endowment. Unlike the way those resources are managed and exploited, their existence is not directly the result of the quality of governance, economic policies, or government performance. Oil production and exports, by contrast, may be influenced by factors such as technology, investment, international sanctions, OPEC quotas, extraction capacity, economic decisions, and other government policies. Since this study examines the relationship between political systems and national performance, using oil production or exports to identify oil-rich countries could introduce part of the effect of government performance into the control variable itself, potentially biasing the analysis. Proven oil reserves therefore provide a more appropriate measure for controlling for the natural endowment of oil.
The next step is to determine a threshold that separates the world’s major oil powers from other countries. This threshold should not be entirely arbitrary, since doing so could raise the concern that it was chosen specifically to strengthen a particular result. For this reason, the threshold used in this study was determined from the actual distribution of the data.
To do this, countries were ranked in descending order by their proven oil reserves (Appendix RDS-O01), and the differences between successive values were examined. The results showed a noticeable drop after countries with approximately 25 billion barrels or more in proven reserves. Beyond this point, countries with medium and smaller reserves begin to appear. This clear natural break in the distribution provides a reasonable boundary for distinguishing the world’s major oil powers from other countries.
Accordingly, this study defines countries with at least 25 billion barrels of proven oil reserves as major oil powers. This definition is not based on a purely subjective cutoff, but on the structure of the observed data distribution, giving the threshold a methodological basis.
The 25-billion-barrel threshold does not, of course, imply that countries below it have no significant oil resources. Many countries with smaller reserves are still important oil producers. The purpose of this analysis, however, is not to exclude every country that possesses oil, but rather to remove those countries whose exceptionally large reserves place them among the world’s major oil powers and give them an unusual natural advantage. The threshold should therefore be understood as a methodological tool for controlling for this natural advantage, rather than as an absolute dividing line between oil and non-oil countries.
Using this criterion, fourteen countries were classified as major oil powers:
- Venezuela
- Saudi Arabia
- Iran
- Canada
- Iraq
- Kuwait
- United Arab Emirates
- Russia
- United States
- Libya
- Nigeria
- Kazakhstan
- China
- Qatar
Of these fourteen countries, thirteen were included in the main sample comparing monarchies and republics and were therefore excluded from the robustness analysis: four monarchies and nine republics. Canada, as a Commonwealth realm, was included in the separate analysis of Commonwealth countries and was not part of the main sample of 28 monarchies and 150 republics. Its exclusion therefore did not affect the size of the main sample.
All statistical calculations—including the descriptive statistics and Welch’s t-test—were then repeated using the remaining countries. This allows us to examine whether the observed difference between monarchies and republics persists after controlling for the possible influence of exceptionally large oil reserves.
It is important to emphasize that this analysis is a robustness test, not a replacement for the main analysis. Its purpose is to assess how stable the original findings remain after removing one of the most important potential sources of bias.
Descriptive Statistics After Excluding Oil-Rich Countries
After the major oil powers were excluded, mean GDP per capita was $50,921 among monarchies and $12,787 among republics. Thus, even after excluding these countries, the average GDP per capita of monarchies remained approximately 3.98 times that of republics.
The medians also show a substantial difference. Median GDP per capita was $33,192 among monarchies and $5,320 among republics. In other words, the median GDP per capita of monarchies was approximately 6.24 times that of republics.
Because the median is less sensitive than the mean to exceptionally high values, this finding suggests that the observed difference cannot be attributed simply to the presence of a few extremely wealthy countries. The gap is also clearly visible at the center of the two distributions.
The sample standard deviation was approximately $64,926 among monarchies and $19,220 among republics. The greater dispersion among monarchies indicates that, even after the major oil powers are excluded, this group still includes a diverse range of low-income, middle-income, and very wealthy countries.
Statistical Significance Test After Excluding Oil-Rich Countries
To determine whether the observed difference between monarchies and republics persists after excluding the major oil powers, Welch’s t-test was applied. As explained earlier, this test is appropriate for comparing the means of two independent groups with unequal sample sizes and variances.
The hypotheses were defined as follows:
- Null hypothesis (H₀): The mean GDP per capita of monarchies and republics is equal.
- Alternative hypothesis (H₁): The mean GDP per capita of the two groups is different.
As in the main analysis, the significance level was set at 0.05.
Test Results
Statistic |
Value |
Number of monarchies |
24 |
Number of republics |
141 |
Mean for monarchies |
$50,921 |
Mean for republics |
$12,787 |
Difference in means |
$38,134 |
t-statistic |
2.856 |
Welch’s degrees of freedom |
23.69 |
p-value |
0.0088 |
95% confidence interval |
$10,559 to $65,709 |
Effect size (Hedges’ g) |
1.26 |
Since the p-value (≈ 0.0088) is below the significance level of 0.05, the null hypothesis is rejected. Thus, even after excluding the major oil powers, the difference in mean GDP per capita between monarchies and republics remains statistically significant.
The effect size, Hedges’ g ≈ 1.26, is also considered large by conventional standards. The observed difference is therefore not only statistically significant but also substantial in magnitude.
The 95% confidence interval for the difference between the means ranges from approximately $10,559 to $65,709. Since the entire interval lies above zero, the data are not consistent with equal group means. More precisely, under the statistical method used here, the estimated interval contains only positive values for the difference between the two means.
Comparison with the Initial Analysis
Statistic |
Initial Analysis |
After Excluding Oil-Rich Countries |
Number of monarchies |
28 |
24 |
Number of republics |
150 |
141 |
Mean for monarchies |
$50,800 |
$50,921 |
Mean for republics |
$12,988 |
$12,787 |
Difference in means |
$37,812 |
$38,134 |
t-statistic |
3.284 |
2.856 |
Welch’s degrees of freedom |
28.07 |
23.69 |
p-value |
0.00275 |
0.0088 |
Hedges’ g |
1.27 |
1.26 |
This comparison shows that excluding the major oil powers reduced the t-statistic and increased the p-value. This change, however, was not caused by a reduction in the difference between the two group means. On the contrary, the mean difference increased slightly, from approximately $37,812 in the initial analysis to about $38,134 after the oil-rich countries were excluded. The smaller sample size and the resulting increase in the standard error of the mean difference caused the t-statistic to fall and the p-value to rise.
The group means themselves also reveal an interesting pattern. After the major oil powers were excluded, the mean for monarchies increased slightly from $50,800 to $50,921, while the mean for republics declined from $12,988 to $12,787. As a result, the ratio between the two means increased from approximately 3.91 in the initial analysis to about 3.98 after the exclusion of the major oil powers.
The effect size changed only slightly, from 1.27 to 1.26, and remained within the range generally considered large. Overall, excluding the major oil powers did not alter the main finding. In fact, the raw difference between the two group means became slightly larger. Despite the reduction in statistical power resulting from the smaller sample, the difference in mean GDP per capita between monarchies and republics remained statistically significant and substantial in magnitude.
Conclusion
This analysis can be regarded as a robustness test of the chapter’s main findings. If the higher average GDP per capita among monarchies were driven solely by a handful of major oil-rich countries, we would expect the difference between the two groups to shrink substantially—or lose statistical significance—once those countries were excluded. The results show that this did not happen.
After excluding four monarchies and nine republics with exceptionally large oil reserves, the average GDP per capita of monarchies remained nearly four times that of republics. The median for monarchies was also more than six times that of republics, and Welch’s t-test continued to show a statistically significant difference. The effect size also remained large.
Notably, after these countries were excluded, the difference in mean GDP per capita between the two groups did not decrease; it increased slightly. Thus, in this dataset, the presence of major oil powers does not explain the higher average GDP per capita observed among monarchies compared with republics.
This finding, of course, does not by itself prove that the type of political system causes the observed difference. Many other historical, geographical, institutional, and economic factors may also contribute to it. Nevertheless, the robustness test indicates that exceptionally large oil reserves, on their own, are not sufficient to explain the observed gap between monarchies and republics.
Excluding Oil-Rich Countries and Very Wealthy Microstates
The previous section showed that excluding countries with exceptionally large oil reserves does not eliminate the observed difference between monarchies and republics. However, another possible objection remains: a few very small and exceptionally wealthy monarchies, such as Monaco, Liechtenstein, and Luxembourg, may disproportionately raise the average GDP per capita of monarchies.
Because of their small size, very low populations, and distinctive economic structures, these countries are unusual cases in the global economy. Comparing them directly with more typical countries could therefore produce an exaggerated picture of the economic position of monarchies.
To examine this possibility, a second robustness test was conducted. In this analysis, in addition to the major oil powers, four wealthy monarchical microstates—Monaco, Liechtenstein, Luxembourg, and Andorra—were excluded from the sample. The purpose was to determine whether the difference between the two groups would persist after these exceptional cases were removed, or whether much of the observed gap was driven by a handful of very small and wealthy countries.
After these exclusions, the sample consisted of 20 monarchies and 141 republics.
Descriptive Statistics After Excluding Oil-Rich Countries and Wealthy Microstates
The descriptive statistics are presented below.
Descriptive Statistic |
Monarchies |
Republics |
Number of countries |
20 |
141 |
Mean GDP per capita |
$28,924 |
$12,787 |
Median GDP per capita |
$25,159 |
$5,320 |
Sample standard deviation |
$26,955 |
$19,220 |
Minimum |
$921 |
$250 |
Maximum |
$90,984 |
$106,819 |
After excluding the oil-rich countries and the four wealthy microstates, the mean GDP per capita of monarchies fell substantially. This decline is expected, since several countries with exceptionally high per capita incomes were removed from the monarchy group. Nevertheless, the average GDP per capita of monarchies remained approximately 2.26 times that of republics.
The difference between the medians also remains striking. Median GDP per capita is approximately $25,159 among monarchies and $5,320 among republics. In other words, the median GDP per capita of monarchies is approximately 4.73 times that of republics.
The median is particularly important here because, unlike the mean, it is much less affected by a small number of extremely high values. The substantial gap that remains between the two medians therefore suggests that the observed difference cannot be attributed simply to a handful of exceptionally wealthy countries.
The sample standard deviation is approximately $26,955 among monarchies and $19,220 among republics. Compared with the previous analysis, removing the four exceptionally wealthy microstates greatly reduces the dispersion within the monarchy group. Even so, GDP per capita remains somewhat more dispersed among monarchies than among republics.
Statistical Significance Test
To determine whether the difference between the two group means remained statistically significant after these exclusions, Welch’s t-test was applied once again. This test is appropriate for comparing two groups with unequal sample sizes and different levels of variability.
Statistic |
Value |
Difference between group means |
$16,137 |
Welch’s t-statistic |
2.586 |
Welch’s adjusted degrees of freedom (df) |
21.82 |
p-value |
0.0169 |
95% confidence interval for the mean difference |
$3,188 to $29,086 |
Standardized effect size (Hedges’ g) |
0.79 |
Effect size interpretation |
Moderate to large; very close to the conventional threshold for a large effect |
The p-value indicates how likely it would be, if there were actually no difference between the two group means, to observe a difference this large or larger simply as a result of random variation in the data. Throughout this study, p-values below 0.05 are treated as statistically significant evidence against the hypothesis of equal means.
Since the p-value (≈ 0.0169) is below the significance level of 0.05, the hypothesis of equal group means is rejected. Thus, even after excluding countries with exceptionally large oil reserves and the four very wealthy microstates, the difference in mean GDP per capita between monarchies and republics remains statistically significant.
The 95% confidence interval for the difference between the means ranges from approximately $3,188 to $29,086. Since the entire interval lies above zero, this result is also consistent with a statistically significant difference between the two group means at the 5% level.
The effect size, Hedges’ g, is approximately 0.79. Effect size provides a standardized measure of how substantial the difference between the groups is, independent of the original unit of measurement. Under commonly used approximate guidelines, values around 0.2 are considered small, around 0.5 moderate, and around 0.8 large. The observed value can therefore be described as a moderate-to-large effect, very close to the conventional threshold for a large effect.
These results show that excluding the exceptional cases substantially reduces the magnitude of the difference between the two groups, but does not eliminate it.
Conclusion of the Second Robustness Test
This analysis represents the most stringent robustness test conducted in this chapter. In the first step, countries whose economic position could be strongly influenced by exceptionally large oil reserves were excluded. Four monarchical microstates were then removed because their very small populations and distinctive economic structures could disproportionately raise the average GDP per capita of monarchies.
After these restrictions were applied, mean GDP per capita among monarchies fell from approximately $50,800 in the full sample to about $28,924. This decline shows that the very wealthy microstates do indeed make a substantial contribution to the higher initial average among monarchies. Nevertheless, the mean for monarchies remained more than 2.2 times that of republics, and the difference between the two groups remained statistically significant.
The median shows a similar pattern. Even after these exceptional cases were removed, median GDP per capita among monarchies remained approximately 4.7 times that of republics. This is particularly important because the median is much less sensitive to extremely high values at the upper end of the distribution.
The observed advantage of monarchies on this indicator therefore cannot be attributed solely to a handful of oil-rich countries or exceptionally wealthy microstates. This finding does not, however, mean that the type of government causes the economic difference between the two groups. It shows only that, in the available data, the observed statistical relationship persists even after two important groups of exceptional countries are excluded.
Identifying the causes of this difference would require examining other variables, including institutional quality, historical background, initial levels of development, culture, geography, economic structure, political stability, and public policy.
Summary of the Robustness Tests
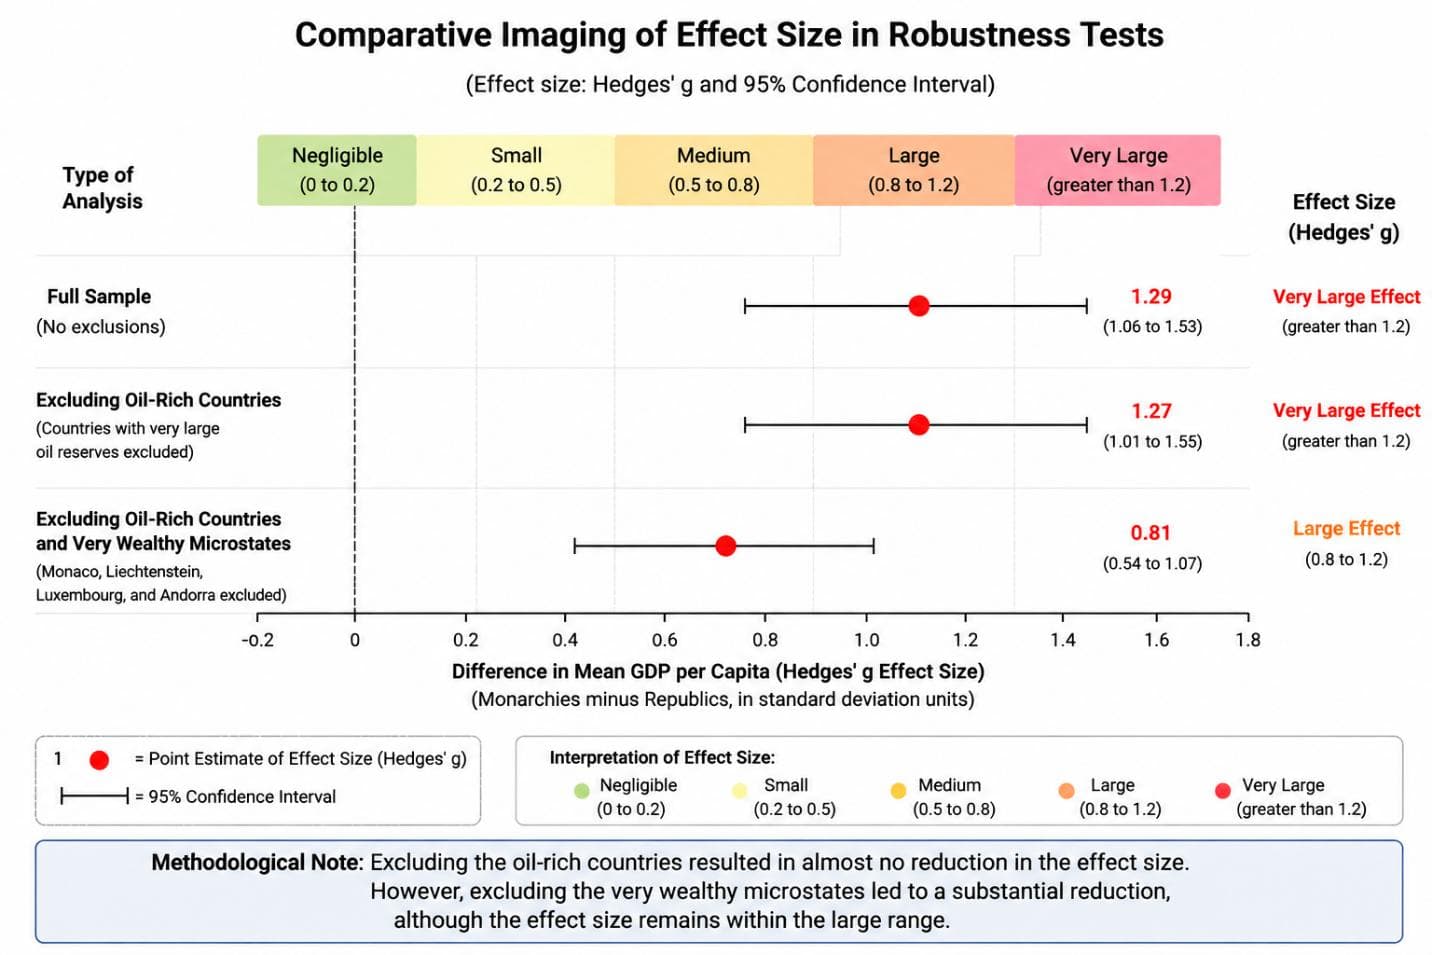
To assess the robustness of the main finding, GDP per capita was compared between monarchies and republics in three stages.
The first analysis included all countries in the original sample. In the second, countries with exceptionally large oil reserves were excluded to determine whether oil wealth was the main factor behind the observed difference. In the third and more stringent analysis, four very wealthy monarchical microstates were also excluded in addition to the major oil powers.
The results of all three analyses are summarized below.
Analysis |
Monarchies |
Republics |
Mean: Monarchies |
Mean: Republics |
Mean Difference |
Welch’s t |
p-value |
Hedges’ g |
Interpretation |
Full sample |
28 |
150 |
$50,800 |
$12,988 |
$37,812 |
3.284 |
0.00275 |
1.27 |
Significant difference with a very large effect size |
Excluding major oil powers |
24 |
141 |
$50,921 |
$12,787 |
$38,134 |
2.856 |
0.0088 |
1.26 |
Significant difference with a very large effect size |
Excluding major oil powers and very wealthy microstates |
20 |
141 |
$28,924 |
$12,787 |
$16,137 |
2.586 |
0.0169 |
0.79 |
Significant difference with a moderate-to-large effect size, close to large |
In this table, the p-value indicates how inconsistent the observed evidence is with the assumption that the two group means are equal. In all three analyses, the p-value is below the 0.05 threshold. The difference between the mean GDP per capita of monarchies and republics therefore remains statistically significant at every stage.
The effect size provides a standardized measure of the magnitude of the difference. In the full sample, the effect size was approximately 1.27. After the major oil powers were excluded, it remained almost unchanged at 1.26. This stability is consistent with the previous analysis and indicates that removing the major oil powers had little effect on the relative magnitude of the difference between the two groups.
In the third analysis, after the four very wealthy microstates were also excluded, the effect size fell to approximately 0.79. This decline indicates that these exceptionally wealthy microstates make a substantial contribution to the magnitude of the initial difference between the two group means. Nevertheless, the resulting effect remains moderate to large, very close to the conventional threshold for a large effect, and the difference remains statistically significant.
The two robustness tests therefore reveal different patterns regarding the source of the observed gap. Excluding the major oil powers produced virtually no reduction in the difference between the means; in fact, the raw mean difference increased slightly. By contrast, removing the very wealthy monarchical microstates substantially reduced the gap. The data therefore suggest that wealthy microstates contribute to the magnitude of the initial difference between the two groups, but their presence is not sufficient to explain the entire gap.
In other words, after approximately controlling for the effect of exceptionally large oil reserves and then removing the smallest and wealthiest monarchies, mean GDP per capita among monarchies remains more than twice that of republics, their median remains nearly five times as high, and the difference between the group means remains statistically significant. The main finding of this chapter therefore cannot be attributed solely to these two groups of exceptional cases.
Global Comparison of GDP per Capita: Constitutional and Non-Constitutional Monarchies
In the previous section, we found that monarchies, on average, have higher GDP per capita than republics, and that the difference is statistically significant. Monarchies, however, are not a completely homogeneous group. In some, the monarch plays a largely symbolic role and political power rests with elected institutions. In others, the monarch continues to exercise substantial executive and political authority.
This raises an important question:
Is the economic advantage observed among monarchies shared by different types of monarchy, or is it mainly associated with one of them?
To examine this question, monarchies were divided into two groups:
- Constitutional monarchies: 15 countries
- Semi-constitutional and absolute monarchies: 13 countries
Each of these groups was then compared separately with the 150 republics.
The analysis proceeds in four stages. First, we examine the distribution of the data. Next, we present the descriptive statistics for each group. We then use Welch’s t-test to assess the differences between the group means. Finally, the results are interpreted in plain language.
This comparison allows us to determine whether the pattern observed in the overall comparison between monarchies and republics is also present in both types of monarchy, or whether the overall result is driven mainly by the performance of one of these two groups.
Descriptive Statistics
To compare the distributions of GDP per capita more closely, the main descriptive statistics were calculated for all three groups. In this section, the term “non-constitutional monarchies” refers collectively to semi-constitutional and absolute monarchies. All monetary values are expressed in current US dollars.
Descriptive Statistic |
Republics |
Constitutional Monarchies |
Semi-Constitutional and Absolute Monarchies |
Number of countries |
150 |
15 |
13 |
Mean GDP per capita |
$12,988 |
$43,884 |
$58,780 |
Median |
$5,446 |
$46,812 |
$32,891 |
Sample standard deviation |
$19,547 |
$36,970 |
$80,432 |
Minimum |
$250 |
$921 |
$3,756 |
First quartile (Q1) |
$1,974 |
$9,298 |
$5,652 |
Third quartile (Q3) |
$14,193 |
$59,380 |
$49,851 |
Maximum |
$106,819 |
$133,231 |
$256,800 |
Coefficient of variation |
1.51 |
0.84 |
1.37 |
Source: Author’s calculations based on the research dataset.
Interpretation of the Descriptive Statistics
The descriptive statistics show that mean GDP per capita is higher in both types of monarchy than in republics.
The mean is approximately 3.38 times higher in constitutional monarchies and 4.53 times higher in semi-constitutional and absolute monarchies than in republics.
The mean, however, can be influenced by a small number of exceptionally wealthy countries. The median therefore provides an important additional perspective. Median GDP per capita in constitutional monarchies is approximately 8.60 times the median in republics, while in semi-constitutional and absolute monarchies it is approximately 6.04 times the median in republics.
Thus, the higher GDP per capita observed among monarchies is not limited to a few exceptionally high values. Even when we use the median, which is less sensitive to extreme values, a substantial gap remains between republics and both types of monarchy.
A comparison of the first quartile shows the same pattern, although less strongly. The first quartile is approximately $9,298 in constitutional monarchies and $5,652 in semi-constitutional and absolute monarchies, compared with approximately $1,974 in republics.
Put simply, even in the lower part of the distribution, GDP per capita values are higher in both groups of monarchies than in republics. As with the other descriptive statistics, however, this comparison describes only the distribution of the observed data and does not by itself provide a basis for statistical inference.
There is, however, considerable variation within the group of semi-constitutional and absolute monarchies. The mean for this group is approximately $58,780, while the median is about $32,891 and the maximum reaches approximately $256,800. The large gap between the mean and median, together with the very high standard deviation, indicates that a few exceptionally wealthy countries strongly stretch the upper end of this group’s distribution.
The coefficient of variation provides another perspective on these differences. Constitutional monarchies, with a coefficient of variation of approximately 0.84, are the most homogeneous of the three groups in relative terms. The corresponding figure is approximately 1.37 for semi-constitutional and absolute monarchies and 1.51 for republics. Relative to their respective means, therefore, republics show the greatest dispersion, while constitutional monarchies show the least.
Overall, the descriptive statistics show that both types of monarchy occupy higher levels than republics in terms of the mean, median, and distributional quartiles. To determine how statistically reliable the differences between the means are, however, inferential tests are required.
Inferential Statistics
To compare mean GDP per capita across the groups, Welch’s t-test was used.
Welch’s test is appropriate when two independent groups have unequal sample sizes and equal variances cannot be assumed. In this study, the number of republics is much larger than the number of countries in either monarchy group, and the variability of the data also differs substantially across the groups. Welch’s test is therefore more appropriate than a t-test that assumes equal variances.
Statistical Hypotheses
For each comparison, the hypotheses were defined as follows:
Null hypothesis (H₀): The mean GDP per capita of the two groups is equal.
Alternative hypothesis (H₁): The mean GDP per capita of the two groups is different.
In symbolic form:
H₀: μₘ = μᵣ
H₁: μₘ ≠ μᵣ
where:
- μₘ is the mean GDP per capita of the monarchy group being examined.
- μᵣ is the mean GDP per capita of the republics.
A two-tailed test was used. This tests whether the two group means differ without assuming in advance which group has the higher mean.
Welch’s t-test Results
Comparison |
Mean Difference |
Welch’s t |
Welch’s df |
Two-tailed p-value |
95% CI for Mean Difference |
Hedges’ g |
Result |
Constitutional monarchies vs. republics |
$30,897 |
3.192 |
14.79 |
0.0061 |
$10,243 to $51,550 |
1.42 |
Statistically significant; very large effect |
Semi-constitutional and absolute monarchies vs. republics |
$45,792 |
2.047 |
12.12 |
0.0629 |
−$2,882 to $94,466 |
1.58 |
Not statistically significant in the two-tailed test; very large effect |
Explanation of the statistics
The Welch t-statistic expresses the difference between the two group means relative to the standard error of that difference. The standard error itself depends on both the variability of the data and the number of observations in each group. The larger the absolute value of the t-statistic, the stronger the statistical evidence against the hypothesis of equal means.
Welch’s degrees of freedom are calculated from the sample sizes and variances of the two groups and are used to determine the reference distribution of the test and its corresponding p-value.
The p-value indicates how compatible a difference this large or larger—in either direction—would be with random variation if the null hypothesis were true. In this study, a p-value below 0.05 is used as the threshold for statistical significance.
The 95% confidence interval provides a range of values for the difference between the two group means that are compatible with the observed data. If this interval does not include zero, the two-tailed test is statistically significant at the 5% level.
Hedges’ g expresses the magnitude of the difference between the two groups in standardized terms. As an approximate guideline, values around 0.2 are generally considered small, around 0.5 moderate, and around 0.8 or higher large.
Interpretation of the Test Results
For constitutional monarchies compared with republics, the difference in mean GDP per capita is approximately $30,897. Welch’s test yields t = 3.192 and p ≈ 0.0061. Since the p-value is well below 0.05, the hypothesis of equal means is rejected. The difference in mean GDP per capita between constitutional monarchies and republics is therefore statistically significant.
The 95% confidence interval for this difference ranges from approximately $10,243 to $51,550 and lies entirely above zero. In addition, the effect size is Hedges’ g ≈ 1.42, indicating a very large difference between the two groups.
The result for semi-constitutional and absolute monarchies requires a more careful interpretation. Their mean GDP per capita is approximately $45,792 higher than that of republics, and the effect size is also very large (Hedges’ g ≈ 1.58). However, the two-tailed Welch test yields p ≈ 0.0629, slightly above the predetermined 0.05 threshold. Under the criterion adopted in this study, the hypothesis of equal means is therefore not rejected in this comparison.
The 95% confidence interval for the mean difference ranges from approximately −$2,882 to $94,466 and includes zero, which is consistent with the significance-test result.
At first glance, a very large effect size alongside a statistically non-significant result may appear contradictory, but there is no contradiction. Effect size measures the magnitude of the observed difference, whereas the p-value depends not only on the size of that difference but also on sample size and variability. The semi-constitutional and absolute monarchy group contains only 13 countries and has a standard deviation of more than $80,000. As a result, the estimated mean for this group carries considerable uncertainty, producing a wide confidence interval.
The results therefore show that the advantage observed in the overall comparison between monarchies and republics appears in both monarchy subgroups in the descriptive statistics and in the magnitude of the effect, but the inferential evidence is not equally strong for the two groups. Among constitutional monarchies, the difference is both large and statistically significant. Among semi-constitutional and absolute monarchies, the observed difference and effect size are even larger, but because of the small number of countries and the very high variability of the data, the two-tailed test does not reach statistical significance at the 0.05 level.
The available data therefore do not support the conclusion that the statistical advantage observed in the full monarchy sample has been established with the same level of confidence for both types of monarchy. What can be stated more precisely is that constitutional monarchies show a clear and statistically significant difference from republics, while semi-constitutional and absolute monarchies show a very large observed difference but also substantial statistical uncertainty because of their small sample size and high variability.
Global Comparison of GDP per Capita: Commonwealth Realms and Republics
In addition to the independent monarchies examined in the previous sections, there is another group of countries whose distinctive legal and historical characteristics make them worth examining separately. These countries are known as the Commonwealth realms. Each is an independent state with its own constitution, parliament, and government, while recognizing the British monarch as its head of state. They should therefore not be regarded as colonies or dependencies of the United Kingdom.
From a constitutional perspective, the Commonwealth realms are forms of constitutional monarchy. However, because they share the same monarch and have a distinct historical and institutional background, they are treated as a separate group in this study.
This distinction is important for two reasons. First, it allows the economic performance of the Commonwealth realms to be assessed without combining them with other monarchies. Second, it allows us to examine whether the pattern observed among other monarchies also appears in this distinctive group.
In this section, 14 Commonwealth realms are compared with 150 republics.
As in the previous sections, the comparison proceeds in four stages:
- Examining the distribution of the data using a Kernel Density Estimate (KDE) plot
- Presenting the descriptive statistics
- Applying Welch’s t-test
- Interpreting the results
Descriptive Statistics
The table below presents the main descriptive statistics for the two groups. All monetary values are expressed in current US dollars.
Descriptive Statistic |
Republics |
Commonwealth Realms |
Number of countries |
150 |
14 |
Mean GDP per capita |
$12,988 |
$22,329 |
Median |
$5,446 |
$12,516 |
Sample standard deviation |
$19,547 |
$20,987 |
Coefficient of variation |
1.51 |
0.94 |
Source: Author’s calculations based on World Bank data.
Interpretation of the Descriptive Statistics
The descriptive statistics show that mean GDP per capita in the Commonwealth realms is approximately 1.72 times that of the republics.
The difference is not limited to the mean. Median GDP per capita in the Commonwealth realms is also approximately 2.30 times that of the republics. This suggests that the descriptive difference is not driven solely by a small number of very wealthy countries, since the median is also substantially higher among the Commonwealth realms.
The coefficient of variation also indicates that the Commonwealth realms are more homogeneous in relative terms. It is approximately 0.94 for the Commonwealth realms, compared with 1.51 for the republics. Thus, GDP per capita shows greater dispersion relative to the group mean among republics.
Overall, the descriptive statistics indicate that the Commonwealth realms have higher GDP per capita than the republics in this dataset. To determine how statistically reliable the difference between the two group means is, however, inferential testing is required.
Inferential Statistics
To compare mean GDP per capita between the two groups, Welch’s t-test was used.
This test is appropriate for comparing two independent groups with unequal sample sizes and different levels of variability, both of which apply to the present comparison.
Statistical Hypotheses
Null hypothesis (H₀):
The mean GDP per capita of the Commonwealth realms and republics is equal.
Alternative hypothesis (H₁):
The mean GDP per capita of the Commonwealth realms and republics is different.
In symbolic form:
H₀: μc = μr
H₁: μc ≠ μr
As in the previous comparisons, a two-tailed test was used. The direction of the difference was therefore not assumed in advance; the test simply examines whether the two group means differ.
Welch’s t-test Results
Statistic |
Value |
Difference between group means |
$9,341 |
Welch’s t-statistic |
1.602 |
Adjusted degrees of freedom (df) |
15.18 |
Two-tailed p-value |
0.1298 |
Effect size (Hedges’ g) |
0.47 |
Effect size interpretation |
Close to moderate |
Interpretation of the Results
Mean GDP per capita in the Commonwealth realms is approximately $9,341 higher than in the republics. However, Welch’s test yields t = 1.602 and p ≈ 0.1298.
Since the p-value is above the 0.05 significance level, the hypothesis of equal means is not rejected in the two-tailed test. Therefore, the available data do not provide sufficient evidence to conclude that the difference in mean GDP per capita between the Commonwealth realms and republics is statistically significant.
This result does not establish that the two groups are equal. In the observed data, the mean for the Commonwealth realms is more than $9,000 higher than that of the republics. However, the Commonwealth group contains only 14 countries, and the data also show considerable variability. As a result, the uncertainty surrounding the estimate is too large for the observed difference to reach statistical significance at the 5% level.
The effect size is Hedges’ g ≈ 0.47. Under commonly used approximate guidelines, values around 0.2 are considered small, around 0.5 moderate, and around 0.8 or higher large. The observed standardized difference can therefore be described as close to a moderate effect.
This result illustrates the distinction between descriptive statistics, effect size, and statistical significance. The descriptive statistics show that the Commonwealth realms in this sample have higher mean and median GDP per capita, and the effect size is not negligible. However, given the limited number of countries in this group, the statistical evidence is insufficient to reject the hypothesis of equal means.
Summary
In the available data, the Commonwealth realms have, on average, a higher GDP per capita than the republics. Their mean GDP per capita is approximately 1.72 times that of the republics, while their median is approximately 2.30 times as high. Relative variability is also lower among the Commonwealth realms.
However, the two-tailed Welch’s t-test indicates that this difference is not statistically significant at the conventional 5% level (p ≈ 0.1298). The effect size is approximately 0.47, which is close to a moderate effect.
Therefore, the most appropriate conclusion is that the Commonwealth realms show a notable descriptive advantage over the republics in this sample, but the available evidence is insufficient to generalize this difference as statistically significant.