LabVIEW Graphical Programming by Serhat Beyenir - HTML preview
Download the book in PDF, ePub, Kindle for a complete version.
are entry and exit ports that exchange information between the front panel and block dia-
gram.
3. Deselect the ❑♥♦❜ terminal by clicking a blank space on the block diagram.
4.
Move the cursor over the arrow of the ❑♥♦❜ terminal, shown in this media.
Notice how the cursor becomes a wire spool, or the ❲✐r✐♥❣ tool, shown at left. Use the
❲✐r✐♥❣ tool to wire objects together on the block diagram.
NOTE: The cursor does not switch to another tool while an object is selected.
5.
When the ❲✐r✐♥❣ tool appears, click the arrow and then click the
❆♠♣❧✐t✉❞❡ input of the ❙✐♠✉❧❛t❡ ❙✐❣♥❛❧ Express VI, shown in this media, to wire the two
objects together. Notice that a wire appears and connects the two objects. Data flows along
this wire from the terminal to the Express VI.
6. Select ❋✐❧❡
❙❛✈❡ to save this VI.
1.5.4 Running the VI
Running a VI executes your solution. Complete the following steps to run the ❆❝q✉✐r✐♥❣ ❛
❙✐❣♥❛❧ VI.
1. Display the front panel by selecting ❲✐♥❞♦✇
❙❤♦✇ ❋r♦♥t P❛♥❡❧ or by clicking the front
panel.
TIP: Press the ❈tr❧✲❊ keys to switch from the front panel to the block diagram or from the
block diagram to the front panel.
2. Click the ❘✉♥ button.
3. Move the cursor over the knob control.
Notice how the cursor becomes a hand, or the
❖♣❡r❛t✐♥❣ tool, shown at left. Use the ❖♣❡r❛t✐♥❣ tool to change the value of a control or
select the text within a control.
4. Using the ❖♣❡r❛t✐♥❣ tool, turn the knob to adjust the amplitude of the sawtooth wave. No-
tice how the amplitude of the sawtooth wave changes as you turn the knob. Also notice that
the y-axis on the graph autoscales to account for the change in amplitude.
To indicate
Available for free at Connexions <http://cnx.org/content/col11408/1.1>

27
that the VI is running, the ❘✉♥ button changes to a darkened arrow, shown at left. You cannot
edit the front panel or block diagram while the VI runs.
5.
Click the ❙t♦♣ button, shown at left, to stop the VI.
NOTE: Although ❆❜♦rt ❊①❡❝✉t✐♦♥ button looks like a stop button, the ❆❜♦rt ❊①❡❝✉t✐♦♥ button
does not always properly close the VI. National Instruments recommends stopping your VIs using
the ❙t♦♣ button on the front panel. Use the ❆❜♦rt ❊①❡❝✉t✐♦♥ button only when errors prevent you
from terminating the application using the ❙t♦♣ button.
1.5.5 Modifying the Signal
Complete the following steps to add scaling to the signal and display the results in the graph on
the front panel.
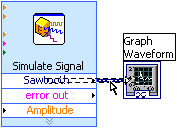
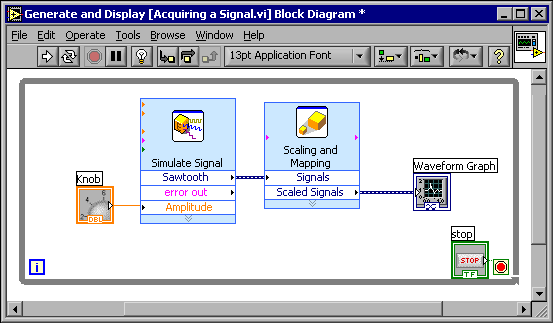
1.
On the block diagram, use the P♦s✐t✐♦♥✐♥❣ tool to double-click the wire
that connects the ❙✐♠✉❧❛t❡ ❙✐❣♥❛❧ Express VI to the ❲❛✈❡❢♦r♠ ●r❛♣❤ terminal shown in
this media.
2. Press the ❉❡❧❡t❡ key to delete this wire.
3. If the ❋✉♥❝t✐♦♥s palette is not visible on the block diagram, select ❲✐♥❞♦✇
❙❤♦✇ ❋✉♥❝t✐♦♥s
P❛❧❡tt❡ to display it.
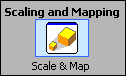
4.
Select the ❙❝❛❧✐♥❣ ❛♥❞ ▼❛♣♣✐♥❣ Express VI, shown at left, on the ❆r✐t❤♠❡t✐❝
✫ ❈♦♠♣❛r✐s♦♥ palette and place it on the block diagram inside the loop between the
❙✐♠✉❧❛t❡ ❙✐❣♥❛❧ Express VI and the ❲❛✈❡❢♦r♠ ●r❛♣❤ terminal. If there is no room between
the Express VI and the terminal, move the ❲❛✈❡❢♦r♠ ●r❛♣❤ terminal to the right. Notice that
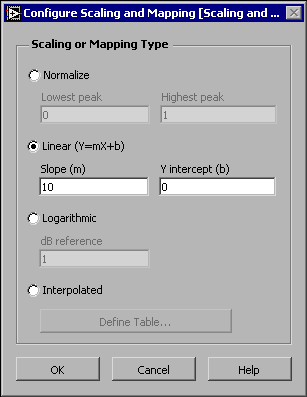
the ❈♦♥❢✐❣✉r❡ ❙❝❛❧✐♥❣ ❛♥❞ ▼❛♣♣✐♥❣ dialog box automatically opens when you place the
Express VI on the block diagram.
5. Define the value of the scaling factor by entering 10 in the ❙❧♦♣❡ ✭♠✮ text box. The ❈♦♥❢✐❣✉r❡
❙❝❛❧✐♥❣ ❛♥❞ ▼❛♣♣✐♥❣ dialog box should appear similar to Figure 1.21.
Available for free at Connexions <http://cnx.org/content/col11408/1.1>
28
CHAPTER 1. INTRODUCTION
Figure 1.21
6. Click the ❖❑ button to apply the current configuration and close the ❈♦♥❢✐❣✉r❡ ❙❝❛❧✐♥❣ ❛♥❞
▼❛♣♣✐♥❣ dialog box.
7. Move the cursor over the arrow on the ❙❛✇t♦♦t❤ output of the ❙✐♠✉❧❛t❡ ❙✐❣♥❛❧ Express VI.
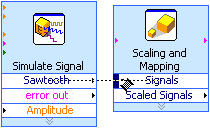
8.
When the Wiring tool appears, click the arrow and then click the
arrow on the ❙✐❣♥❛❧s input of the ❙❝❛❧✐♥❣ ❛♥❞ ▼❛♣♣✐♥❣ Express VI, shown in this media,
to wire the two objects together.
9. Using the ❲✐r✐♥❣ tool, wire the ❙❝❛❧❡❞ ❙✐❣♥❛❧s output of the ❙❝❛❧✐♥❣ ❛♥❞ ▼❛♣♣✐♥❣ Ex-
press VI to the ❲❛✈❡❢♦r♠ ●r❛♣❤ terminal. Notice the wires connecting the Express VIs and
terminals. The arrows on the Express VIs and terminals indicate the direction that the data
flows along these wires. The block diagram should appear similar to Figure 1.22.
Available for free at Connexions <http://cnx.org/content/col11408/1.1>

29
Figure 1.22
NOTE: The terminals in the block diagram are set to display as icons. To display a terminal
as a data type on the block diagram, right-click the terminal and select ❱✐❡✇ ❆s ■❝♦♥ from
the shortcut menu to remove the checkmark.
10. Select ❋✐❧❡
❙❛✈❡ to save this VI.
1.5.6 Displaying Two Signals on the Graph
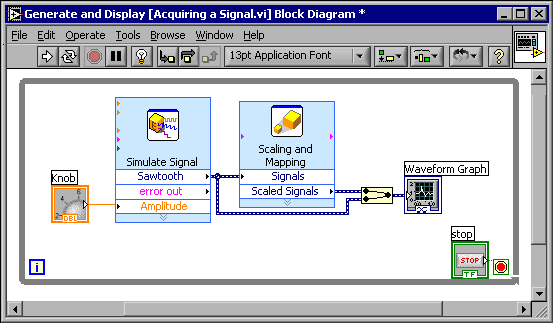
To compare the signal generated by the ❙✐♠✉❧❛t❡ ❙✐❣♥❛❧ Express VI and the signal modified
by the ❙❝❛❧✐♥❣ ❛♥❞ ▼❛♣♣✐♥❣ Express VI on the same graph, use the ▼❡r❣❡ ❙✐❣♥❛❧s function.
Complete the following steps to display two signals on the same graph.
1. Move the cursor over the arrow on the ❙❛✇t♦♦t❤ output of the ❙✐♠✉❧❛t❡ ❙✐❣♥❛❧ Express VI.
2. Using the ❲✐r✐♥❣ tool, wire the ❙❛✇t♦♦t❤ output to the ❲❛✈❡❢♦r♠ ●r❛♣❤ terminal.
The ▼❡r❣❡ ❙✐❣♥❛❧s function, shown in this media, appears where the two wires connect.
This function takes the two separate signals and combines them so that both can be displayed
on the same graph. The block diagram should appear similar to Figure 1.23.
Available for free at Connexions <http://cnx.org/content/col11408/1.1>
30
CHAPTER 1. INTRODUCTION
Figure 1.23
3. Select ❋✐❧❡
❙❛✈❡ to save this VI. You also can press the ❈tr❧✲❙ keys to save a VI.
4. Return to the front panel, run the VI, and turn the knob control. Notice that the graph plots
the sawtooth wave and the scaled signal. Also notice that the maximum value on the y-axis
automatically changes to be 10 times the knob value. This scaling occurs because you set the
slope to 10 in the Scaling and Mapping Express VI.
5. Click the ❙t♦♣ button.
1.5.7 Customizing the Knob
The knob control changes the amplitude of the sawtooth wave so labeling it ❆♠♣❧✐t✉❞❡ accurately
describes the function of the knob. Complete the following steps to customize the appearance of
a control on the front panel.
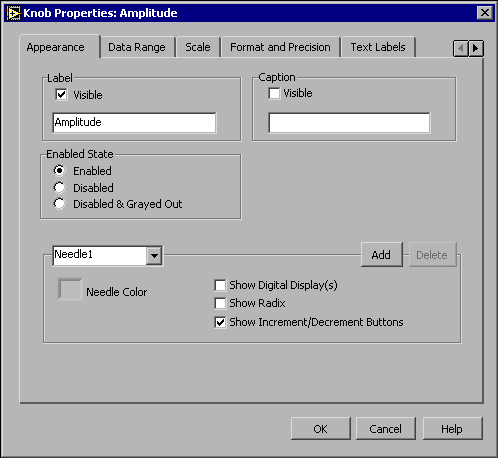
1. Right-click the knob and select Pr♦♣❡rt✐❡s from the shortcut menu to display the ❑♥♦❜
Pr♦♣❡rt✐❡s dialog box.
2. In the ▲❛❜❡❧ section on the ❆♣♣❡❛r❛♥❝❡ tab, delete the label Knob, and type ❆♠♣❧✐t✉❞❡ in the
text box. The ❑♥♦❜ Pr♦♣❡rt✐❡s dialog box should appear similar to Figure 1.24.
Available for free at Connexions <http://cnx.org/content/col11408/1.1>
31
Figure 1.24
3. Click the ❙❝❛❧❡ tab and, in the ❙❝❛❧❡ ❘❛♥❣❡ section, change the maximum value to 5.0.
Notice how the knob on the front panel instantly updates to reflect these changes.
4. Click the ❖❑ button to apply the current configuration and close the ❑♥♦❜ Pr♦♣❡rt✐❡s dialog
box.
5. Save this VI.
TIP:
As you build VIs, you can experiment with different properties and configurations.
You also can add and delete objects. Remember, you can undo recent edits by selecting
❊❞✐t ❯♥❞♦ or pressing the ❈tr❧✲❩ keys.
6. Experiment with other properties of the knob by using the ❑♥♦❜ Pr♦♣❡rt✐❡s dialog box.
For example, try changing the colors for the ▼❛r❦❡r ❚❡①t ❈♦❧♦r by clicking the color box
located on the ❙❝❛❧❡ tab.
7. Click the ❈❛♥❝❡❧ button to avoid applying the changes you made while experimenting. If
you want to keep the changes you made, click the ❖❑ button.
1.5.8 Customizing the Waveform Graph
The ✇❛✈❡❢♦r♠ ❣r❛♣❤ indicator displays the two signals. To indicate which plot is the scaled sig-
nal and which is the simulated signal, you customize the plots. Complete the following steps to
customize the appearance of an indicator on the front panel.
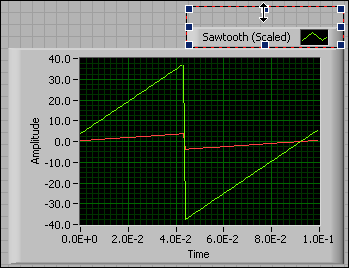
1. Move the cursor over the top of the ♣❧♦t ❧❡❣❡♥❞ on the ✇❛✈❡❢♦r♠ ❣r❛♣❤. Notice that while
there are two plots on the graph, the ♣❧♦t ❧❡❣❡♥❞ displays only one plot.
Available for free at Connexions <http://cnx.org/content/col11408/1.1>
32
CHAPTER 1. INTRODUCTION
2. When a double-headed arrow appears, shown in Figure 1.25, click and drag the border of
the ♣❧♦t ❧❡❣❡♥❞ until the second plot name appears.
Figure 1.25
3. Right-click the ✇❛✈❡❢♦r♠ ❣r❛♣❤ and select Pr♦♣❡rt✐❡s from the shortcut menu to display
the ●r❛♣❤ Pr♦♣❡rt✐❡s dialog box.
4. On the P❧♦ts tab, select ❙❛✇t♦♦t❤ from the pull-down menu. Click the ▲✐♥❡ ❈♦❧♦r color
box to display the ❝♦❧♦r ♣✐❝❦❡r. Select a new line color.
5. Select ❙❛✇t♦♦t❤ ✭❙❝❛❧❡❞✮ from the pull-down menu.
6. Place a checkmark in the ❉♦♥✬t ✉s❡ ✇❛✈❡❢♦r♠ ♥❛♠❡s ❢♦r ♣❧♦t ♥❛♠❡s checkbox.
7. In the ◆❛♠❡ text box, delete the current label and change the name of this plot to ❙❝❛❧❡❞
❙❛✇t♦♦t❤.
8. Click the ❖❑ button to apply the current configuration and close the ●r❛♣❤ Pr♦♣❡rt✐❡s dia-
log box. Notice how the plot color on the front panel changes.
9. Experiment with other properties of the graph by using the ●r❛♣❤ Pr♦♣❡rt✐❡s dialog box.
For example, try disabling the autoscale feature located on the ❙❝❛❧❡s tab.
10. Click the ❈❛♥❝❡❧ button to avoid applying the changes you made while experimenting. If
you want to keep the changes you made, click the ❖❑ button.
11. Save and close this VI.
Available for free at Connexions <http://cnx.org/content/col11408/1.1>
33
1.6 LabVIEW Documentation Resources6
6This content is available online at <http://cnx.org/content/m12199/1.1/>.
Available for free at Connexions <http://cnx.org/content/col11408/1.1>


34
CHAPTER 1. INTRODUCTION
1.6.1 LabVIEW Documentation Resources
Use the ❈♦♥t❡①t ❍❡❧♣ window, the LabVIEW Help, and the NI Example Finder to help you build and edit
VIs. Refer to the LabVIEW Help and manuals for more information about LabVIEW.
1.6.1.1 Context Help Window
The ❈♦♥t❡①t ❍❡❧♣ window displays basic information about LabVIEW objects when you move the
cursor over each object. The ❈♦♥t❡①t ❍❡❧♣ window is visible by default. To toggle display of the ❈♦♥t❡①t
❍❡❧♣ window, select ❍❡❧♣ ❙❤♦✇ ❈♦♥t❡①t ❍❡❧♣, press the ❈tr❧✲❍ keys, or click the ❙❤♦✇ ❈♦♥t❡①t ❍❡❧♣
❲✐♥❞♦✇ button, shown in this media, on the toolbar.
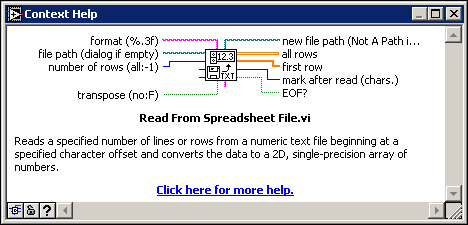
When you move the cursor over front panel and block diagram objects, the ❈♦♥t❡①t ❍❡❧♣ window
displays the icon for subVIs, functions, constants, controls, and indicators, with wires attached to each terminal. When you move the cursor over dialog box options, the ❈♦♥t❡①t ❍❡❧♣ window displays descriptions of those options. In the window, required connections are bold, recommended connections are plain text, and optional connections are dimmed or do not appear. Figure 1.26 shows an example ❈♦♥t❡①t ❍❡❧♣
window.
Figure 1.26: Context Help Window
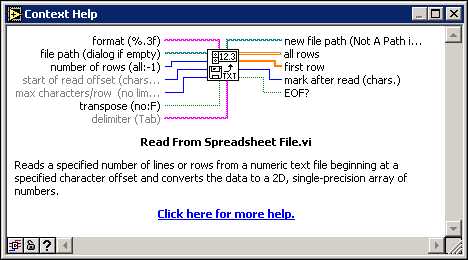
Click the ❍✐❞❡ ❖♣t✐♦♥❛❧ ❚❡r♠✐♥❛❧s ❛♥❞ ❋✉❧❧ P❛t❤ button located on the lower left corner of the
❈♦♥t❡①t ❍❡❧♣ window to display the optional terminals of a connector pane and to display the full path to a VI. Optional terminals are shown by wire stubs, informing you that other connections exist. The detailed mode displays all terminals, as shown in Figure 1.27.
Available for free at Connexions <http://cnx.org/content/col11408/1.1>


35
Figure 1.27: Detailed Context Help Window
Click the ▲♦❝❦ ❈♦♥t❡①t ❍❡❧♣ button to lock the current contents of the ❈♦♥t❡①t ❍❡❧♣ window.
When the contents are locked, moving the cursor over another object does not change the contents of the window. To unlock the window, click the button again. You also can access this option from the ❍❡❧♣ menu.
If a corresponding LabVIEW Help topic exists for an object the ❈♦♥t❡①t ❍❡❧♣ window describes, a
blue ❈❧✐❝❦ ❤❡r❡ ❢♦r ♠♦r❡ ❤❡❧♣✳ link appears in the ❈♦♥t❡①t ❍❡❧♣ window. Also, the ▼♦r❡ ❍❡❧♣ button,
shown at left, is enabled. Click the link or the button to display the LabVIEW Help for more information about the object.
Available for free at Connexions <http://cnx.org/content/col11408/1.1>
36
CHAPTER 1. INTRODUCTION
1.6.1.2 LabVIEW Help
You can access the LabVIEW Help either by clicking the ▼♦r❡ ❍❡❧♣ button in the ❈♦♥t❡①t ❍❡❧♣ window,
selecting ❍❡❧♣
❱■✱ ❋✉♥❝t✐♦♥✱ ✫ ❍♦✇✲❚♦ ❍❡❧♣, or clicking the blue ❈❧✐❝❦ ❤❡r❡ ❢♦r ♠♦r❡ ❤❡❧♣✳ link in
the ❈♦♥t❡①t ❍❡❧♣ window.
The LabVIEW Help contains detailed descriptions of most palettes, menus, tools, VIs, and functions.
The LabVIEW Help also includes step-by-step instructions for using LabVIEW features. The LabVIEW
Help includes links to the following resources:
• LabVIEW Bookshelf, which includes PDF versions of all the LabVIEW manuals and Application
Notes.
• Technical support resources on the National Instruments Web site7 , such as the NI Developer Zone8
, the Knowledge Base9 , and the Product Manuals Library10 .
1.6.1.3 NI Example Finder
The ◆❡✇ dialog box contains many LabVIEW template VIs that you can use to start building VIs. However, these template VIs are only a subset of the hundreds of example VIs included with LabVIEW. You can
modify any example VI to fit an application, or you can copy and paste from an example into a VI that you create.
In addition to the example VIs that ship with LabVIEW, you also can access hundreds of example VIs on the NI Developer Zone at ni.com/zone11 . To search all examples using LabVIEW VIs, use the ◆■ ❊①❛♠♣❧❡
❋✐♥❞❡r. The ◆■ ❊①❛♠♣❧❡ ❋✐♥❞❡r is the gateway to all installed examples and the examples located on the NI Developer Zone.
To launch the ◆■ ❊①❛♠♣❧❡ ❋✐♥❞❡r, select ❍❡❧♣
❋✐♥❞ ❊①❛♠♣❧❡s from the front panel or block diagram
menu bar. You also can launch the ◆■ ❊①❛♠♣❧❡ ❋✐♥❞❡r by clicking the arrow on the ❖♣❡♥ button on the
LabVIEW dialog box and selecting ❊①❛♠♣❧❡s from the shortcut menu.
1.7 Reduce Samples VI12
Exercise 1.7.1
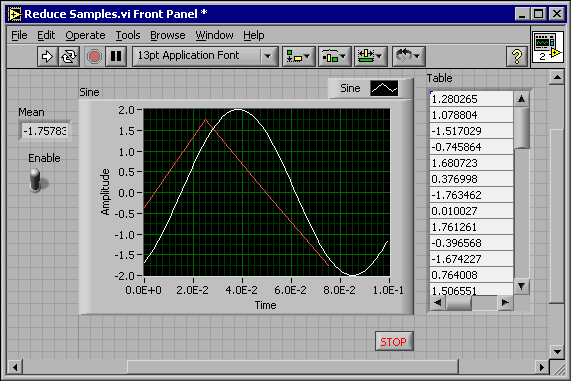
In the following exercises, you will open a blank VI and add Express VIs and structures to the
block diagram to build a new VI. When you complete the exercise, the front panel of the VI will
appear similar to the Figure 1.28.
7http://ni.com
8http://zone.ni.com/zone/jsp/zone.jsp
9http://digital.ni.com/public.nsf/MainPage?OpenForm&node=133020_US
10http://digital.ni.com/manuals.nsf/MainPage?ReadForm&node=132020_US
11http://www.ni.com/zone
12This content is available online at <http://cnx.org/content/m12200/1.2/>.
Available for free at Connexions <http://cnx.org/content/col11408/1.1>


37
Figure 1.28
1.7.1 Opening a Blank VI
If no template is available for the task you want to create, you can start with a blank VI and add
Express VIs to accomplish the specific task. Complete the following steps to open a blank VI.
1. In the ▲❛❜❱■❊❲ dialog box, click the arrow on the ◆❡✇ button and select ❇❧❛♥❦ ❱■ from the
shortcut menu or press the ❈tr❧✲◆ keys to open a blank VI. Notice that a blank front panel
and block diagram appear.
2.
If the ❋✉♥❝t✐♦♥s palette is not visible, right-click any blank space on the block di-
agram to display the ❋✉♥❝t✐♦♥s palette. Click the thumbtack, shown in this media, in the
upper left corner of the ❋✉♥❝t✐♦♥s palette to place the palette on the screen.
NOTE:
You can right-click a blank space on the block diagram or the front panel to display the
❋✉♥❝t✐♦♥s or ❈♦♥tr♦❧s palettes.
1.7.2 Adding an Express VI that Simulates a Signal
Complete the following steps to find the Express VI you want to use and then add it to the block
diagram.
1.
If the ❈♦♥t❡①t ❍❡❧♣ window is not visible, press the ❈tr❧✲❍ keys to open the ❈♦♥t❡①t
❍❡❧♣ window. You also can press the ❙❤♦✇ ❈♦♥t❡①t ❍❡❧♣ ❲✐♥❞♦✇ button, shown in this
media, to open the ❈♦♥t❡①t ❍❡❧♣ window.
Available for free at Connexions <http://cnx.org/content/col11408/1.1>
38
CHAPTER 1. INTRODUCTION
2. Select the ■♥♣✉t palette on the ❋✉♥❝t✐♦♥s palette and move the cursor over the Express VIs
on the ■♥♣✉t palette. Notice that the ❈♦♥t❡①t ❍❡❧♣ window displays information about the
function of each Express VI.
3. From the information provided in the ❈♦♥t❡①t ❍❡❧♣ window, find the Express VI that can
simulate a sine wave signal.
4. Select the Express VI and place it on the block diagram. The ❈♦♥❢✐❣✉r❡ ❙✐♠✉❧❛t❡ ❙✐❣♥❛❧
dialog box appears.
5. Idle the cursor over the various options in the ❈♦♥❢✐❣✉r❡ ❙✐♠✉❧❛t❡ ❙✐❣♥❛❧ dialog box, such
as ❋r❡q✉❡♥❝② ✭❍③✮, ❆♠♣❧✐t✉❞❡, and ❙❛♠♣❧❡s ♣❡r s❡❝♦♥❞ ✭❍③✮. Read the information that
appears in the ❈♦♥t❡①t ❍❡❧♣ window.
6. Configure the ❙✐♠✉❧❛t❡ ❙✐❣♥❛❧ Express VI to generate a sine wave with a frequency of 10.7
and amplitude of 2.
7. Notice how the signal displayed in the ❘❡s✉❧t Pr❡✈✐❡✇ window changes to reflect the con-
figured sine wave.
8. Close the ❈♦♥❢✐❣✉r❡ ❙✐♠✉❧❛t❡ ❙✐❣♥❛❧ dialog box by clicking the ❖❑ button.
9. Move the cursor over the ❙✐♠✉❧❛t❡ ❙✐❣♥❛❧ Express VI and read the information that ap-
pears in the ❈♦♥t❡①t ❍❡❧♣ window. Notice that the ❈♦♥t❡①t ❍❡❧♣ window now displays
the configuration of the ❙✐♠✉❧❛t❡ ❙✐❣♥❛❧ Express VI.
10. Save this VI as ❘❡❞✉❝❡ ❙❛♠♣❧❡s✳✈✐ in the ❈✿\❊①❡r❝✐s❡s\▲❛❜❱■❊❲ ❇❛s✐❝s ■ directory.
1.7.3 Modifying the Signal
Complete the following steps to use the LabVIEW Help to search for the Express VI that reduces
the number of samples in a signal.
1. Select ❍❡❧♣
❱■✱ ❋✉♥❝t✐♦♥✱ ✫ ❍♦✇✲❚♦ ❍❡❧♣ to open the LabVIEW Help.
2. Click the ❙❡❛r❝❤ tab and type s❛♠♣❧❡ ❝♦♠♣r❡ss✐♦♥ in the ❚②♣❡ ✐♥ t❤❡ ✇♦r❞✭s✮ t♦
s❡❛r❝❤ ❢♦r text box. Notice that this word choice reflects what you want this Express VI
to do-compress, or reduce, the number of samples in a signal.
3. To begin the search, press the ❊♥t❡r key or click the ▲✐st ❚♦♣✐❝s button.
4. Double-click the ❙❛♠♣❧❡ ❈♦♠♣r❡ss✐♦♥ topic to display the topic that describes the ❙❛♠♣❧❡
❈♦♠♣r❡ss✐♦♥ Express VI.
5. After you read the description of the Express VI, click the P❧❛❝❡ ♦♥ t❤❡ ❜❧♦❝❦ ❞✐❛❣r❛♠
button to select the Express VI.
6. Move the cursor to the block diagram.
Notice how LabVIEW attaches the ❙❛♠♣❧❡
❈♦♠♣r❡ss✐♦♥ Express VI to the cursor.
7. Place the ❙❛♠♣❧❡ ❈♦♠♣r❡ss✐♦♥ Express VI on the block diagram to the right of the ❙✐♠✉❧❛t❡
❙✐❣♥❛❧ Express VI.
8. Configure the ❙❛♠♣❧❡ ❈♦♠♣r❡ss✐♦♥ Express VI to reduce the signal by a factor of 25 using
the mean of these values.
9. Close the ❈♦♥❢✐❣✉r❡ ❙❛♠♣❧❡ ❈♦♠♣r❡ss✐♦♥ dialog box.
10. Using the ❲✐r✐♥❣ tool, wire the ❙✐♥❡ output in the ❙✐♠✉❧❛t❡ ❙✐❣♥❛❧ Express VI to the
❙✐❣♥❛❧s input in the ❙❛♠♣❧❡ ❈♦♠♣r❡ss✐♦♥ Express VI.
1.7.4 Customizing the Front Panel
In a previous exercise (Section 1.5), you added controls and indicators to the front panel using the
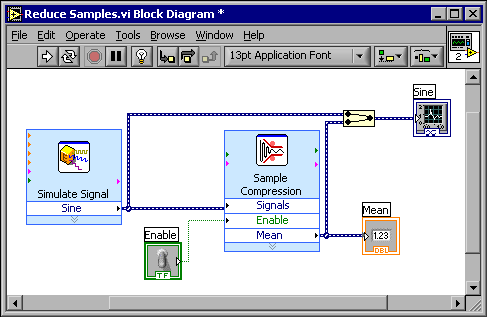
❈♦♥tr♦❧s palette. You also can add controls and indicators from the block diagram. Complete the
following steps to create controls and indicators as shown in Figure 1.29.
Available for free at Connexions <http://cnx.org/content/col11408/1.1>
39
Figure 1.29
1. Right-click the ▼❡❛♥ output in the ❙❛♠♣❧❡ ❈♦♠♣r❡ss✐♦♥ Express VI and select
❈r❡❛t❡ ◆✉♠❡r✐❝ ■♥❞✐❝❛t♦r from the shortcut menu to create a numeric indicator.
2. Right-click the ▼❡❛♥ output of the ❙❛♠♣❧❡ ❈♦♠♣r❡ss✐♦♥ Express VI and select ■♥s❡rt
■♥♣✉t✴❖✉t♣✉t from the shortcut menu to insert the ❊♥❛❜❧❡ input.
3. Right-click