Applied Computational Fluid Dynamics by Hyoung Woo Oh - HTML preview
Download the book in PDF, ePub, Kindle for a complete version.
VALIDATION
CODE
SIMULATED
VERIFICATION
REALITY
Fig. 4. Process of developing CFD code.
Fig. 5. Layout of AL-DEWANYIA WTP
6. Model development, applications and results
6.1 Introduction
The full-scale horizontal settling tanks at the drinking treatment plant of AL-DEWANYIA
were opted for. Most settling tanks of Iraq Water exhibit a horizontal settling tank. This
research was focused on this type of settling tanks.
Figure 5 represents treatment of water obtained from a deep well in AL-DEWANYIA WTP a
The AL-DEWANYIA WTP were built to remove turbidity and organic material.
A Computational Fluid Dynamics Model of Flow and Settling in Sedimentation Tanks
25
6.2 Simulation
To limit computational power requirements, the rectangular settling tank was modeled in
2D. The major assumption in the development of the model is that the flow field is the same
for all positions; therefore, a 2D geometry can be used to properly simulate the general
features of the hydrodynamic processes in the tank. As a first step, a mesh was generated
across the sedimentation tank. As a result, the solutions from the grid of 137,814
quadrilateral elements were considered to be grid independent.
For simulation purposes, the range of the suspended solids was divided into thirteen
distinct classes of particles based on the discretization of the measured size distribution.
The number of classes was selected in order to combine the solution accuracy with short
computing time. Two other numbers, 6 and 15, were tested. While the predictions
obtained using 6 classes of particles were found to be different from those resulting from
the 13 classes, the difference between the predictions made by the 13 and the 15 classes
were insignificant. Therefore, a number of 13 classes were selected as a suitable one.
Within each class the particle diameter is assumed to be constant (Table 1). As it can be
seen in Table 1, the range of particle size is narrower for classes that are expected to have lower settling rates.
Range of particle
Mean particle size
Class
Mass fraction
size (μm)
(μm)
1 10-30
20
0.025
2 30-70
50
0.027
3 70-90
80
0.039
4 90-150
120
0.066
5 150-190
170
0.095
6 190-210
200
0.115
7 210-290
250
0.126
8 290-410
350
0.124
9 410-490
450
0.113
10 490-610
550
0.101
11 610-690
650
0.077
12 690-810
750
0.057
13 810-890
850
0.040
Table 1. Classes of particles used to account for the total suspended solids in the STs in AL-DEWANYIA STs.
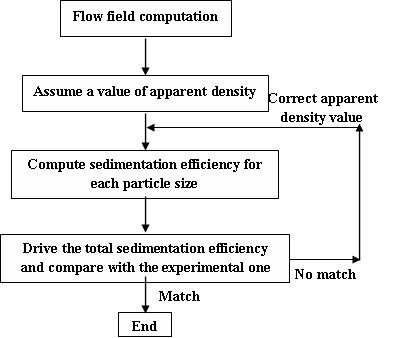
6.3 The influence of particle structure
The settling velocity of an impermeable spherical particle can be predicted from Stokes’ law.
However, the aggregates in the water not only are porous but it is well known that they
have quite irregular shapes with spatial varying porosity. The flow chart of this
computations sequence is presented in Figure 6.
26
Applied Computational Fluid Dynamics
Fig. 6. Flow chart of computation sequence.
6.4 Simulation of existing sedimentation tanks
The AL-DEWANYIA water treatment plant uses lime, and (NH4)2SO4 and Fe2(SO4)3 to
flocculate the and solid concentrations, respectively before entering the sedimentation tanks.
There are 4 rectangular tanks at the AL-DEWANYIA WTP .
The Physical and hydraulic data during study periods, and settling tank data for two WTPs
are shown in Table 2 .
Geometry Value
Tank length
30.0 m
Tank width
4.50 m
Hopper depth
2.50 m
Bottom slop
0.00
Weir length
4.50 m
Weir width
0.70 m
Weir depth
0.50 m
loading Value
SOR
2.7 m/h
Inlet concentration
30-80 mg/l
Density of water
1000 kg/m3
Density of particulate
1066 kg/m3
Tank parameter
Value
Average flow rate
60-80 l/s
Sludge pumping rate
5-15 l/s
Inflow temperature average
4oC -11oC , and 20oC -27oC
Inflow suspended solids
25-80 mg/l
Detention time
2.5-3.6 hr
Cmin 0.17
mg/l
μ 0.002
N.s/m2
Table 2. Physical and hydraulic data during study periods, and settling tank data.
A Computational Fluid Dynamics Model of Flow and Settling in Sedimentation Tanks
27
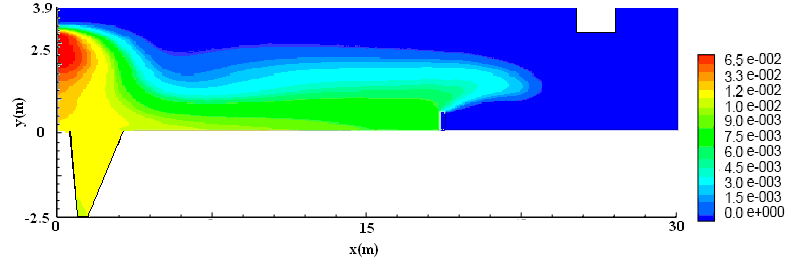
6.4.1 AL-DEWANYIA WTP
Figure 7 shows the velocity profiles of the existing tanks for a flow rate of 80 l/s and an inlet concentration of 50 mg/l (~75 NTU). High velocities are present at the inlet (0.065 m/s). The flow is further accelerated towards the bottom of the hopper due to the density differences
as well as the wedge shape of the hopper. The strong bottom current is balanced by a
surface return current inside the hopper. The velocities near the effluent weir are very low.
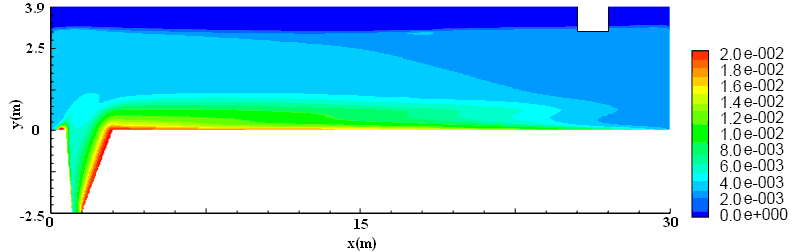
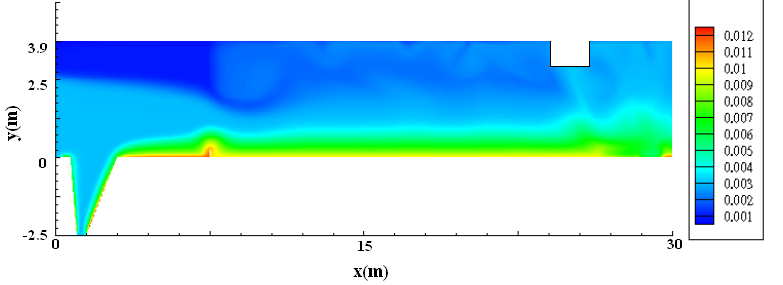
The solids concentration profile is shown in Figure 8. Note the high concentration
downstream of the sludge hopper. The sludge that is supposed to settle in the hopper is
washed out of the hopper into the flat section of the tank. Over time a significant amount of sludge accumulates. According to both the field observations and the modeling of the
existing process, each of the following reasons (or combination of them) may cause the ST
problems, i.e. the flocculant solids blowing out:
1. The location of the existing weir (distributed in a range of 1 meter at the very
downstream end of the ST) cause very strong upward currents, which could be one of
the major reasons that the flocculant solids were blowing out around the effluent area.
2. The strong upward flow is not only related to the small area the effluent flow passes
through but also to the rebound effect between the ST bottom density current and the
downstream wall. The “rebound” phenomenon has been observed and reported by
many operators as well as field investigators, especially in ST with small amounts of
sludge inventory. A reasonable amount of sludge inventory can help dissipate the
kinetic energy of the bottom density current.
3. In the existing operation, the bottom density current must be fairly strong due to the lack of proper baffling and the shortage of sludge inventory in the tank.
Fig. 7. Velocity contours of existing tank (m/s)
Fig. 8. Solids concentration profile for existing tank
28
Applied Computational Fluid Dynamics
7. Simple improvements to the existing sedimentation tank in WTP
Field data collected from the laboratories during the last 3 years was used to analyze the
tank behavior and to enhance the performance of the settling tanks at the AL-DEWANYIA
WT Plant. Several tank modifications including flocculation baffle, energy dissipation
baffles, perforated baffles and inboard effluent launders, were recommend based on their
field investigation
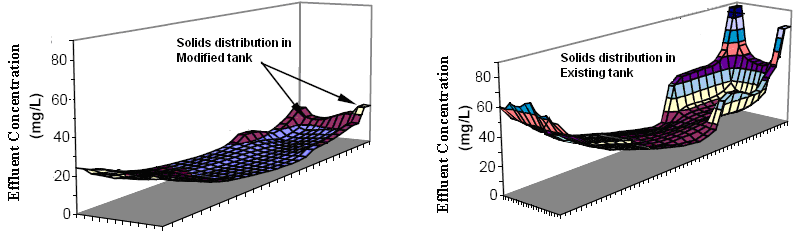
The relationship between the effluent SS and the hydraulic loading is summarised in Table 3
for the existing STs and with different modification combinations. The predicted Effluent SS
(ESS) in Table 3 and Figure 9 indicates that the average ESS can be significantly reduced by improving the tank hydraulic efficiency. The comparison of model predictions with the
subsequent field data indicates that the significantly improvement of STs performance was
obtained by using the minor modifications based on the 2-D computer modeling.
Q=
50
l/s
Q= 70 l/s
Q= 80 l/s
Q= 80 l/s
Influent
Influent
Influent conc.= 50 Influent conc.=
conc.= 40
conc.= 40
mg/l
75 mg/l
mg/l
mg/l
Predicted average effluent concentration
Existing tank
20
30
40
50
Modification 1
12
11
30
22
Modification 2
6
8
12
13
Modification 1 and 2
4
6
7
9
(1) Perforated baffle distance from inlet = 16m; gap above bed = 0.5 m; height above bed =
1.8 m; porosity = 55%
(2) Length of launder = 12 m.
Table 3. Performance data for modelled settling tank
Fig. 9. Comparison of solids distributions on surface layer between existing and modified
tanks
8. Modelling the scraper mechanism
The gravitational (and laminar) flow along the bottom, which may go up to 8-15 mm/s near
the sump, is blocked for 40 minutes of scraper passage. This is clearly seen in Figure 10. The scraper blade thus constrains the bottom flow discharge by counteracting the gravitational
force. Near the floor the velocity increases with height in the shear flow region, but is
obviously limited by the scraper’s velocity.
A Computational Fluid Dynamics Model of Flow and Settling in Sedimentation Tanks
29
Fig. 10. Effect of scraper on solids concentration profiles
9. Design procedures and guidelines
The design procedures are necessarily based on many assumptions, not normally stated as
shortcomings and limitations during the design process. To demonstrate the implications of
these assumptions and the way in which these assumption deviate from real tanks. (Ghawi,
2008) tried to improve design procedure as show in Table 4.
Improved design procedure
Step description
Step 1
Measurement of settling velocity and sludge density
Step 2
Set up of computational grid
Step 3
Simulate tank
Step 4
Evaluate results and check for evidence of the following:
- short circuiting
- high velocities zones
- high overflow concentration
- poor sludge removal
Step 5
If none of the above is present, tank size can be reduced to reduce capital cost.
If problems are evident, adjust the design by adjusting the:
- inlet
- position of sludge withdrawal
- position of overflow launders
Also consider using perforated, porous and deflecting baffles
Step 6
Repeat until a satisfactory tank geometry is obtained and check final geometry
for various process changes such as density, concentration and inflow rate.
Step 7
Asses the influence of the settling velocity and sludge density input
parameters and repeat steps 3 – 6 if necessary.
Table 4. Proposed CFD enhanced design procedure.
30
Applied Computational Fluid Dynamics
10. Temperature effect
Settling velocity correction factor
In order to define a correction factor for the settling velocities based on temperature
difference, the temperature effect on the zone settling velocity has to be determined.
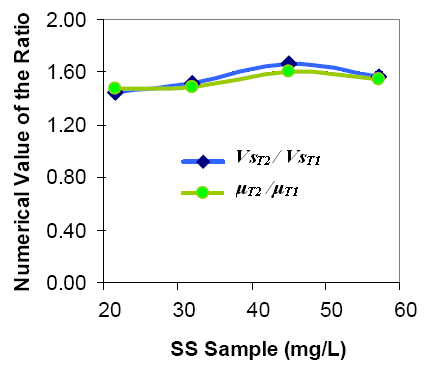
Figure 11 displays graphically the value of the relationship VsT2 / VsT1 and μT2 /μT1 for the data presented in Table 5 at temperatures Ts (summer temperature) and Tw (winter
temperature).
CFD Calculated at summer temperature
SS
Settling velocity V
Inlet
Outlet
Dynamic viscosity μ
mg/l
m/h
temperature
temperature
kg/m.s
oC
oC
60 1.5
27.5 27.5 8.5e-04
50 1.7
27.5 27.5 8.6e-04
25 1.83
26
26
8.7e-04
15 2.52
25.4 25.4
8.8e-04
CFD Calculated at cooled temperature
60 0.95
8
9.2
1.3e-03
50 1.05
6.6
6.8
1.35e-03
25 1.9
7.8 8.8 1.29e-03
15 2.7
7
8.9 1.30e-03
Table 5. Settling velocity and dynamic viscosities for summer and winter temperature.
From Figure 11 can be observed that the numerical values of the ratios VsT2 / VsT1 and μT2
/μT1 are very close, suggesting that an easy correction in the zone settling velocity for
different temperatures can be made with a correction factor based on the dynamic viscosity
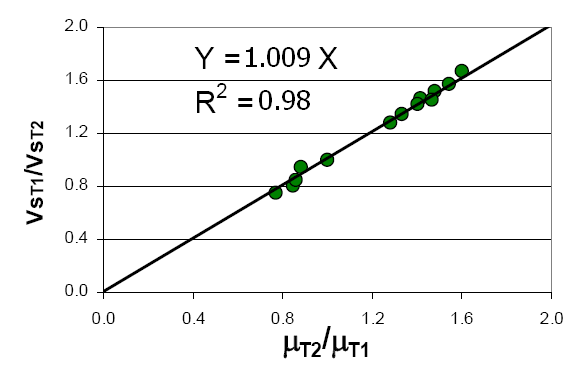
of the water at the two temperatures. Figure 12 shows an extended data set indicating the
relationships between the ratios VsT2 / VsT1 and μT2 /μT1.
Fitting a straight line to the data point presented in Figure 13 can find a correction factor for the settling velocities based on temperature
247.8
T 1 133.15
10
ST
V
S
V T
(1)
247.8
2
1
T 2 133.15
10
Equation 1 can be applied to correct the settling velocities for difference in temperatures in whichever of the four types of sedimentation, i.e., unflocculated discrete settling, and
flocculated discrete settling. Even though equation 1 can be used for a sensitivity analysis on the performance of the model for different seasons, e.g. summer and winter, there is no
evidence that the settling properties can be accurately extrapolated from one season to
another.
A Computational Fluid Dynamics Model of Flow and Settling in Sedimentation Tanks
31
Fig. 11. Ratios of VsT2 / VsT1 and μT2 /μT1 for Different suspended solid (SS) concentrations.
Fig. 12. Effect of Temperature on Settling Velocity.
11. Validation of the model
The validation process involves comparing the model response to actual measured data. The
model was validated using measured data from the AL-DEWANYIA WTPs.
After the development of the hydrodynamic model, and turbulence model, the ST model
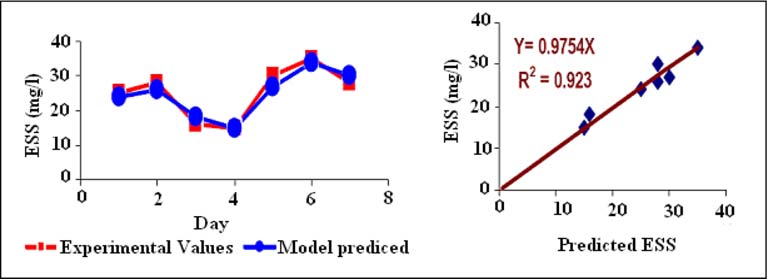
was tested. The ESS predicted by the model was tested during seven days (from a 10 day
period) showing a very good agreement with the field data. Figure 13 presents a comparison
between the experimentally measured and the simulated values of the floc concentration in
the effluent of the existing tanks in AL-DEWANYIA. Apparently, there is a good agreement
between measured and predicted values.
32
Applied Computational Fluid Dynamics
Fig. 13. Validation of the ESS Simulated by the Model
The average values of effluent concentration of improvement are presented in Table 6. The
tank operation conditions in the data collection periods (February-April, 2007, (June-August, 2006)) and the CFD model predictions are very close as shown in Table 6. The comparison of
model predictions with the subsequent field data indicates that the significantly
improvement of tank performance was obtained by using the minor modifications based on
the 2-D computer modeling.
Operation
Effluent concentration (mg/l) and improvement
conditions
Ave.
Baffle and
No
baffle
concentration
launder
Modifications
Modifications
mg/l
Modifications
Field Data
June-August
50 28 - -
2006
Model
47
27
6 (+78%)
5 (+82%)
Predictions
Table 6. Comparison of model predictions with field data
12. Conclusions
The introduction of this study made clear that many factors influence the performance of
settling tanks. They may be categorised as physico-chemical and hydraulic influences. To
account for them in terms of process operation and design, mathematical models may be
utilised. In this respect, Computational Fluid Dynamics (CFD) enables the investigation of
internal processes, such as local velocities and solids concentrations, to identify process in efficiencies and resolve them. Although these complex models demand for considerable
computational power, they may become an option for the study of process operation and
control as computer speed increases. Nowadays, they mostly find applications in the world
of settling tank design.
A Computational Fluid Dynamics Model of Flow and Settling in Sedimentation Tanks
33
The main purpose of this investigation was to develop a CFD ST model capable of
simulating the major processes that control the performance of settling tanks, this goal
was achieved. The accomplished objectives of this research include: the development of a
compound settling model that includes the representation of the settling velocity for the
suspended solids usually encountered in this type of tank (horizontal sedimentation
tanks) the inclusion of iron removal effects, a flocculation sub-model, and a temperature
sub-model.
These types of sub-models have not been previously incorporated in CFD ST models. The
model was rigorously tested and validated. The validation process confirms the utilities and accuracy of the model. An important benefit of this research is that it has contributed to a better understanding of the processes in STs. The results presented in this research clarify important points that have been debated by previous researchers.
This research may also open the discussion for future research and different ways for
improving the performance of existing and new STs. In summary, this research has led to
more complete understanding of the processes affecting the performance of settling tanks,
and provides a useful tool for the optimization of these corn stone units in water treatment.
The major conclusions, general and specifics, obtained from this research are:
1. CFD modeling was successfully used to evaluate the performance of settling tank.
2. The usually unknown and difficult to be measured particle density is found by
matching the theoretical to the easily measured experimental total settling efficiency.
The proposed strategy is computationally much more efficient than the corresponding
strategies used for the simulation of wastewater treatment.
3. Solid removal efficiency can be estimated by calculating solids concentration at effluent.
4. High solid removal efficiency was achieved for all cases tested.
5. Baffling inlet arrangement succeeded in controlling kinetic energy decay.
6. Improved energy dissipation due to an improved inlet configuration.
7. Reduced density currents due to an improved inlet configuration.
8. Improved sludge removal due to the inlet configuration.
9. Troubleshoot existing STs and related process operations.
10. The effluent quality can be improved by more than 60% for any cases.
11. Evaluated ST design under the specified process conditions.
12. Develop reliable retrofit alternatives with the best cost-effectiveness.
13. The changes in temperature on STs play an important role on the performance of STs.
14. Scrape is important in the settling process and play a big role in changing the flow field.
15. In this work we improved the STs guidelines design procedure.
16. The fairly good agreement between model predictions and field data.
In general the study demonstrated that CFD could be used in reviewing settling tank design
or performance and that the results give valuable insight into how the tanks are working. It can be inferred that CFD could be use to evaluate settling tank designs where the tanks are
not functioning properly.
13. Acknowledgement
This chapter is supported by the Scientfic Grant Agency of Ministry of Education-VEGA
Projekt No. 1/1143/11 with at the Department of Sanitary and Environmental Engineering,
Faculty of Civil Engineering, Slovak University of Technology in Bratislava.
34
Applied Computational Fluid Dynamics
14. References
[1] Huggins D.L., Piedrahita R.H., & Rumsey T., (2005). Use of computational fluid
dynamics (CFD) for aquaculture raceway design to increase settling effectiveness,
Aquacult. Eng. 33, 167–180.
[2] Dick, R. I. (1982) Sedimentation Since Camp, J Society of Civil Engrs, 68, 199-235.
[3] Abdel-Gawad, S. M. & McCorquodale, J. A. (1984b). Hydrodynamics of Circular primary clarifiers. Canadian J. Civil Engr. ,11, 299-307.
[4] Adams, E.W. & Rodi, W. (1990). Modelling flow and mixing in sedimentation tanks,
Journal of Hydraulic Engineering, 116(7):895-913, Jul.
[5] Launder, M. & Spalding, D. (1974). The numerical computation of turbulent flows,
Computer methods in appli