Technical Analysis Explained by IFC Markets - HTML preview
Download the book in PDF, ePub, Kindle for a complete version.
Chapter I
What is Technical Analysis?
1.1 Definition of Technical Analysis
Technical analysis is the study of market action primarily through the use of charts for the purpose of forecasting future price trends. By “market action” the following three main sources of information are implied: price, market volume, and open interest, the latter referring only to options and futures.
The terms “price action” and “market action” are very often used interchangeably.
The history of technical analysis goes back to 1900s, and its roots can be found in the Dow Theory developed by Charles Dow. The principles that come from this theory are the price trending, convergence and divergence, as well as support and resistance levels.
Technical analysis is a crucial method of evaluating assets based on the analysis and statistics of past market action, such as past prices and past volume. The main goal of technical analysts is not the measuring of asset’s underlying value, they attempt to use charts or other technical analysis tools to determine patters that will help to forecast future market activity. Their firm belief is that the future performance of markets can be indicated by the historical performance.
1.2. Philosophy of Technical Analysis
Technical approach is based on the following three premises:
• Market action discounts everything.
• Price moves in trends.
• History repeats itself.
Market action discounts everything
This premise is perhaps the most fundamental one, since nothing else coming forth from it can make sense, unless one has completely understood it. Technical analysts believe that each fundamental, political, economic and psychological factor that can possibly affect the price, is reflected in the price of the market. All that they claim is that price action should reflect changes in supply and demand.
Together with the increase of demand the price will rise, and, conversely, if supply exceeds demand, prices will fall. This kind of action is at the base of fundamental forecasting; therefore, all technicians indirectly study fundamentals. The charts themselves do not cause markets to go up or down. These are the forces of supply and demand, the economic factors that lead to bullish and bearish markets.
Actually, chartists do not try to find out why the prices fall or rise. They can be aware of the trend the market is likely to go by simply studying price charts and technical indicators. They know that there surely exist reasons why markets move up or down and meanwhile believe that there is no necessity to reveal those reasons for making predictions.
Price Moves in Trends
There is a corollary to this assumption-a trend in motion is more likely to continue than to reverse.
In technical approach once a trend has been established, the future price is accepted to be in the same direction rather than to be against it. The primary goal of charting the price action is to fix trends in early stages of development to later trade in the direction of those trends. So that the entire approach of this trend-following premise is based on the already existing trend, until signs of reversal are indicated.
History Repeats Itself
This premise brings forward the concept that the key to understanding the future is based on the study of the past. The circular nature of price movements is related to the human psychology, meaning that market participants tend to react similarly to identical market events. The analysts use certain chart patterns to analyze market movements. Most of those charts that were identified about a century ago, reflect certain pictures indicating the rising or falling psychology of the market.
Because of the simple reason that those patterns worked well in the past, they are strongly believed to be as much useful in the future. They are based on the study of human psychology which is stable and does not tend to change.
1.3. Technical Analysis vs. Fundamental Analysis
As it is well known, the two wide spread types of analysis methods to study price trend are technical analysis and fundamental analysis. Comparing technical and fundamental analyses to each other is one of the best ways to understand them.
While technical analysis is focused on the study and past performance of market action, fundamental analysis concentrates on the fundamental reasons that make an impact on the market direction.
The purpose of both of these methods is an attempt to forecast and determine the future price movements. The difference is based on how they achieve that objective. Fundamentalists study the cause of price movement, whereas the technicians study the result. As we mentioned above, technicians do not find it necessary to know the reasons of market changes, but fundamentalists try to discover “why”. Therefore, technicians, who are also called chartists are interested in the price movement, they try to understand and study the emotion in the market.
The second distinctive factor for these two types of analyses is the time horizon. Actually technical analysis takes considerably short time to analyze the market, as compared to fundamental analysis.
Technical analysts can do their research based on daily, weekly or monthly data. But conversely, fundamentalists may look at data over years. Since each of those approaches takes different time frames, they are applied for reaching different trading or investment goals.
Generally technical analysis is used for a trade, while fundamental analysis is more appropriate for investment purposes. Traders buy an asset in the hope that the latter will rise in value and they will be able to sell it at a higher price. The reason why fundamental analysts use so long time frame is the following: the data they study are generated much more slowly than the price and volume data used by technical analysts.
Though these two types of analyses are viewed as polar, many traders and investors, who have active participation in the market use both. For example, a technician may refer to fundamental analysis to add strength and reliability to technical signals, to reaffirm his decision while buying or selling an asset. And, alternatively, fundamental analysts may use technical analysis tools to identify the best time to enter into a security.
The problem is that charts and fundamentals are often in competence. Technical analysts believe that their approach dominates fundamentalists. If a trader or an investor had to make a choice between these two theories, he would give preference to technical analysis. This is because technical approach includes the fundamental. If the fundamentals are reflected in the market price, their study already becomes unnecessary. Herein, chart reading serves as a shortcut of fundamental analysis. The opposite, however is not possible. Fundamental analysis does not cover the study of price action and it’s quite possible to trade using only the technical approach. To trade on financial markets one cannot do but take into consideration the markets’ technical side.
1.4. Technician or Chartist? Is There Any Difference?
Among various titles given to the practitioners of technical analysis are: chartist, visual analyst, market analyst and technical analyst. If once all they meant the same thing, together with the increasing specialization in this field there have been made some distinctions in terms. Since till the last decade technical analysis was based on mainly the use of charts, the terms “chartist” and “technician” stood for the same concept. But this does not hold true any longer.
Now in the broad field of technical analysis two types of practitioners are distinguished: chartists and statistical technicians. Charts are the primary working tools in technical analysis and the term “art charting” has been given to this approach, since chart reading is really an art. This is largely because the success of the approach greatly depends on the skills and experience of a chartist.
Statistical technician considers primary principles, tests and quantifies to develop mechanical trading systems. These systems are programmed into a computer and generate mechanical “buy” and “sell” signals. That’s main purpose is to eliminate human emotional factor in trading. The statisticians may not use charts in their work, and their work can be constrained to the study of market action. From this it follows that all chartists are also technicians, however not all technicians are chartists.
1.5. Different Theories on Technical Analysis
The Dow Theory, named after its creator Charles Dow, is the grandfather of technical analysis. While most technicians view the theory as somewhat dated, the approach of many more statistically sophisticated methods are the variants of Dow’s approach. The main objective of Dow Theory is to identify long-term trends in stock market prices. The two indicators used are the DJTA (Dow Jones Transportation Average) and DJIA (Dow Jones industrial Average). The DJIA is an important indicator of underlying trends, while the DJTA serves to confirm or reject the signal.
The Dow Theory posits three forces simultaneously affecting stock prices:
1. The primary trend, which indicates long-term movement of prices and lasts from several years to several months.
2. Secondary (intermediate) trend, which is caused by short-term deviations of prices.
3. Tertiary (Minor) trend which indicates daily fluctuations.
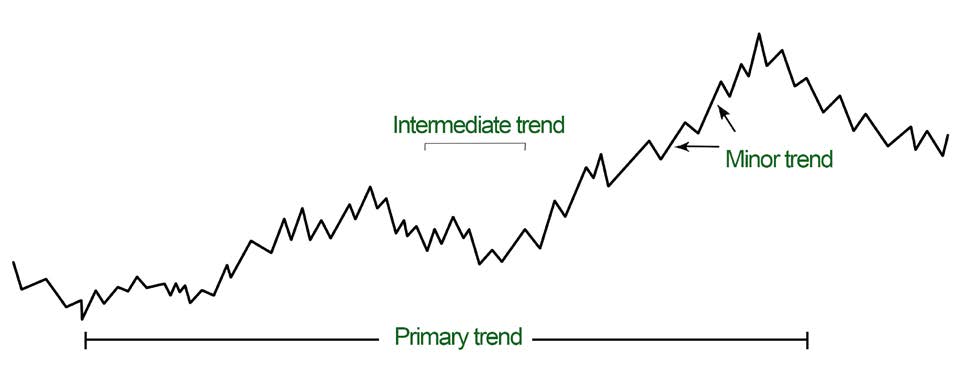
Figure 1.1 Three types of trends according to Dow Theory
Recent variations of Dow Theory are the Elliot Wave theory and the Kondratieff Wave theory. The idea of Elliot Wave theory is that security prices can be described by a set of wave patterns. Long-term and short-term wave cycles are superimposed and result in a complicated pattern of price movements, but by interpreting the cycles one can predict broad movements. Similarly, Kondratieff Wave theory, named after a Russian economist, asserts that stock market moves in broad waves lasting between 48 and 60 years.
The Kondratieff waves are, thus, analogous to Dow’s primary trend. Kondratieff’s assertion is hard to evaluate empirically, because cycles that last about 50 years provide only two full data points per century, which are hardly enough data to test the predictive power of the theory.
Conclusion
The principles of technical analysis presented in this chapter are widely applied in all markets. How analysts perform al the operations and get the ful picture of market action we’ll discover in following chapters.