

How to Know Your I.Q. Level without Taking the Test & Brainy Stories by Billy J. Burton - HTML preview
Download the book in PDF, ePub, Kindle for a complete version.
2. Variations in I.Q. Scores
Many studies about identical twins suggest intelligence is largely genetic48-86 the rest being
attributed to environmental67 67 (food quality, pollution), social (lack of brain stimulation) or even
medical reasons 67-68.
2.1 Genetics: Variations in Brain Structure
The differences in I.Q. levels essentially originate in the brain structure 56. As seen earlier, the
tests evaluate “g”, the general fluid intelligence18: problem-solving and learning skills. Because
half of “g” relates to how rapidly the nervous influx is propagated through the brain 69 via its
neurons, the more efficient the brain is:
1- the lower the 60 dendrite density, permitting a greater brain plasticity.
2- the higher the density of 58 Glial Cells, for a more direct transfer of information.
3- the higher the 57 myelination of the axons, increasing the swiftness of neurological signals.
Similarly, the greater the brain performance is:
1- the higher the 58 curvature of the Corpus Callosum, determining the efficiency with which
both hemispheres interact.
2- the lower the need for 59 glucose consumption, decreasing fatigue resulting from the same
task.
Besides, as intelligence rises, the electrical signal speed in the brain increases. When this signal
is strong enough, instead of naturally fading rapidly, it eventually reaches brain areas unsolicited by the current task. This situation known as low latent inhibition61-62-63 increases creativity in
people with elevated I.Q. scores.
2.2 Environment, Society and Healthcare: Variations in Nurture
Other differences in intelligence stem from various other issues. A child growing up in a low
intellectually stimulating milieu or with poor schooling67 will undoubtedly have difficulties evolving harmoniously and will lose potential brain power.
Malnutrition67 68 , disease and lack of access to medical care are also factors leading to a decrease
in potential intelligence.
At the same time, head injury (permanently) or depression 70 (transiently) can alter proper brain functioning and artificially lower an I.Q. score.
2.3 I.Q. Scores Discrepancy
Since intelligence is both impacted by nature and nurture, it isn’t uniformly scattered throughout
the world, but rather, typically exists in clusters of similar levels 71-72-73 in countries, social and
professional groups, families etc…
However, this is a controversial27 topic as many claim that I.Q. tests, which were originally
designed for flourishing countries of the Western world, are not a good measure of intelligence for certain cultures. Furthermore, in no way do I subscribe to the idea of entire races being less
intelligent than others.
On the other hand, being aware of these discrepancies permits the reader, living outside of the
USA, to use, with some accuracy, the I.Q. tests aimed at US residents provided at the end of this book.
2.3.1 Among Countries
According to some studies, the world mean I.Q. score, on the Wechsler Scale, is around 85 73,
with countries ranging from the high 50’s to almost72-73 110. Since different countries have different average I.Q. scores, in order to compare them, the test scores have to be adjusted to the
Greenwich I.Q. standard73 which mean is set at 100.
On the next page, here are a few examples of mean I.Q. scores by country in 2020-202172:
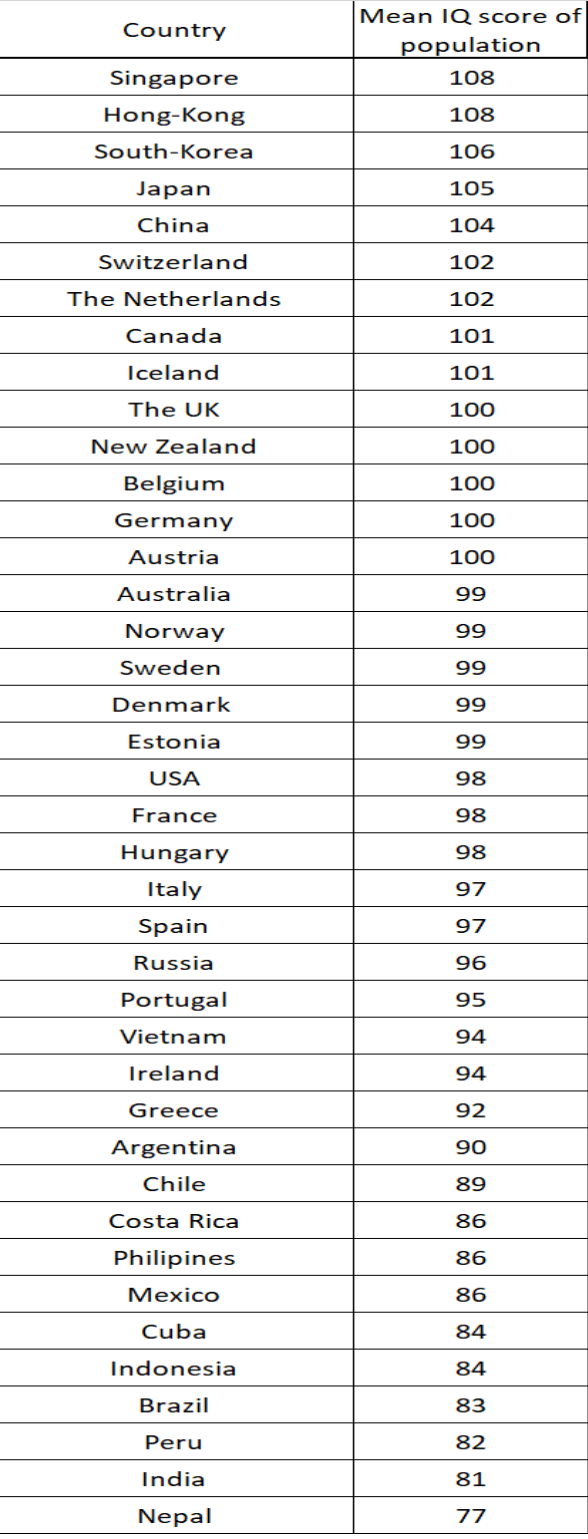
For simplicity’s sake, suppose you are British, and your I.Q. score is 100 (in the U.K. the mean is 100). If you are travelling to Greece (where the mean is 92) then it’s as if your I.Q. score had been measured as 108 there, putting you in the Upper Normal range (I.Q. 100-114) of the Greek intellectual sphere. Likewise, if you are vacationing in Japan (where the mean is 105) there, your I.Q. score will only be equivalent to 95, so in the Lower Normal range (I.Q. 85-99).
2.3.2 Among People
The difference in I.Q. ranks between individuals is far greater; scores range from well under 50,
for people with cognitive disabilities, to a little above 74175. I.Q. scores beyond 200 are either
dubious273-274 76-77 or calculated from a totally different scale (the Cattell scale or ratio scalesfor
instance).
However, even if intelligence is largely innate48-86, not all gifted people (I.Q. above 130)
originate from the union of two gifted individuals85-86. This highlights the small, but objective
influence of one’s environment on one's intelligence, especially during the first years of life.
After a brief adjustment during the teenage years78, intelligence remains pretty constant throughout adult life. Fluid intelligence (reasoning skills unrelated to knowledge) seems to
plateau at approximately 30 years of age 79 only to decrease steadily with agedness while crystallized intelligence (knowledge related aptitudes) increases slowly 79.
Examples of elevated I.Q. scores associated to various illustrious names; (while some have been
officially evaluated others are merely estimates based on accomplishments):
Albert Einstein47: From 160 to 190. Actually, this must be a misleading oversimplification of the physicist’s intelligence for, suffering from high 47-functioning autism (which results in
unbalanced intelligence: very high in one area and average or low in others 80), the subtype of
intelligence that permitted him to create the Theory of Relativity was, in all likelihood, closer to
190 or 200 on the Wechsler Scale.
Sheldon Cooper: 187 66 . The beloved character’s I.Q. score, in “The Big Bang Theory”, is
undoubtedly calculated on the Wechsler Scale which places him in the profoundly gifted
category. On the show Leonard is presumed to have scored 173, Raj 170, Amy 180, Bernadette
160, Howard 150, and Penny 110. It is needless to point out the imperfect portrayal of those characters, many not even being within communication range81-83 (15 to 30 points) of each other.
Garry Kasparov39: over 190. This score is rumored to be accurate for the chess master.
Terence Tao39: From 210 to 230 . The mathematician’s I.Q. score is a ratio assessment taken
during his childhood. On the Wechsler Scale, he would score much lower, but definitely in the
profoundly gifted range (above 175).
William Sidis39: From 200 to 300. The man portrayed in “Good Will Hunting” boasts an I.Q. level certainly south of 200, on the Wechsler Scale, for few official tests reach beyond 200 and
none show accuracy at that level.
Leonardo Da Vinci39: From 180 to 220. The famous painter and inventor’s I.Q. score was definitely in the profoundly gifted range.
Marilyn Vos Savant39: 228. The columnist's I.Q. level was calculated from the Stanford-Binet
test, it could actually be the highest ever recorded, but was deemed unreliable and taken down by
the “Guinness Book of Records”.
Evangelos Katsioulis39: 198. A Greek psychiatrist boasting the highest officially tested I.Q. score
in the world.
Isaac Newton39: From 190 to 200. The physicist’s alleged score also falls in the profoundly
gifted classification.
Marie Curie39: From 180 to 200. The first woman to win the Nobel prize and the first person to win it twice.
William Shakespeare39: 210. The English playwright and actor’s I.Q. score is believed to be off
the charts.
2.4. The Homogeneity of Intelligence Levels in Social Groups
Social circles are very homogeneous along I.Q. lines. In a group of friends, or between spouses, I.Q. score disparity must not be greater than 20 points 82, from one individual to the next, for the
group to be harmonious. This law applies to sentimental, but also, to professional groupings.
Failure to comply has dire consequences on long-term support and cooperation.
Similarly, successful leaders need I.Q. scores closer than 20 points 83 from those of their audience, lest their ideas fail to be followed, due to a lack of understanding. Because the average
person’s score is 100, leaders display an average I.Q. score of 120. Anyone above that point
won’t be fully comprehended and will confuse his or her target audience. As a result, for
instance, typical college entrants (averaging an I.Q. score of 115) will not be taught well by someone whose level is superior to 135.
Besides, for any meaningful exchange to take place, between two persons, the divergence in I.Q. scores must remain under 30 points according to Grady Towers 81 or, I think more accurately, 15
points as stated by Simonton83; this is known as the “communication range”. Above that
threshold, people communicate within a set of rules that is alien to each other. They don’t
interact on the same bases, aren’t interested in the same topics, don’t share the same values and frames of reference; in short, they don’t understand each other.
The “optimal social adjustment I.Q. 87 bracket” which favors the harmonious development of
successful individuals, socially and professionally, lies between 120 and 140. Under that range, people won’t show remarkably high rate of professional success. Above that range, people will
have difficulty adapting to regular social environments and will undergo some type of rejection.
According to Ferguson, every hierarchy is composed of several types of individuals: The Followers 88 (employees with an I.Q. score between 98 and 125) who are being directed by The
Leaders 88 88 (112-138) who are being guided by The Advisors (125-155). As outliers, we find The
Clueless88 88 (I.Q. score under 98) and The Excluded (I.Q. score above 150) who are respectively
not bright enough to really follow instructions or too bright to be convincing and, therefore, regarded as trusted leaders.
Thus, the probability of landing and remaining in an intellectual occupation such as physician,
lawyer, college teacher, manager, scientist, engineer increases, up to an I.Q. score of 133 88, then declines by a third on the 14088 88 mark and likewise, sinks by 97% above a score of 150.
Consequently, intellectual professions sport an average score of 12588 88 and 95% of people, in an
intellectual elite occupation, boast a level ranging from 112 to 138.
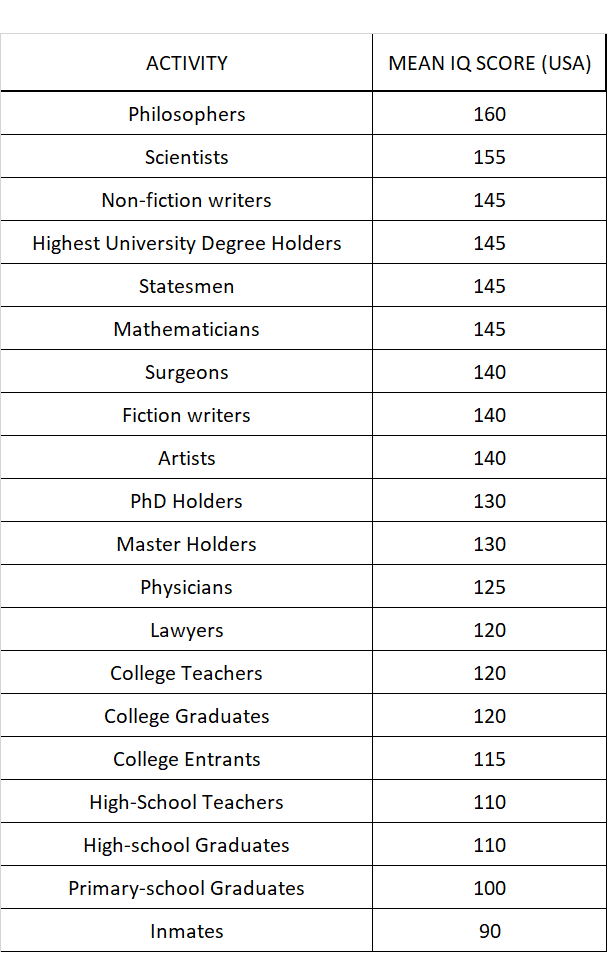
The numbers from the previous table26-89-90 showing the mean I.Q. score by activity have been rounded up to give a better equivalence idea to the reader.
The relative homogeneity of intelligence, in professional groups, also holds true in politics. The general public largely regards conflicting with their worldviews as a form of stupidity, while
these disagreements are commonly based on personal values and chosen goals, but not on
cognitive weakness.
Politician’s I.Q. rankings are nearly always at least in the “intellectual profession” range (115-129) or even above that threshold, for, the average score of statesmen or stateswomen is 145.
Elected officials are never “idiots” in a strict I.Q. related way, because even initiating such a career, demands being more intellectually endowed than average.
2.5 The Perception of Intelligence
The “Dunning 91-92 -Kruger effect”states that people of lower I.Q. levels overestimate their own
intelligence and competence. However, more recent studies 93 have revealed that everyone does it
to some degree, or at least struggles to self-assess objectively. Similarly, one can logically surmise that, the wider the cognitive gap, between two people, the more unlikely they are to
accurately gauge each other’s intelligence: the average person is ill-equipped to appraise higher
I.Q. rankers’ intelligence with precision. In addition to that issue, the way men’s and women’s
intelligence is perceived, differs greatly.
When scrutinizing men’s intelligence, the perception 94 of I.Q. ranks, by any observer, increases
along with men’s scores up to 135-140. At this threshold, the observer no longer notices any
increase in intelligence, for each point gained, but rather perceives a decrease, mistaking
brainpower for quirkiness or even stupidity. In essence, most observers are unable to notice a variance between an I.Q. score of 120 and one of 140. Equally, men with a score over 160 are
considered, by most people, as 110 scorers, or even below average.
The intelligence of women, on the other hand, is perceived to be between 100 and 140 whatever
their true I.Q. scores. A majority of women are placed at the 110 notch, those under 100 and
above 140 being equally mistaken for under average.
As a result, I.Q. scorers above 140 require first-rate accomplishments 205, so as to be recognized, for who they truly are, in term of intelligence. The intelligence of individuals with particular
cognitive issues is also frequently misestimated.
According to the latest studies, autism, which is generally misguidedly associated to low
intelligence80 (except in the case of what was referred to as the “Asperger Syndrome”), involves imbalanced aptitudes more than lack thereof. People “on the Spectrum” are, in reality,
extraordinary intelligent in certain fields but perform poorly in others275, this leads to a
misleading global I.Q. score. For instance, while Einstein’s global score is reported as 160, the I.Q. sub scores linked to his revolutionizing physics, are obviously much higher.
It is worth noting, how little, the concept of intelligence is understood by the general public.
Most people equate it with factual knowledge, wealth, education, or high-level status.
As we’ll see, in part-two of this book, even if correlations do exist, intelligence is characterized
by much deeper notions.
3. I.Q. Understood by Standard Deviations
I.Q. scores are to be found on a continuous curve, but certain clusters of dots reflect the
psychological and cognitive proximity of the subjects they represent more than points positioned
very far apart. Therefore, scores are more meaningful if gathered in sets95 of a particular extent.
3.1 The Gaussian Curve
In statistics, natural phenomena are modeled by what is called the Normal Distribution95
conceived by a mathematician named Carl Friedrich Gauss95. This is a continuous law of
probability which depends on its expectation95 95 (the mean) and its variance (the span of the
distribution values) which also amounts to the standard deviation95 squared. The Standard Deviation (SD) value provides the extent of the range to consider. It’s a statistical quantity which
corresponds, to points on the curve, showing a tangible difference from the average population of
the set, in short, the variability in the population. The higher the SD, the more removed the set is
from the mean.
The scores are distributed along the “ 95 Gaussian Curve” which concentrates most points in the
middle while diminishing rapidly at both ends. In that way, this curve resembles a bell.
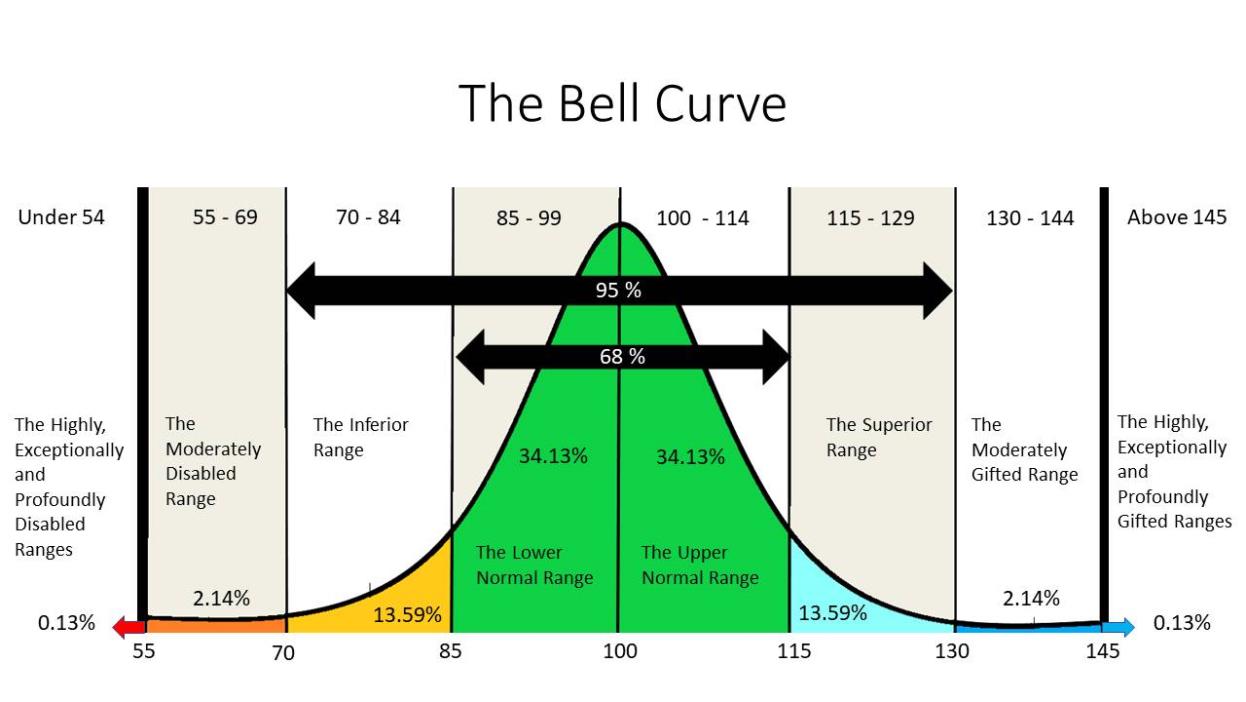
This schematic96 represents the I.Q. scores’ dispersion in the general population. It essentially
follows a “Normal Distribution”, although some researchers have noticed more people on the far
right end97 than expected. The scores, grouped in ranges, are arranged horizontally while the percentage of the population scoring at a particular level is viewed vertically (surface under the
curve).
On the 100-point mark, the distribution on the left mirrors that on the right side: for each
increment, just as many people are present above the mean (100) than under it. To emphasize that effect, I have employed the same labels for the Gifted as for the Disabled. Psychologists are
in the habit of using slightly different designations for the intellectually challenged ranges (with
“exceptionally” being customarily replaced with “Severe”276 for example).
Throughout this book I use the Wechsler’s scale22 (the most widely used for I.Q. scores). On that
particular scale the SD is equal to 15 points. Other scales have different SDs, the standard
deviation of the Cattell scale is 24 for example.
This statistical number matters because a distinct emotional and behavioral pattern, as well as an innate type of brain functioning and layout, is associated to each specific 15-point wide I.Q.
range.
So, unique personality traits are linked to each I.Q. range.
3.2 The Ranges
Distinct range labels start at the left end of the curve with “The Intellectually Disabled”. Next, they capture 96% of the entire population with the Inferior, Normal (Lower and Upper) and
Superior ranges. Then, on the right- 266 hand side rest “The Gifted”, people with an unusual brain
structure allowing a broader and deeper understanding of their environment.
Members of each particular range possess a set of personality traits 98-99-100 in common. Of course, character doesn’t change exactly on the limits of a level, it’s a gradual process. For instance,
someone whose I.Q. score is close to 130 typically shows traits from the Superior and Moderately Gifted ranges.
In the subsequent chapters, I will strive to present the specific traits pertaining to each range, so
the reader may guess where, he or she fits and, likewise, acquire an enhanced understanding of
the other levels. From lack of specific knowledge, I will not address the intellectually disabled 276 ranges, whose members, would probably not be interested in that book anyway.
3.2.1 The Main Communicative Functioning of each Range
Here, I will give a brief overlook of the main I.Q. ranges which will be developed further down this book.
Regular people’s I.Q. level is found within the 85-114 points cluster; they amount to about 68%
of the population. The Lower Normal and the Upper Normal Ranges are part of this group.
These are the people you regularly meet in most environments. They act like humans are supposed to act with their mainstream qualities and faults; they tend to enjoy what a person is
supposed to enjoy; their goals are very commonplace.
Their speech primarily conveys their feelings 101-385: happy/sad.
People in the Inferior Range show an I.Q. score extending from 70 to 84, so at -1SD (standard
deviation), making up nearly 14% of humans. They are “cruder” than the regular population, interested mainly in fulfilling elementary needs. Often underachievers 126-127, they content
themselves with a simple life while generally not realizing they are of inferior intellect.
Their speech primarily conveys categories 101-385: good/bad.
People in the Superior Range stand at +1SD which corresponds to scores between 115-129
(about 14 % of mankind). They appreciate intellectual activities149-155-158 and displaying their education as well as their knowledge348 in their areas of expertise. They value logic and scientific
evidence373 349 provided by knowledgeable people but are still conventional in their behavior,
likes and dislikes, as well as personal goals.
Their speech primarily conveys definition focused logic101-385: true/false.
Moderately Gifted people, also known as High I.Q. people (HIQ), who rest at the first level of
what is referred to as “giftedness266” (a brain wired differently: Neuro-atypicals), stand at +2SD:
an I.Q. score between 130-144 (roughly 2% of society). These individuals already exhibit unusual psychological traits resulting from their bewildering neural network 307. At the same
time, endearing and irksome, they are a bit lost, both able to be extremely competent in a field
and very average in another 178-181-186.
Their speech primarily conveys meaning focused reasoning101-385: if X is true, then Y is also
true.
Highly, Exceptionally, and Profoundly Gifted people or, taken globally, Very High I.Q.
people (VHIQ) are outlandish creatures. With an I.Q. score above 145, they amount to only 0.13% of the human race. They are, at the same time, tormented, anxious180 138-180-190 , eagerand
candid people, unable to understand what stimulates the average person yet very empathetic180.
They can be awkward321 187 in social situations but understand “issues” most others didn’t know existed. They shed light on reality and discuss patterns 187 invisible to the rest of humankind.
Their speech primarily conveys patterns101-385: if X, Y and Z can all be put into the same
set, then W, which is related to X could also be part of that set.
3.2.2 The Habitual Brain Functioning of Each Range.
I.Q. scores nowadays, represent a frequency 102, a rarity. Remarkably, the higher the ranking on
the aforementioned bell curve is, the more significant the difference 106 between scorers who are only a standard deviation, of 15 points, apart. For example, the difference between 100 and 115
is far less than the different between 130 and 145 in terms of behavior, inner feelings, intellectual
depth. Thus, people in the Superior Range (115-129) are closer to the norm than people in the
Highly Gifted Range (145-159) are to the Moderately Gifted (130-144). Besides, at each additional standard deviation, a brain treats the same amount of data (cognitive, emotional,
visual, auditiv 107 e …) at an increased speed: it processes more data in the same time frame.
Consequently, the higher the I.Q. score, the greater the distance between each cognitive step
taken when reflecting.
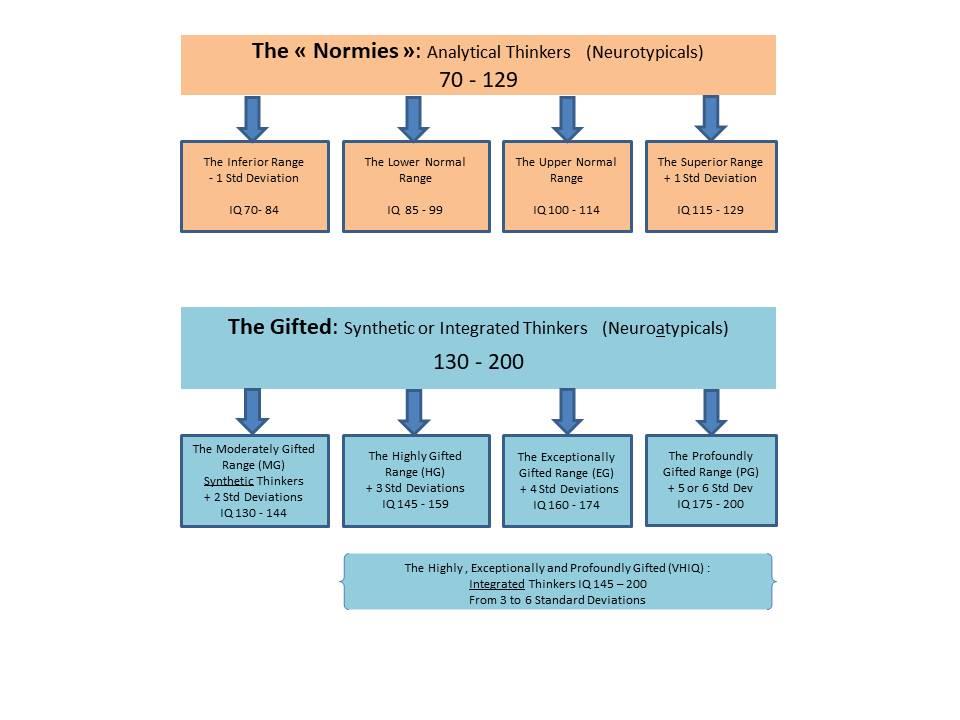
These discrepancies in brain power entail 3 main types of brain functioning or thinking types:
Analytical, Synthetic and Integrated 103.
The “Normies” (Inferior, Normal and Superior ranges: 70 300-303-129) are analytical: Analytical
thinking103 is creating understanding from the mainstream concepts one is taught: From the world to the thinker.
Analytical thinking is equated to taking small logical steps to reach understanding.
The Moderately Gifted (HIQ: 130-144) are synthetic300-303 103 : Synthetic thinkingis expanding already known mainstream concepts as one acquires new information: From the thinker to the
world.
Synthetic thinking signifies taking large logical steps with a more global approach. It leads to
more creativity than for “Analyticals”.
The Very High I.Q. people (VHIQ: above 145) are both analytical and synthetic, they are
“integrated” thinkers316 103 : Integrated thinkingis creating the concept yourself from an early
age and comparing it to mainstream concepts when that knowledge is available: From the world to the thinker, but at the same time, from the thinker to the world.
Integrated thinking means taking giant leaps of comprehensive reasoning. That mental capacity
leads to very intuitive and totally “outside of the box” thinking.
Brain functioning types 103-300-303-316