

Monarchy & Republic in the Laboratory of History by N. Fakhr - HTML preview
Download the book in PDF, ePub for a complete version.
Comparison of Passport Power between Monarchies and Republics across Continents and in the Middle East
Comparison of Passport Power between Monarchies and Republics in Asia
Descriptive Statistics
Type of Government |
Number of Countries |
Mean |
Median |
Standard Deviation |
Asian Monarchies |
13 |
110.31 |
88.00 |
52.29 |
Asian Republics |
33 |
68.97 |
58.00 |
43.94 |
The mean passport power score is 110.31 for Asian monarchies and 68.97 for Asian republics. Thus, citizens of Asian monarchies have access, on average, to approximately 41.34 more destinations without obtaining a visa in advance or with a visa on arrival.
The median points in the same direction. The median passport power score is 88 for monarchies and 58 for republics, meaning that the median country among Asian monarchies provides access to 30 more destinations than the median country among Asian republics.
The standard deviation is relatively high in both groups, although dispersion is slightly greater among monarchies than among republics. This indicates that both groups include countries with very strong as well as very weak passports.
Test of the Difference between Means
To assess the statistical significance of the difference between the two means, Welch’s t-test was used.
Statistical Measure |
Value |
Mean difference (Monarchy − Republic) |
41.34 |
Welch’s t statistic |
2.521 |
Approximate degrees of freedom |
19.05 |
Two-tailed p-value |
0.0208 |
95% confidence interval |
7.03 to 75.65 |
Hedges’ g |
0.88 |
Welch’s test indicates that the difference in mean passport power between Asian monarchies and republics is statistically significant at the 5% level (p = 0.0208). The 95% confidence interval also lies entirely above zero, confirming that the direction of the difference favors monarchies.
Hedges’ g is 0.88, indicating a large effect. Thus, the observed difference is not only statistically significant but also substantial in practical terms.
Mann–Whitney Test
To ensure that the result does not depend solely on a comparison of means or on the assumptions of the parametric test, the nonparametric Mann–Whitney test was also conducted.
Statistical Measure |
Value |
U statistic |
335 |
Two-tailed p-value |
0.0034 |
Rank-biserial correlation |
0.56 |
The Mann–Whitney test likewise indicates a statistically significant difference between the two groups (p = 0.0034). The rank-biserial correlation of 0.56 also represents a large effect in favor of Asian monarchies.
Conclusion
In 2024, Asian monarchies had greater passport power than Asian republics in terms of both the mean and the median. Both Welch’s t-test and the Mann–Whitney test confirm that the difference is statistically significant, and the effect sizes are large.
Citizens of Asian monarchies therefore enjoyed, on average, greater freedom of international travel than citizens of Asian republics. If passport power is regarded as a composite indicator of a country’s international standing, the trust placed in its citizens by other governments, and the overall quality of governance, the result of this comparison is also consistent with the prediction of the “New or Modern Monarchy” hypothesis.
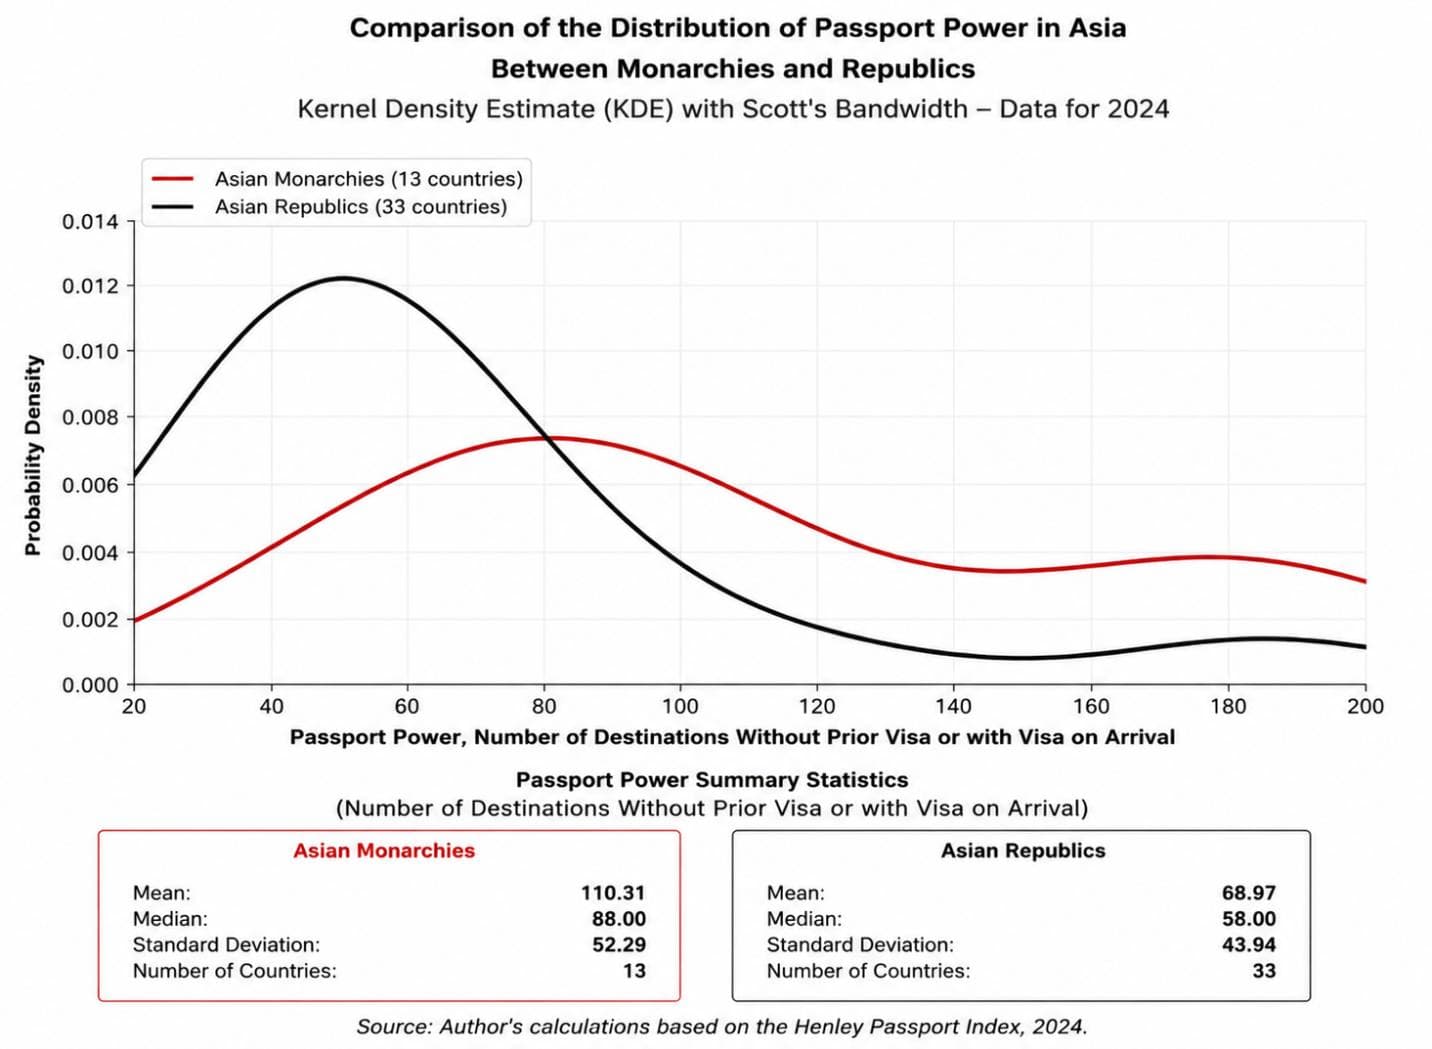
The kernel density estimate shows that the distribution of passport power among Asian monarchies is generally concentrated at higher levels than that of the continent’s republics. This advantage is also clearly reflected in the descriptive statistics: the mean and median passport power scores for Asian monarchies are 110.31 and 88, respectively, compared with 68.97 and 58 for Asian republics. Both groups exhibit relatively high dispersion, but the greater concentration of monarchies at higher values indicates that their citizens, on average, enjoy greater freedom of international travel. Thus, the 2024 data indicate that Asian monarchies perform better than the continent’s republics in terms of passport power.
Comparison of Passport Power Between Monarchies and Republics in Europe
Descriptive Statistics
Type of Government |
Number of Countries |
Mean |
Median |
Standard Deviation |
European Monarchies |
11 |
186.91 |
190.00 |
6.86 |
European Republics |
34 |
166.06 |
184.00 |
33.41 |
The mean passport power score is 186.91 for European monarchies and 166.06 for European republics. Thus, citizens of European monarchies have access, on average, to approximately 20.85 more destinations without obtaining a visa in advance or with a visa on arrival.
The median points in the same direction. The median passport power score is 190 for monarchies and 184 for republics, meaning that the median country among European monarchies provides access to 6 more destinations than the median country among European republics.
The standard deviation is only 6.86 among monarchies, compared with 33.41 among republics. European monarchies therefore not only have a higher average but also display much more consistent performance on this indicator. Among European republics, by contrast, there are countries with very powerful passports as well as countries whose passports provide substantially more limited access.
Test of the Difference Between Means
To assess the statistical significance of the difference between the two means, Welch’s t-test was used.
Statistical Measure |
Value |
Mean difference (Monarchies − Republics) |
20.85 |
Welch’s t statistic |
3.422 |
Approximate degrees of freedom |
39.93 |
Two-tailed p-value |
0.00145 |
95% confidence interval |
8.54 to 33.16 |
Effect size (Hedges’ g) |
0.70 |
Welch’s test shows that the difference in mean passport power between European monarchies and republics is statistically significant (p = 0.00145). The 95% confidence interval also lies entirely above zero, confirming that the direction of the difference favors monarchies.
Hedges’ g is 0.70, indicating a medium-to-large effect. Thus, the observed difference is not only statistically significant but also substantial in practical terms.
Mann–Whitney Test
To ensure that the result does not depend solely on a comparison of means or on the assumptions of the parametric test, the nonparametric Mann–Whitney test was also conducted.
Statistical Measure |
Value |
U statistic |
268.5 |
Two-tailed p-value |
0.0319 |
Rank-biserial correlation |
0.44 |
The Mann–Whitney test also indicates a statistically significant difference between the two groups at the 5% level (p = 0.0319). The rank-biserial correlation of 0.44 indicates a medium effect in favor of European monarchies.
Conclusion
In 2024, European monarchies had higher passport power than European republics in terms of both the mean and the median. Welch’s test and the Mann–Whitney test both confirm that this difference is statistically significant, while the effect sizes indicate that the observed advantage is also meaningful in practical terms.
Moreover, the much lower dispersion among monarchies suggests that high passport power is a relatively widespread and consistent feature of this group rather than the result of a few exceptional countries. The European comparison is therefore also consistent with the predictions of the “New or Modern Monarchy” hypothesis.
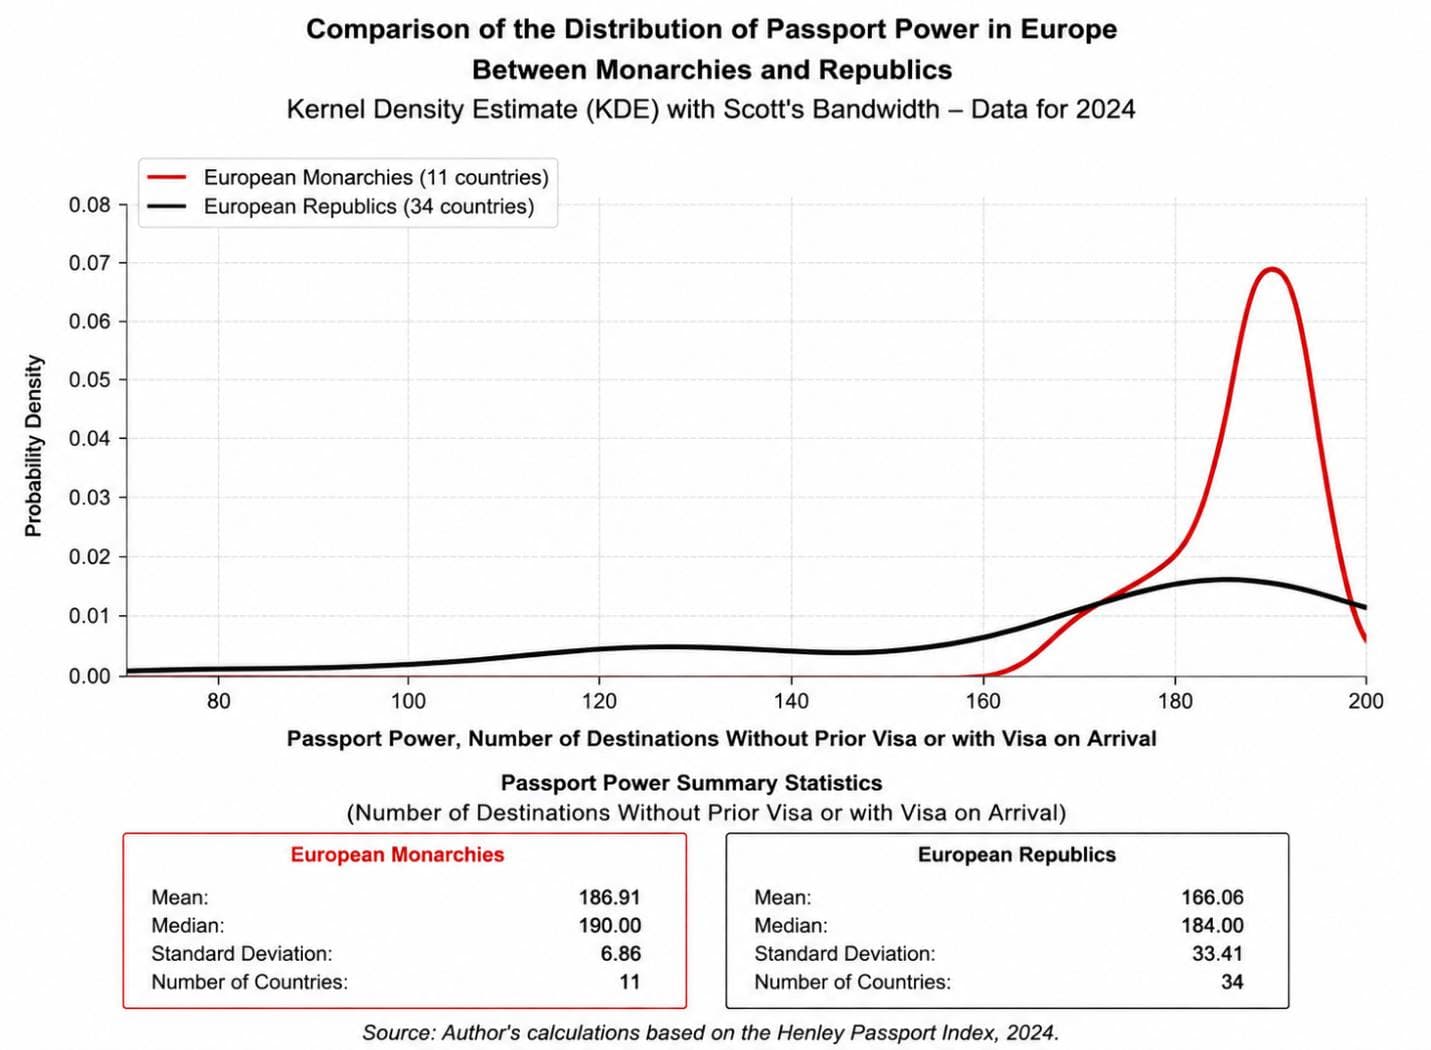
The kernel density estimate shows that European monarchies are concentrated at a very high level of passport power, with little dispersion; nearly all of them rank among the countries with the world’s most powerful passports. European republics, by contrast, also include many countries with very powerful passports, but their distribution is considerably wider, with a number of Eastern and Southeastern European republics recording lower scores and thereby reducing the group average.
This difference is also evident in the descriptive statistics: the mean and median passport power scores for European monarchies are 186.91 and 190, respectively, compared with 166.06 and 184 for European republics. Thus, the 2024 data indicate that European monarchies, on average, have more powerful passports and a more homogeneous distribution than the continent’s republics.
Comparison of Passport Power Between European Monarchies and European Republics That Have Never Been Communist
Descriptive Statistics
Type of Government |
Number of Countries |
Mean |
Median |
Standard Deviation |
European Monarchies |
11 |
186.91 |
190.00 |
6.86 |
Never-Communist European Republics |
13 |
187.46 |
190.00 |
6.12 |
The mean passport power score is 186.91 for European monarchies and 187.46 for European republics that have never experienced communist rule. Thus, the mean for this group of republics is only about 0.55 destinations higher than that of the monarchies.
The median is exactly the same in both groups, at 190 destinations. The standard deviations are also very similar, indicating that passport power in both groups is very high and relatively consistent.
Test of the Difference Between Means
To assess the statistical significance of the difference between the two means, Welch’s t-test was used.
Statistical Measure |
Value |
Mean difference (Monarchies − Republics) |
−0.55 |
Welch’s t statistic |
−0.206 |
Approximate degrees of freedom |
20.32 |
Two-tailed p-value |
0.838 |
95% confidence interval |
−6.13 to 5.02 |
Hedges’ g |
−0.08 |
Welch’s test shows that the difference in mean passport power between the two groups is not statistically significant (p = 0.838). The 95% confidence interval includes zero, and Hedges’ g is also close to zero. Thus, there is no practically meaningful difference between the groups in terms of either their mean scores or effect size.
Mann–Whitney Test
To ensure that the conclusion does not depend solely on a comparison of means, the nonparametric Mann–Whitney test was also conducted.
Statistical Measure |
Value |
U statistic |
66.5 |
Two-tailed p-value |
0.791 |
Rank-biserial correlation |
−0.07 |
The Mann–Whitney test likewise finds no statistically significant difference between the two groups (p = 0.791). The rank-based effect size is also very small and close to zero, confirming the result of Welch’s test.
Conclusion
Once the comparison is restricted to European republics that have never experienced communist rule, the difference in passport power between monarchies and republics effectively disappears. The two groups have almost identical means and exactly the same median, and neither Welch’s test nor the Mann–Whitney test finds a statistically significant difference.
This result suggests that the advantage of monarchies in the overall European comparison is associated, at least in part, with the presence of republics with lower passport power, many of which have a history of communist rule. However, as explained earlier in the methodological note, excluding republics with a communist past is only a supplementary analysis intended to clarify the possible sources of the observed difference and should not serve as the basis for the final judgment regarding the relative performance of monarchy and republic.
Comparison of Passport Power in Africa, the Americas, and Oceania
Because the number of monarchies and Commonwealth realms is limited in some of these regions, this section is restricted to descriptive statistics and no inferential statistical tests are conducted.
Africa
Type of Government |
Number of Countries |
Mean |
Median |
Standard Deviation |
African Monarchies |
3 |
76.00 |
77.00 |
3.61 |
African Republics |
49 |
63.51 |
59.00 |
22.62 |
In Africa, both the mean and the median passport power scores are higher among monarchies than among the continent’s republics. The dispersion of scores among the three African monarchies is also much lower than among republics.
The Americas
Type of Government |
Number of Countries |
Mean |
Median |
Standard Deviation |
Commonwealth Realms in the Americas |
9 |
144.56 |
153.00 |
30.35 |
Republics in the Americas |
26 |
130.38 |
138.50 |
37.38 |
In the Americas, both the mean and median passport power scores are higher among Commonwealth realms than among the continent’s republics. Passport power is also somewhat less dispersed among the Commonwealth realms.
Oceania
Type of Government |
Number of Countries |
Mean |
Median |
Standard Deviation |
Oceanian Monarchy |
1 |
131.00 |
131.00 |
— |
Commonwealth Realms in Oceania |
5 |
145.20 |
134.00 |
44.64 |
Oceanian Republics |
9 |
111.11 |
124.00 |
18.41 |
In Oceania, the continent’s only monarchy, Tonga, has a passport power score above the average of the region’s republics. Both the mean and median passport power scores of the Commonwealth realms in Oceania are also higher than those of the republics, although dispersion is greater among the Commonwealth realms.
Comparison of Passport Power Between Monarchies and Republics in the Middle East
Descriptive Statistics
Type of Government |
Number of Countries |
Mean |
Median |
Standard Deviation |
Middle Eastern Monarchies |
7 |
101.00 |
88.00 |
40.42 |
Middle Eastern Republics |
10 |
73.60 |
44.00 |
58.58 |
The mean passport power score is 101 among Middle Eastern monarchies and 73.60 among the region’s republics. Thus, citizens of Middle Eastern monarchies have access, on average, to 27.40 more destinations without obtaining a visa in advance or with a visa on arrival.
The median reveals an even larger difference. The median passport power score is 88 among monarchies and 44 among republics, meaning that the median Middle Eastern monarchy provides access to 44 more destinations than the median republic in the region.
The standard deviation is higher among republics (58.58) than among monarchies (40.42). This indicates that passport power is more widely dispersed among Middle Eastern republics and that the presence of a few republics with very powerful passports substantially raises the group mean.
Test of the Difference Between Means
To assess the statistical significance of the difference between the means, Welch’s t-test was used.
Statistical Measure |
Value |
Mean difference (Monarchies − Republics) |
27.40 |
Welch’s t statistic |
1.141 |
Approximate degrees of freedom |
15.00 |
Two-tailed p-value |
0.272 |
95% confidence interval |
−23.78 to 78.58 |
Hedges’ g |
0.50 |
Welch’s test shows that the difference in mean passport power between Middle Eastern monarchies and republics is not statistically significant (p = 0.272). The 95% confidence interval includes zero, so this test does not allow the hypothesis of equal means to be rejected.
Nevertheless, Hedges’ g is 0.50, indicating a moderate effect in favor of monarchies. This suggests that the observed difference is not trivial in practical terms, although the small sample sizes and substantial dispersion prevent it from reaching statistical significance.
Mann–Whitney Test
To ensure that the conclusion does not depend solely on a comparison of means or on the assumptions of the parametric test, the nonparametric Mann–Whitney test was also conducted.
Statistical Measure |
Value |
U statistic |
52 |
Two-tailed p-value |
0.109 |
Rank-biserial correlation |
0.49 |
The Mann–Whitney test likewise does not find a statistically significant difference between the two groups at the 5% level (p = 0.109). However, the rank-biserial correlation of 0.49 indicates a moderate-to-large effect in favor of monarchies.
Conclusion
In 2024, Middle Eastern monarchies had higher passport power than the region’s republics in terms of both the mean and the median. The difference between the group means is 27.40 destinations, while the difference between the medians is 44 destinations, and both effect-size measures indicate a substantial advantage for monarchies.
However, neither Welch’s test nor the Mann–Whitney test finds the difference statistically significant at the 5% level. Thus, the direction of the result is consistent with the prediction of the “New or Modern Monarchy” hypothesis, but the statistical evidence is not sufficient to establish a systematic difference between the two groups with confidence.
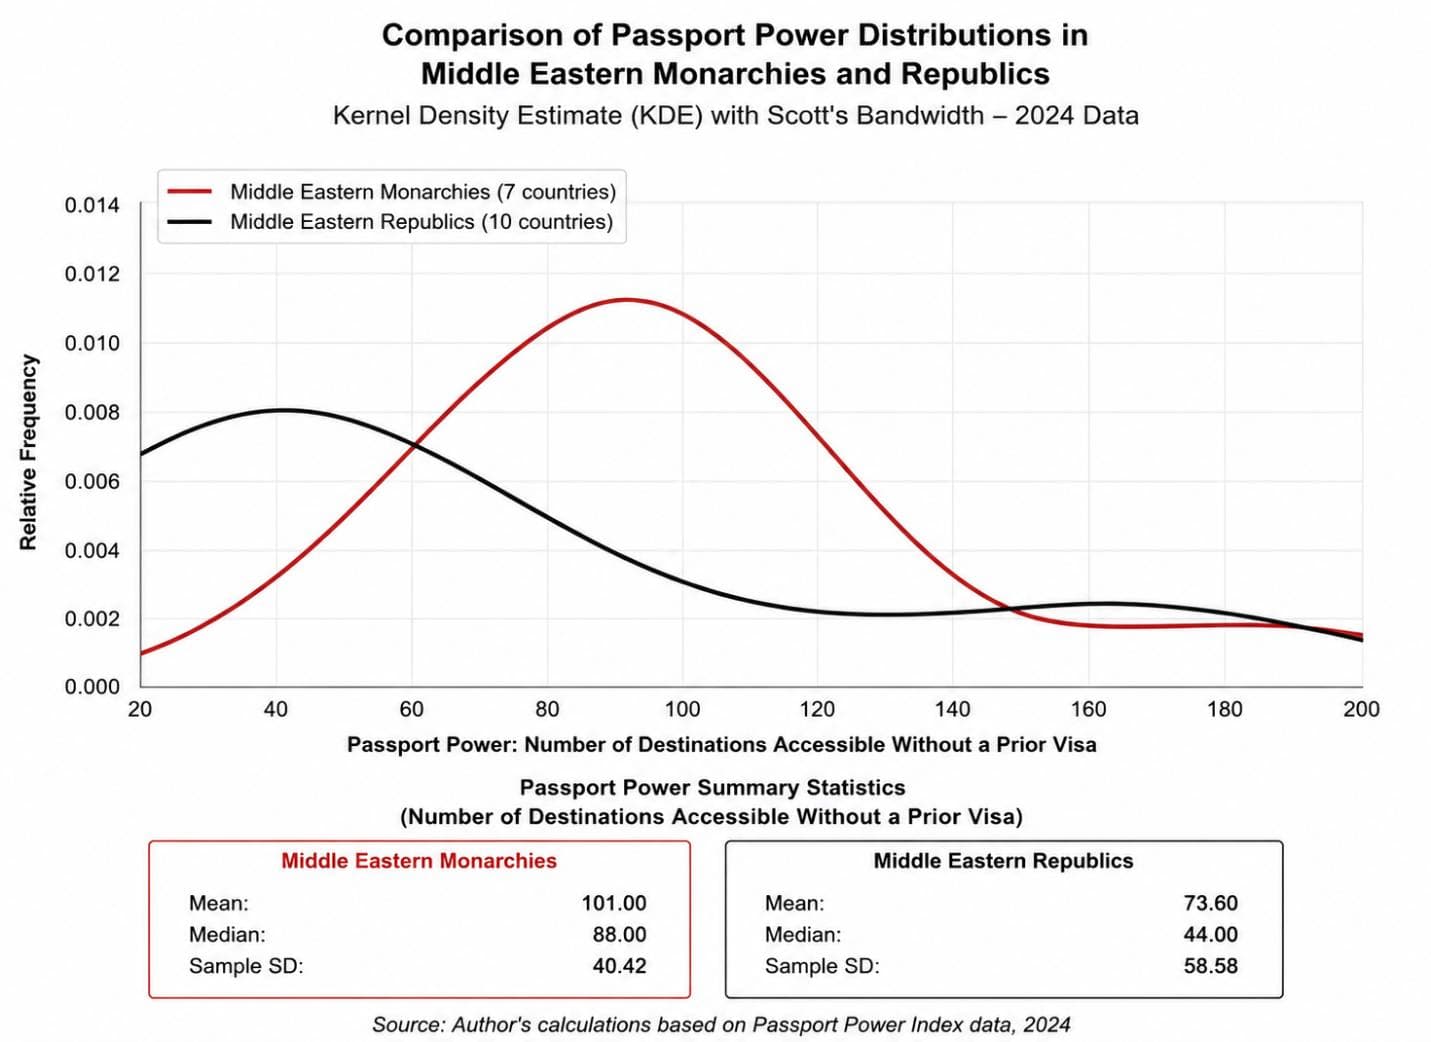
The kernel density estimate shows that the distribution of passport power among Middle Eastern monarchies is generally shifted toward higher values than that of the region’s republics. This advantage is also evident in the descriptive statistics: the mean passport power score for Middle Eastern monarchies is 101, with a median of 88, compared with 73.60 and 44, respectively, for Middle Eastern republics. However, the republics show considerably greater dispersion, as the group includes countries with relatively weak passports alongside countries such as Cyprus and Israel with very strong passports. Middle Eastern monarchies, by contrast, are concentrated mainly in the middle and upper ranges of the index and display a more homogeneous distribution. Overall, the 2024 data indicate that Middle Eastern monarchies have, on average, greater passport power than the region’s republics.
Status of the “New or Modern Monarchy” Hypothesis After the Fourteenth Indicator
With the addition of passport power, the “New or Modern Monarchy” hypothesis has now been tested against fourteen independent indicators. Of these, twelve indicators have produced results clearly consistent with the hypothesis.
In the main passport power comparison—that is, the comparison of all monarchies worldwide with all republics—the mean for monarchies was significantly higher. Both Welch’s t-test and the Mann–Whitney test showed a statistically significant difference between the two groups, with an effect size ranging from moderate to large. In addition, the supplementary comparisons in Asia and Europe also favored monarchies and were statistically significant. Commonwealth realms likewise had greater passport power than republics worldwide, with a statistically significant difference and a large effect size.
In the comparison between the two types of monarchy, constitutional monarchies had greater passport power than semi-constitutional and absolute monarchies. The Mann–Whitney test found this difference statistically significant, while the Welch test, with a value very close to the five-percent threshold, fell just short of statistical significance. As supplementary evidence, this result points to a substantial difference between the two groups, but it does not form the basis of the main assessment of the hypothesis.
In the Middle East as well, both the mean and the median passport power scores favored monarchies, and the effect sizes indicated a moderate and meaningful difference. However, because of the small number of countries and the substantial dispersion in the data, neither statistical test reached the conventional threshold for significance. This regional result does not alter the overall direction of the findings, since the principal conclusion is based on the global comparison between the two forms of government.
The results for two other indicators were different. For the Gini coefficient, the difference favored monarchies but was not statistically significant. For Voice and Accountability, the main global test likewise found no statistically significant difference, although constitutional monarchies and Commonwealth realms performed significantly better in the supplementary analyses.
Thus, among the fourteen indicators examined:
- Twelve indicators provide clear evidence consistent with the hypothesis;
- Two indicators either point in the direction predicted by the hypothesis or provide supplementary evidence in its favor, but their main tests did not reach statistical significance;
- No indicator has produced statistically significant evidence in the direction contrary to the “New or Modern Monarchy” hypothesis.
Unlike the preceding indicators, passport power is not directly one of the five principal goals of government. Rather, it is a composite, externally manifested indicator of international standing, the confidence other governments place in a country’s citizens, and the overall quality of governance. Its consistency with the predominant pattern found in this study may therefore be regarded as a form of external and independent confirmation of the pattern observed across indicators relating to welfare, security, order, justice, and liberty. As with the other findings, however, this consistency does not by itself establish a causal relationship between the form of government and national performance.
Test |
Indicator |
Result |
✓ |
GDP per Capita |
Consistent with the hypothesis |
✓ |
Purchasing Power per Capita |
Consistent with the hypothesis |
◐ |
Gini Coefficient |
Mixed evidence; difference favors the hypothesis |
✓ |
Political Stability and Absence of Violence |
Consistent with the hypothesis |
✓ |
Regulatory Quality |
Consistent with the hypothesis |
✓ |
Rule of Law |
Consistent with the hypothesis |
✓ |
Government Effectiveness |
Consistent with the hypothesis |
✓ |
Inflation |
Consistent with the hypothesis |
✓ |
Control of Corruption |
Consistent with the hypothesis |
✓ |
Corruption Perceptions |
Consistent with the hypothesis |
✓ |
Property Rights |
Consistent with the hypothesis |
✓ |
Human Development |
Consistent with the hypothesis |
◐ |
Voice and Accountability |
Mixed evidence; main test not significant, but supplementary analyses favor the hypothesis |
✓ |
Passport Power |
Consistent with the hypothesis |