Precalculus: An Investigation of Functions by David Lippman and Melonie Rasmussen - HTML preview
Download the book in PDF, ePub, Kindle for a complete version.
Section 1.1 Functions and Function Notation 17
35. Suppose f ( x)
2
= x + 8 x − 4 . Compute the following:
a. f ( 1)
− + f (1) b. f ( 1)
− − f (1)
36. Suppose f ( x)
2
= x + x + 3. Compute the following:
a. f ( 2)
− + f (4)
b. f ( 2)
− − f (4)
37. Let f ( t) = 3 t + 5
a. Evaluate f (0)
b. Solve f ( t) = 0
38. Let g ( p) = 6 − 2 p
a. Evaluate g(0)
b. Solve g ( p) = 0
39. Match each function name with its equation.
a. y = x
i. Cube root
b.
3
y = x
ii. Reciprocal
c.
3
y = x
iii. Linear
iv. Square Root
d.
1
y =
v. Absolute Value
x
vi. Quadratic
e.
2
y = x
vii. Reciprocal Squared
f. y = x
viii. Cubic
g. y = x
h.
1
y =
2
x
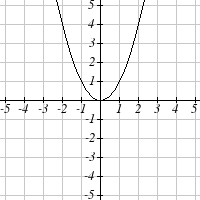
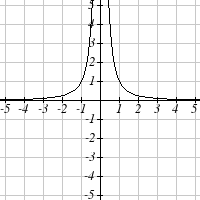
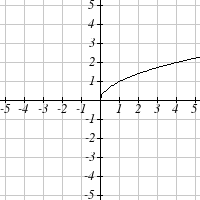
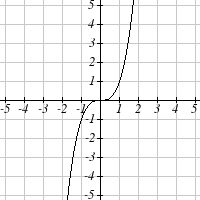
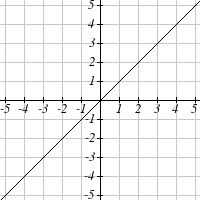
40. Match each graph with its equation.
i.
ii.
iii.
iv.
a. y = x
b.
3
y = x
c.
3
y = x
d.
1
y =
x
e.
2
y = x
v.
vi.
vii.
viii.
f. y = x
g. y = x
h.
1
y =
2
x
18 Chapter 1
41. Match each table with its equation.
a.
2
y = x
i. In Out ii. In Out iii. In Out
b. y = x
-2 -0.5
-2 -2
-2 -8
c. y = x
-1 -1
-1 -1
-1 -1
0 _
0 0
0 0
d. y =1/ x
1 1
1 1
1 1
e. y |
= x |
2 0.5
2 2
2 8
f.
3
y = x
3 27
3 3
3 0.33
iv. In Out
v. In Out vi. In Out
-2 4
-2 _
-2 2
-1 1
-1 _
-1 1
0 0
0 0
0 0
1 1
1 1
1 1
2 4
4 2
2 2
3 3
9 3
3 9
42. Match each equation with its table
a. Quadratic
i. In Out ii. In Out iii. In Out
b. Absolute Value
-2 -0.5
-2 -2
-2 -8
c. Square Root
-1 -1
-1 -1
-1 -1
d. Linear
0 _
0 0
0 0
e. Cubic
1 1
1 1
1 1
f. Reciprocal
2 0.5
2 2
2 8
3 27
3 3
3 0.33
iv. In Out
v. In Out vi. In Out
-2 4
-2 _
-2 2
-1 1
-1 _
-1 1
0 0
0 0
0 0
1 1
1 1
1 1
2 4
4 2
2 2
3 3
9 3
3 9
43. Write the equation of the circle centered at (3 , 9
− ) with radius 6.
44. Write the equation of the circle centered at (9 , 8
− ) with radius 11.
45. Sketch a reasonable graph for each of the following functions. [UW]
a. Height of a person depending on age.
b. Height of the top of your head as you jump on a pogo stick for 5 seconds.
c. The amount of postage you must put on a first class letter, depending on the
weight of the letter.
Section 1.1 Functions and Function Notation 19
46. Sketch a reasonable graph for each of the following functions. [UW]
a. Distance of your big toe from the ground as you ride your bike for 10 seconds.
b. Your height above the water level in a swimming pool after you dive off the high
board.
c. The percentage of dates and names you’ll remember for a history test, depending
on the time you study.
L
f(x)
47. Using the graph shown,
t r
a. Evaluate f ( c)
a b
c
b. Solve f ( x) = p
x
c. Suppose f ( b) = z . Find f ( z)
d. What are the coordinates of points L and K?
K
p
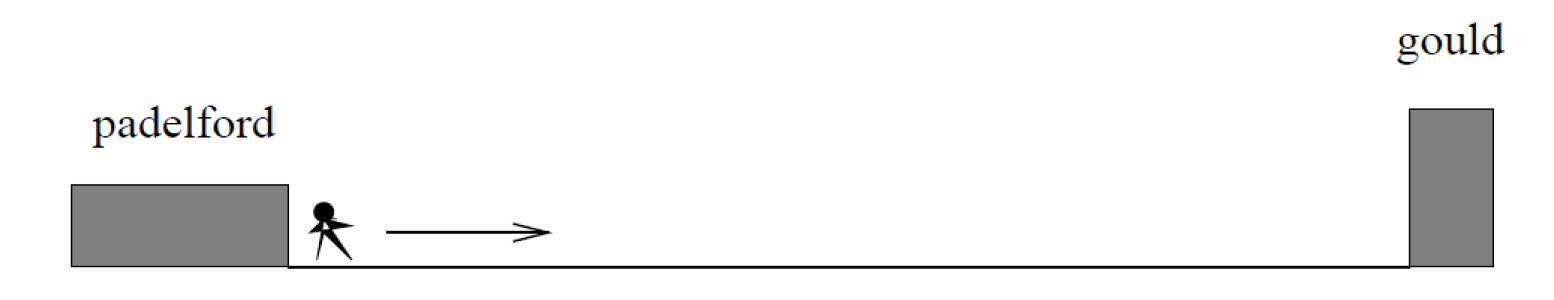
48. Dave leaves his office in Padelford Hall on his way to teach in Gould Hall. Below are
several different scenarios. In each case, sketch a plausible (reasonable) graph of the
function s = d( t) which keeps track of Dave’s distance s from Padelford Hall at time t.
Take distance units to be “feet” and time units to be “minutes.” Assume Dave’s path
to Gould Hall is long a straight line which is 2400 feet long. [UW]
a. Dave leaves Padelford Hall and walks at a constant spend until he reaches Gould
Hall 10 minutes later.
b. Dave leaves Padelford Hall and walks at a constant speed. It takes him 6 minutes
to reach the half-way point. Then he gets confused and stops for 1 minute. He
then continues on to Gould Hall at the same constant speed he had when he
originally left Padelford Hall.
c. Dave leaves Padelford Hall and walks at a constant speed. It takes him 6 minutes
to reach the half-way point. Then he gets confused and stops for 1 minute to
figure out where he is. Dave then continues on to Gould Hall at twice the constant
speed he had when he originally left Padelford Hall.
20 Chapter 1
d. Dave leaves Padelford Hall and walks at a constant speed. It takes him 6 minutes
to reach the half-way point. Then he gets confused and stops for 1 minute to
figure out where he is. Dave is totally lost, so he simply heads back to his office,
walking the same constant speed he had when he originally left Padelford Hall.
e. Dave leaves Padelford heading for Gould Hall at the same instant Angela leaves
Gould Hall heading for Padelford Hall. Both walk at a constant speed, but Angela
walks twice as fast as Dave. Indicate a plot of “distance from Padelford” vs.
“time” for the both Angela and Dave.
f. Suppose you want to sketch the graph of a new function s = g(t) that keeps track
of Dave’s distance s from Gould Hall at time t. How would your graphs change in
(a)-(e)?
Section 1.2 Domain and Range 21
Section 1.2 Domain and Range
One of our main goals in mathematics is to model the real world with mathematical
functions. In doing so, it is important to keep in mind the limitations of those models we
create.
This table shows a relationship between circumference and height of a tree as it grows.
Circumference, c 1.7
2.5
5.5
8.2
13.7
Height, h
24.5 31
45.2 54.6 92.1
While there is a strong relationship between the two, it would certainly be ridiculous to
talk about a tree with a circumference of -3 feet, or a height of 3000 feet. When we
identify limitations on the inputs and outputs of a function, we are determining the
domain and range of the function.
Domain and Range
Domain: The set of possible input values to a function
Range: The set of possible output values of a function
Example 1
Using the tree table above, determine a reasonable domain and range.
We could combine the data provided with our own experiences and reason to
approximate the domain and range of the function h = f(c). For the domain, possible
values for the input circumference c, it doesn’t make sense to have negative values, so c
> 0. We could make an educated guess at a maximum reasonable value, or look up that
the maximum circumference measured is about 119 feet1. With this information we would say a reasonable domain is 0 < c ≤119feet.
Similarly for the range, it doesn’t make sense to have negative heights, and the
maximum height of a tree could be looked up to be 379 feet, so a reasonable range is
0 < h ≤ 379 feet.
Example 2
When sending a letter through the United States Postal Service, the price depends upon
the weight of the letter2, as shown in the table below. Determine the domain and range.
1 http://en.wikipedia.org/wiki/Tree, retrieved July 19, 2010
2 http://www.usps.com/prices/first-class-mail-prices.htm, retrieved July 19, 2010
22 Chapter 1
Letters
Weight not Over Price
1 ounce
$0.44
2 ounces
$0.61
3 ounces
$0.78
3.5 ounces
$0.95
Suppose we notate Weight by w and Price by p, and set up a function named P, where
Price, p is a function of Weight, w. p = P(w).
Since acceptable weights are 3.5 ounces or less, and negative weights don’t make sense,
the domain would be 0 < w ≤ 3.5 . Technically 0 could be included in the domain, but
logically it would mean we are mailing nothing, so it doesn’t hurt to leave it out.
Since possible prices are from a limited set of values, we can only define the range of
this function by listing the possible values. The range is p = $0.44, $0.61, $0.78, or
$0.95.
Try it Now
1. The population of a small town in the year 1960 was 100 people. Since then the
population has grown to 1400 people reported during the 2010 census. Choose
descriptive variables for your input and output and use interval notation to write the
domain and range.
Notation
In the previous examples, we used inequalities to describe the domain and range of the
functions. This is one way to describe intervals of input and output values, but is not the
only way. Let us take a moment to discuss notation for domain and range.
Using inequalities, such as 0< c≤163, 0< w≤3.5, and 0< h≤379 imply that we are interested in all values between the low and high values, including the high values in
these examples.
However, occasionally we are interested in a specific list of numbers like the range for
the price to send letters, p = $0.44, $0.61, $0.78, or $0.95. These numbers represent a set
of specific values: {0.44, 0.61, 0.78, 0.95}
Representing values as a set, or giving instructions on how a set is built, leads us to
another type of notation to describe the domain and range.
Suppose we want to describe the values for a variable x that are 10 or greater, but less
than 30. In inequalities, we would write 10 ≤ x < 30 .
Section 1.2 Domain and Range 23
When describing domains and ranges, we sometimes extend this into set-builder
notation, which would look like this: { x |10 ≤ x < }
30 . The curly brackets {} are read as
“the set of”, and the vertical bar | is read as “such that”, so altogether we would read
{ x |10 ≤ x < }
30 as “the set of x-values such that 10 is less than or equal to x and x is less
than 30.”
When describing ranges in set-builder notation, we could similarly write something like
{ f ( x) | 0 < f ( x) < }
100 , or if the output had its own variable, we could use it. So for our
tree height example above, we could write for the range { h | 0 < h ≤
}
379 . In set-builder
notation, if a domain or range is not limited, we could write { t | t is a real numbe }
r , or
{ t | t ∈ }
, read as “the set of t-values such that t is an element of the set of real numbers.
A more compact alternative to set-builder notation is interval notation, in which
intervals of values are referred to by the starting and ending values. Curved parentheses
are used for “strictly less than,” and square brackets are used for “less than or equal to.”
Since infinity is not a number, we can’t include it in the interval, so we always use curved
parentheses with ∞ and -∞. The table below will help you see how inequalities
correspond to set-builder notation and interval notation:
Inequality
Set Builder Notation
Interval notation
5 < h ≤10
{ h |5 < h ≤ }
10
(5, 10]
5 ≤ h <10
{ h |5 ≤ h < }
10
[5, 10)
5 < h <10
{ h |5 < h < }
10
(5, 10)
h <10
{ h | h < }
10
(−∞,10)
h ≥10
{ h | h ≥ }
10
[10,∞)
all real numbers
{ h | h∈ }
(−∞,∞)
To combine two intervals together, using inequalities or set-builder notation we can use
the word “or”. In interval notation, we use the union symbol, ∪ , to combine two
unconnected intervals together.
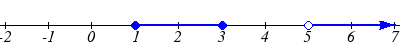
Example 3
Describe the intervals of values shown on the line graph below using set builder and
interval notations.
24 Chapter 1
To describe the values, x, that lie in the intervals shown above we would say, “x is a real
number greater than or equal to 1 and less than or equal to 3, or a real number greater
than 5.”
As an inequality it is: 1≤ x≤3or x>5
In set builder notation: { x |1≤ x ≤ 3 or x > }
5
In interval notation: [1,3]∪ (5,∞)
Remember when writing or reading interval notation:
Using a square bracket [ means the start value is included in the set
Using a parenthesis ( means the start value is not included in the set
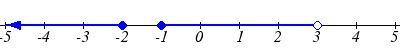
Try it Now
2. Given the following interval, write its meaning in words, set builder notation, and
interval notation.
Domain and Range from Graphs
We can also talk about domain and range based on graphs. Since domain refers to the set
of possible input values, the domain of a graph consists of all the input values shown on
the graph. Remember that input values are almost always shown along the horizontal
axis of the graph. Likewise, since range is the set of possible output values, the range of
a graph we can see from the possible values along the vertical axis of the graph.
Be careful – if the graph continues beyond the window on which we can see the graph,
the domain and range might be larger than the values we can see.
Section 1.2 Domain and Range 25
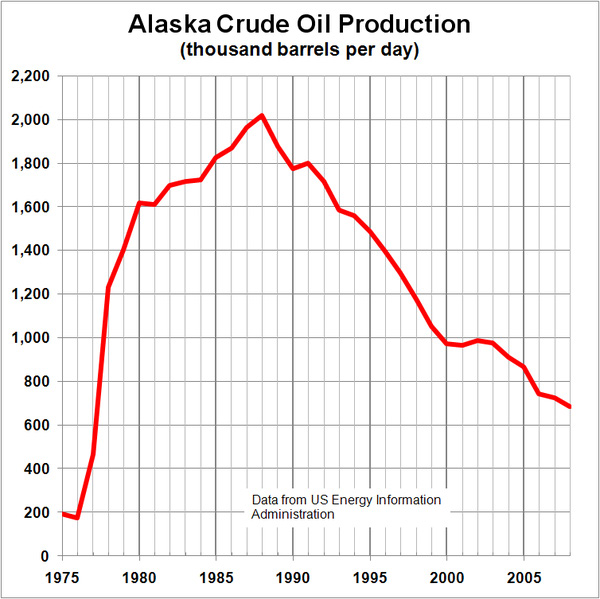
Example 4
Determine the domain and range of the graph below.
In the graph above3, the input quantity along the horizontal axis appears to be “year”, which we could notate with the variable y. The output is “thousands of barrels of oil per
day”, which we might notate with the variable b, for barrels. The graph would likely
continue to the left and right beyond what is shown, but based on the portion of the
graph that is shown to us, we can determine the domain is 1975 ≤ y ≤ 2008 , and the
range is approximately180 ≤ b ≤ 2010 .
In interval notation, the domain would be [1975, 2008] and the range would be about
[180, 2010]. For the range, we have to approximate the smallest and largest outputs
since they don’t fall exactly on the grid lines.
Remember that, as in the previous example, x and y are not always the input and output
variables. Using descriptive variables is an important tool to remembering the context of
the problem.
3 http://commons.wikimedia.org/wiki/File:Alaska_Crude_Oil_Production.PNG, CC-BY-SA, July 19, 2010
26 Chapter 1
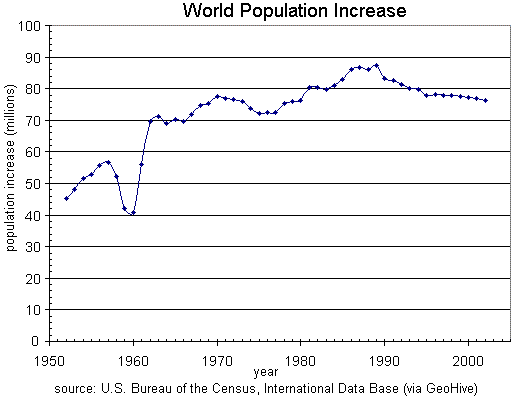
Try it Now
3. Given the graph below write the domain and range in interval notation
Domains and Ranges of the Toolkit functions
We will now return to our set of toolkit functions to note the domain and range of each.
Constant Function: f( x)= c
The domain here is not restricted; x can be anything. When this is the case we say the
domain is all real numbers. The outputs are limited to the constant value of the function.
Domain: (−∞,∞)
Range: [ c]