Make Your Retention Great Again: A Growth Hacker’s Guide to Retention Optimization by InnerTrends - HTML preview
Download the book in PDF, ePub, Kindle for a complete version.
Seriously though, been there, done that. I’ve struggled for years to find the magic bullet that will make retention optimization painless.
While I still don’t have a quick and easy answer, I’ve come to realise that if you change the way you look at retention, breaking it down into multiple stages, it becomes a much less scary beast.
So if you’re ready to turn your scary monster into a cute little kitten, something that even the most non-technical business owner can pet, stick around, because this one’s for you.
Specifically, are you looking at the retention rate of new signups or new signups who have finished your onboarding process?
It might sound like a tiny and insignificant detail but get it wrong and you run the risk of skewing your data.
If you said “new signups who finished the onboarding process” give yourself a gold star and go to the top of the class. Here’s why:
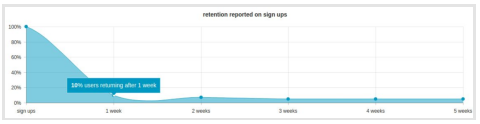
Scenario #1: Reporting retention on signups
Let’s say you want to find out how many of your visitors stick around one week after they decide to sign up.
You already know that your product had 3000 new sign ups and your report shows a first week retention rate of 10%. That means that just 300 users come back to your product after the first week.
Scenario #2: Reporting retention for onboarded users
Instead you decide to look at how many onboarded users stick around after one week.
You check the report again and, this time, see that out of the 3000 sign ups, 600 users successfully completed the onboarding process and 300 of them returne