Financial Inclusion in Russia by National Agency for Financial Studies - HTML preview
Download the book in PDF, ePub, Kindle for a complete version.
1.2 Customer perceptions
With access statistics available on the supply side, one of the objectives of this research was to see how satisfied customers are with the financial service delivery infrastructure, as well as with the quality of the main communications channels used for financial service delivery — mobile networks and the Internet. Figure 1 presents a summary of their responses.
Figure 1. Customer satisfaction with the number and location of financial service points/quality of communications channels
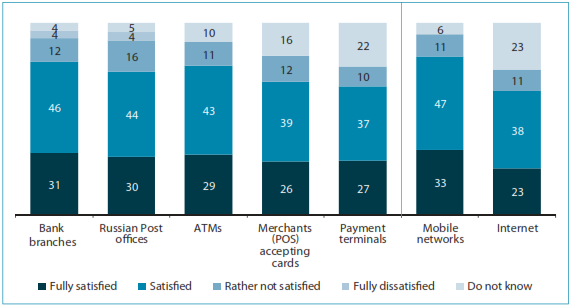
Note: Distribution of answers to the question “How satisfied are you with the number and location of the following financial service points/the quality of communication channels at your residence place?” (percentage of total respondents, n = 2800).
As indicated, the levels of satisfaction with the financial service infrastructure range from 64 percent to 77 percent, with higher levels for traditional channels, such as bank branches and the Russian Post offices.
The lowest satisfaction levels are expressed with respect to the number and location of merchants with POS terminals accepting cards. This is consistent with statistics on the sparse POS terminal infrastructure in Russia.
While, on average, the majority of respondents expressed overall satisfaction with the number and location of financial service points, the research revealed some regional variations in the satisfaction levels: in the Siberian FD, satisfaction levels are lower than average by 5–10 percent. People in this region are mostly dissatisfied with the number of Russian Post offices, the number and location of ATMs, and availability and quality of Internet connection and mobile communications.
It should be noted that aggregate statistics on bank branch distribution by regions in regard to population distribution might be hiding the issue of insufficient infrastructure as they do not capture the supply of physical access points in low-populated areas. This is partly confirmed by the finding that rural residents show higher dissatisfaction levels as compared to urban residents, with the number and location of bank branches (12 percent versus 8 percent), ATMs (10 percent versus 6 percent), payment terminals (9 percent versus 5 percent), and retail outlets equipped with POS terminals (13 percent versus 7 percent).
With respect to the quality of communications channels, it is clear that respondents are much more satisfied with the quality of mobile network connections than with the quality of Internet connections — the diff erence in satisfaction levels is 19 percent. This corresponds with available statistics on the mobile phone and Internet usage in Russia. Thus, according to GSMA data, in 2012 the unique mobile subscriber penetration in Russia was 73 percent,29 while the Internet coverage was 52 percent in 2013 according to Yandex research (with 70 percent in Moscow and St. Petersburg).30 The low Internet coverage affects the levels of Internet usage; according to this research, about one-third of respondents do not use it (Figure 2).
Figure 2. Distribution of respondents by frequency of Internet usage Daily
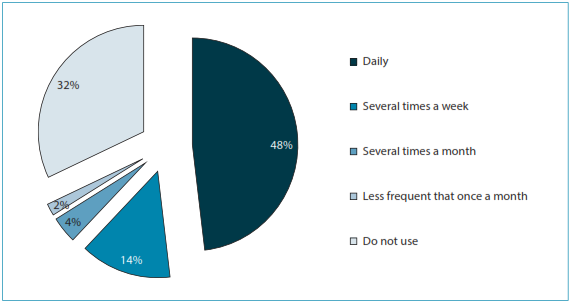
Note: Distribution of answers to the question “How often do you use the Internet?” (percentage of total respondents, n = 2800).
Additionally, the research aimed to see whether people were satisfied with the choice of service points available to them. While the majority felt that the choice is sufficient, 30 percent of respondents were not satisfied with it (Figure 3).
Figure 3. Customer satisfaction with the choice of financial service points
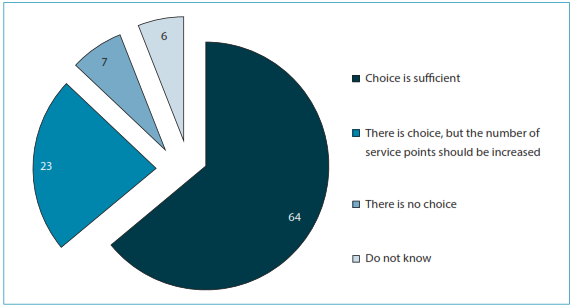
Note: Distribution of answers to the question “How do you assess the level of choice with respect to financial service points at your residence place?” (percentage of total respondents, n = 2800).
There are significant regional differences, as well as variations by settlement type, in satisfaction levels:
- The North Caucasian FD shows the lowest satisfaction levels — 52 percent, or 12 percentage points lower than on average. Seventeen percent of respondents in this region feel there is no choice versus 7 percent on average.
- Respondents in the Northwestern and Urals FDs most often feel that the number of service points should be increased (30 percent and 27 percent, respectively, versus 23 percent on average).
- Residents of Moscow, St. Petersburg, and regional capitals (69 percent, 79 percent, and 71 percent, respectively) more often feel that the number of service points is sufficient, as compared to the rest of Russia.
- The smaller the settlement, the more often respondents express the need to increase the number of service points.
- In rural areas, only 53 percent of respondent feel that the number of service points is sufficient.
For detailed breakdowns of the survey results on customer satisfaction levels with physical access to financial service delivery channels and quality of communications channels see Annex 3.