Biomedical Imaging by Youxin Mao - HTML preview
Download the book in PDF, ePub, Kindle for a complete version.
I
i
(5)
B
B
any misalignment of two rigid images will show various degrees of colour heterogeneity
i
I
i1
i1
distributed on the volumetric landmark, as shown in Fig. 2. Therefore, the homogeneity of
colour distribution on volumetric anatomical landmarks has been established as the visual
and the modified variance ( mVAR) with baseline correction is defined as:
registration criterion (Li et al, 2005).
2
2
It is worthwhile to mention that the greyscale of the mono-coloured image is controlled by
N I * I *
( I R) I
I *
i
N A
B
i
i
the RGB-LUT(s), which have a value of 0 to 1 (dark to bright). Such mono-colour greyscale is
mVAR
(6)
1
N
1
N
important to show the stereo-spatial effect; without it (e.g., a flat LUT=constant) the
i
i
landmarks are hard to be identified as 3D objects, except for the peripheral region in the 2D
image plane. So, an uneven greyscale should be used in the RGB-LUT(s), as shown in Fig. 4,
where I* I *
( I
I R I
i*
A
B
i
N is the average of modified VVID
i
i ) . This
and the colour greyscale variation should not be regarded as colour heterogeneity.
quantitative measure, when minimized, indicates an optimal image alignment from a single
viewing point.
2.3 Quantitative Criterion of the Volumetric Registration
Quantitatively, the above visual-based criterion for volumetric alignment can be directly
To evaluate the volumetric image alignment, multiple views (e.g., six views) should be used
translated into a mathematical expression. By definition, the homogeneity of the colour
to provide a comprehensive evaluation, although single view is sufficient for fine tuning
distribution on a given volumetric anatomical landmark should have minimal variance in
around the optimal alignment (Li, et al, 2007). A simple or weighted average of the mVAR
the visible voxel intensity difference (VVID) between any two mono-coloured imaging
from different views can serve as the cost function with a high confidence level, as each
modalities, namely a random colour distribution (or “snow pattern”). In other words, a
individual mVAR can be cross-verified with each other. In addition, the quantitative criteria
misalignment should appear to have a systematic, colour-biased distribution (or global
can be verified by visual examination with similar sensitivity, avoiding local minima.
alignment aberration), which should show a large variation of the VVID.
With uniform sampling across the image plane, about 4% of the pixels are sufficient for
2.4 Advantages of Volumetric Image Registration
With both the visual and the quantitative registration criteria, this interactive registration
evaluating the registration criterion. The visible voxels on the anatomical landmark can be
technique can be readily upgraded into an automatic registration technique, which is an on-
traced along the ray automatically using a special algorithm under the ray casting rendering
going investigation. Currently, the quantitative criterion can be applied in the fine-tuning
scheme (Li, et al, 2008c). Mathematically, for any visible voxel (i), the VVID is defined:
stage of image registration, minimizing the potential user dependency. As a comparison, the
2D visual based fusion technique does not have such quantitative evaluation on the
A
B
I
I I
i
i
i (3)
alignment. The precision for the rigid transformation and linear interpolation is set at 0.1
voxel (~mm), although it is not limited, matching the high spatial sensitivity of the 3DVIR
technique, as shown in Fig. 2. Similar accuracy has been found between the visual and
where A
I
I
i and
B
i (<256 = 8 bits) are the VVI from images A and B, respectively. For all
quantitative criteria (will be discussed in the next section), allowing visual verification of the
sampled voxels, the variance of the VVID is:
potential automatic 3DVIR with the consistent accuracy and reliability.
N ( I 2
N
A
I)
( I B
I I 2
)
The design of the volumetric image registration enables user to simultaneously process up
VAR
i
i
i
(4)
to four images, meeting the challenges of increasing imaging modalities used in the clinic
i1
N
i1
N
and eliminating potential error propagation from separated registrations. The flowchart of
the volumetric image registration process is demonstrated in Fig. 5. The image buffer (32
where I I
bits) is divided into 4 fields for 4 images (8 bits or 256 greyscale each). Transformation
i N represents the average of the VVID and N is the total number of
operation can be applied to any of the four image fields for alignment and all four images
the voxels sampled, excluding completely transparent rays. In case of two identical images,
are rendered together for real-time visual display, supported by a graph processing unit
the variance of VVID approaches zero at the perfect alignment, as shown in Fig. 2.
Volumetric
Image Registration of Multi-modality Images of CT, MRI and PET
9
2.2 Visual Criterion of the Volumetric Image Registration
In multi-modality image registration, the average voxel intensity of an anatomical landmark
When two mono-coloured, identical images are overlaid in space, the colour blending of the
can differ substantially between modalities, so a baseline correction is required. Therefore, a
equal-intensity (greyscale) voxels produce a homogeneously coloured image based on the
modality baseline weighting factor (R) is introduced as:
colour synthesis rule of light. For instance, the overlay of equally-weighted red and green
will result in a yellow appearance. Therefore, an ideal image alignment will show a perfect
A
N
N
homogeneous colour distribution on a volumetric anatomic landmark. On the other hand,
I
R
A
I
I
i
(5)
B
B
any misalignment of two rigid images will show various degrees of colour heterogeneity
i
I
i1
i1
distributed on the volumetric landmark, as shown in Fig. 2. Therefore, the homogeneity of
colour distribution on volumetric anatomical landmarks has been established as the visual
and the modified variance ( mVAR) with baseline correction is defined as:
registration criterion (Li et al, 2005).
2
2
It is worthwhile to mention that the greyscale of the mono-coloured image is controlled by
N I * I *
( I R) I
I *
i
N A
B
i
i
the RGB-LUT(s), which have a value of 0 to 1 (dark to bright). Such mono-colour greyscale is
mVAR
(6)
1
N
1
N
important to show the stereo-spatial effect; without it (e.g., a flat LUT=constant) the
i
i
landmarks are hard to be identified as 3D objects, except for the peripheral region in the 2D
image plane. So, an uneven greyscale should be used in the RGB-LUT(s), as shown in Fig. 4,
where I* I *
( I
I R I
i*
A
B
i
N is the average of modified VVID
i
i ) . This
and the colour greyscale variation should not be regarded as colour heterogeneity.
quantitative measure, when minimized, indicates an optimal image alignment from a single
viewing point.
2.3 Quantitative Criterion of the Volumetric Registration
Quantitatively, the above visual-based criterion for volumetric alignment can be directly
To evaluate the volumetric image alignment, multiple views (e.g., six views) should be used
translated into a mathematical expression. By definition, the homogeneity of the colour
to provide a comprehensive evaluation, although single view is sufficient for fine tuning
distribution on a given volumetric anatomical landmark should have minimal variance in
around the optimal alignment (Li, et al, 2007). A simple or weighted average of the mVAR
the visible voxel intensity difference (VVID) between any two mono-coloured imaging
from different views can serve as the cost function with a high confidence level, as each
modalities, namely a random colour distribution (or “snow pattern”). In other words, a
individual mVAR can be cross-verified with each other. In addition, the quantitative criteria
misalignment should appear to have a systematic, colour-biased distribution (or global
can be verified by visual examination with similar sensitivity, avoiding local minima.
alignment aberration), which should show a large variation of the VVID.
With uniform sampling across the image plane, about 4% of the pixels are sufficient for
2.4 Advantages of Volumetric Image Registration
With both the visual and the quantitative registration criteria, this interactive registration
evaluating the registration criterion. The visible voxels on the anatomical landmark can be
technique can be readily upgraded into an automatic registration technique, which is an on-
traced along the ray automatically using a special algorithm under the ray casting rendering
going investigation. Currently, the quantitative criterion can be applied in the fine-tuning
scheme (Li, et al, 2008c). Mathematically, for any visible voxel (i), the VVID is defined:
stage of image registration, minimizing the potential user dependency. As a comparison, the
2D visual based fusion technique does not have such quantitative evaluation on the
A
B
I
I I
i
i
i (3)
alignment. The precision for the rigid transformation and linear interpolation is set at 0.1
voxel (~mm), although it is not limited, matching the high spatial sensitivity of the 3DVIR
technique, as shown in Fig. 2. Similar accuracy has been found between the visual and
where A
I
I
i and
B
i (<256 = 8 bits) are the VVI from images A and B, respectively. For all
quantitative criteria (will be discussed in the next section), allowing visual verification of the
sampled voxels, the variance of the VVID is:
potential automatic 3DVIR with the consistent accuracy and reliability.
N ( I 2
N
A
I)
( I B
I I 2
)
The design of the volumetric image registration enables user to simultaneously process up
VAR
i
i
i
(4)
to four images, meeting the challenges of increasing imaging modalities used in the clinic
i1
N
i1
N
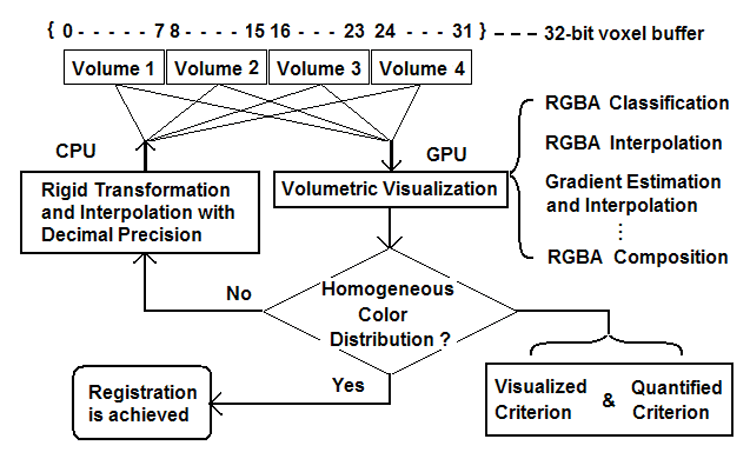
and eliminating potential error propagation from separated registrations. The flowchart of
the volumetric image registration process is demonstrated in Fig. 5. The image buffer (32
where I I
bits) is divided into 4 fields for 4 images (8 bits or 256 greyscale each). Transformation
i N represents the average of the VVID and N is the total number of
operation can be applied to any of the four image fields for alignment and all four images
the voxels sampled, excluding completely transparent rays. In case of two identical images,
are rendered together for real-time visual display, supported by a graph processing unit
the variance of VVID approaches zero at the perfect alignment, as shown in Fig. 2.
10
Biomedical Imaging
(GPU), or volume rendering video card (volumePro, Terarecon, Inc.). The alignment
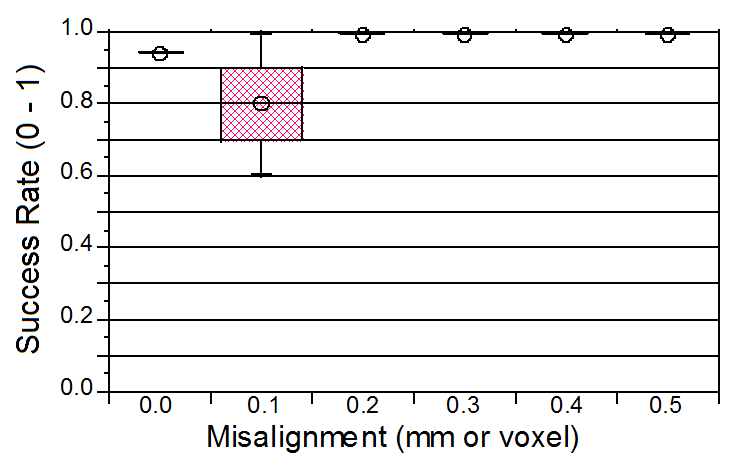
with or without spatial misalignments. Twelve images with known shifts of 0.0, 0.1 and 0.2
evaluation is based on multiple views by rotating the image volumes with mouse control in
unit (mm or degree) were shown to the observers, and the success rates are 94%, 80% and
real-time. If the criterion is not satisfied, more transformations will be done iteratively until
100%, respectively, as shown in Figs. 2 and 6. The visual detection limit is determined to be
the alignment is achieved.
0.1 or 0.1 mm, where the colour homogeneity/inhomogeneity on the skin landmark starts to
become indistinguishable to some of the observers. Half of these observers saw such
volumetric images for the first time and visual training could improve the success rate.
Fig. 5. Illustration of the working flow of the volume-view-guided image registration. (taken
from Li, et al, JACMP, 2008c)
Fig. 6. Success rate of identification of colour inhomogeneity or homegeneity in misaligned or
aligned images. The visual detection limits of 0.1 and 0.1 mm are determined.
3. Accuracy of 3D Volumetric Image Registration
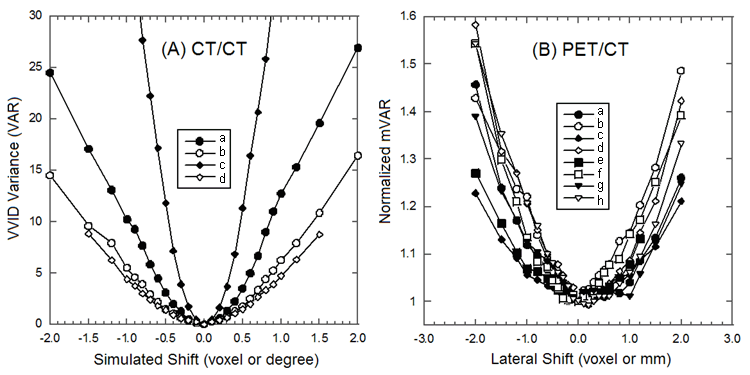
Quantitatively, the detection limit was evaluated using plots of the VVID vs. misalignment
3.1 Sensitivity of Volumetric Registration Criteria
from different viewing angles. U-shaped curves are observed with the nadir at the perfect
The colour homogeneity (or variance of the VVID) is defined in a new dimension beyond
alignment, as shown in Fig. 7. The result is generally consistent with the visual detection limit
the 3D volumetric space, in which the image alignment is examined. The sensitivity of the
of 0.1 and 0.1 mm, with higher precision. For single modality, the variance in Eq. 4 is used and
3DVIR criteria is enhanced by visual amplification of the alignment on classified volumetric
for dual modality, the modified variance in Eq. 6 is used. Although the U-curves become
landmarks, where a large greyscale gradient exists at the interface. For instances, the
shallow when different imaging modalities are processed, correct image registration (from
interfaces of skin/air and bone/soft tissue possess very large intensity gradient. In CT
single or hybrid image scanner) is achieved.
images, the greyscale at these interfaces spans half of the entire intensity range (-1000 HU to
+1000 HU). Mathematically, this can be expressed as:
dVVI
dVVI dD or
1 (7)
dD
where dVVI is the intensity differential resulting from dD, which is the spatial displacement
within a voxel (~1 mm). So, the VVID (the difference of the VVIs in two images) should
possess a large change upon a small spatial shift. In other words, a small spatial difference will
be amplified as a large VVID or colour inhomogeneity. This signal amplification nature is the
foundation for the 3DVIR to become extremely sensitive.
The visual detection limit has been evaluated using eight clinical professionals, who were
asked to identify colour inhomogeneity or homogeneity for given sets of volumetric images
Volumetric
Image Registration of Multi-modality Images of CT, MRI and PET
11
(GPU), or volume rendering video card (volumePro, Terarecon, Inc.). The alignment
with or without spatial misalignments. Twelve images with known shifts of 0.0, 0.1 and 0.2
evaluation is based on multiple views by rotating the image volumes with mouse control in
unit (mm or degree) were shown to the observers, and the success rates are 94%, 80% and
real-time. If the criterion is not satisfied, more transformations will be done iteratively until
100%, respectively, as shown in Figs. 2 and 6. The visual detection limit is determined to be
the alignment is achieved.
0.1 or 0.1 mm, where the colour homogeneity/inhomogeneity on the skin landmark starts to
become indistinguishable to some of the observers. Half of these observers saw such
volumetric images for the first time and visual training could improve the success rate.
Fig. 5. Illustration of the working flow of the volume-view-guided image registration. (taken
from Li, et al, JACMP, 2008c)
Fig. 6. Success rate of identification of colour inhomogeneity or homegeneity in misaligned or
aligned images. The visual detection limits of 0.1 and 0.1 mm are determined.
3. Accuracy of 3D Volumetric Image Registration
Quantitatively, the detection limit was evaluated using plots of the VVID vs. misalignment
3.1 Sensitivity of Volumetric Registration Criteria
from different viewing angles. U-shaped curves are observed with the nadir at the perfect
The colour homogeneity (or variance of the VVID) is defined in a new dimension beyond
alignment, as shown in Fig. 7. The result is generally consistent with the visual detection limit
the 3D volumetric space, in which the image alignment is examined. The sensitivity of the
of 0.1 and 0.1 mm, with higher precision. For single modality, the variance in Eq. 4 is used and
3DVIR criteria is enhanced by visual amplification of the alignment on classified volumetric
for dual modality, the modified variance in Eq. 6 is used. Although the U-curves become
landmarks, where a large greyscale gradient exists at the interface. For instances, the
shallow when different imaging modalities are processed, correct image registration (from
interfaces of skin/air and bone/soft tissue possess very large intensity gradient. In CT
single or hybrid image scanner) is achieved.
images, the greyscale at these interfaces spans half of the entire intensity range (-1000 HU to
+1000 HU). Mathematically, this can be expressed as:
dVVI
dVVI dD or
1 (7)
dD
where dVVI is the intensity differential resulting from dD, which is the spatial displacement
within a voxel (~1 mm). So, the VVID (the difference of the VVIs in two images) should
possess a large change upon a small spatial shift. In other words, a small spatial difference will
be amplified as a large VVID or colour inhomogeneity. This signal amplification nature is the
foundation for the 3DVIR to become extremely sensitive.
The visual detection limit has been evaluated using eight clinical professionals, who were
asked to identify colour inhomogeneity or homogeneity for given sets of volumetric images