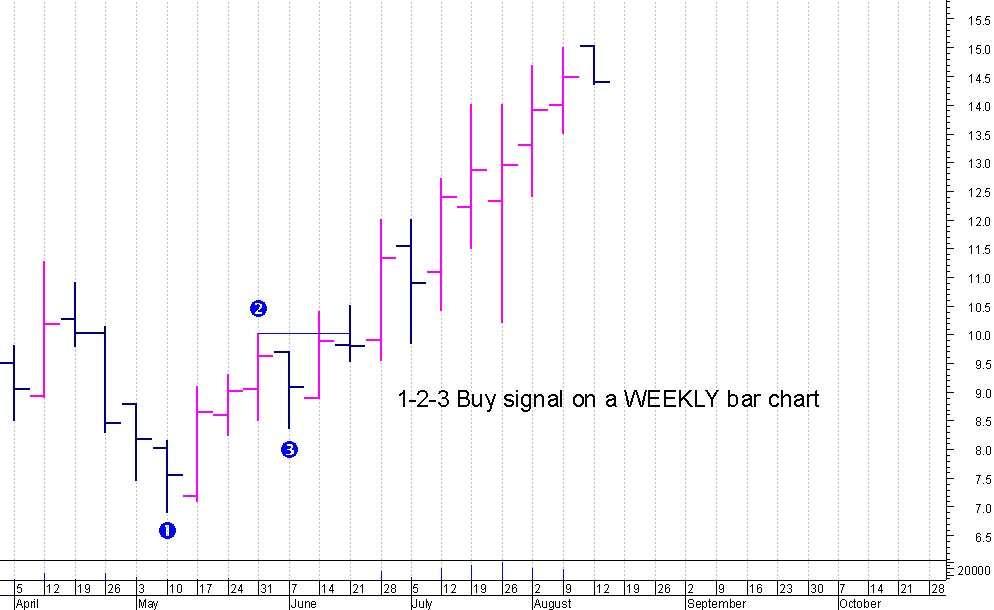
Fantastic! Look at the powerful 1-2-3 bottoming pattern that gave a valid buy signal at $9.80. This share was at $14.50 at the time of writing. A whopping 48% gain 10 weeks. Who knows where it will end up. Consider this. How long did it take me to spot, manage and profit from this trade? Considering this is a WEEKLY bar chart. A few minutes on a weekend. If this doesn’t prove what a fantastic signal the 1-2-3 is…… you are a tough one to please.
OK let’s look at one more
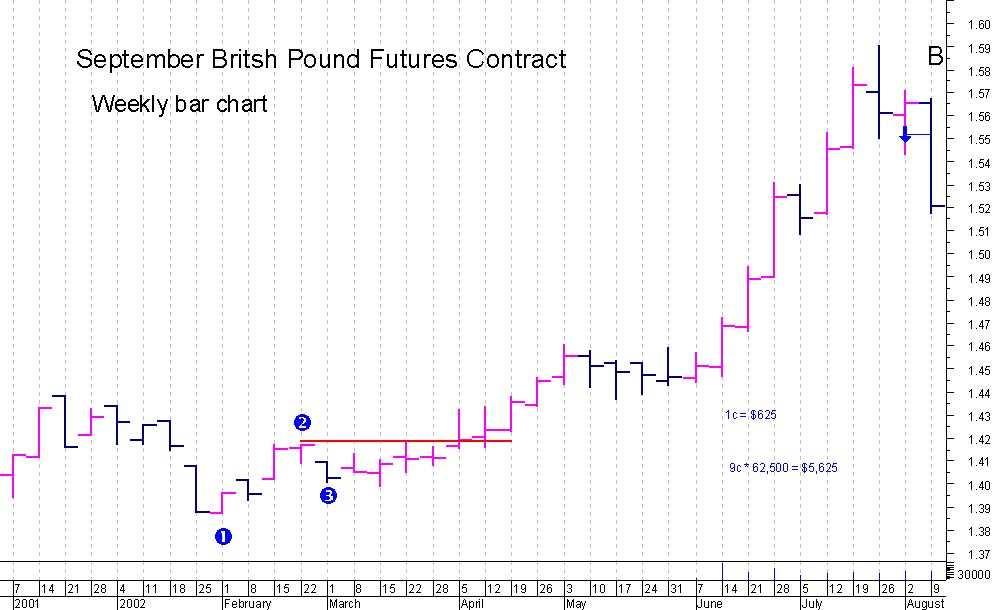 British Pound futures contract, viewed on a weekly bar chart. Again, a very powerful up trend after the valid 1-2-3 buy pattern.
 Lastly, let me prove that this 1-2-3 pattern is just as valid on a monthly chart as it is on any other time frame.
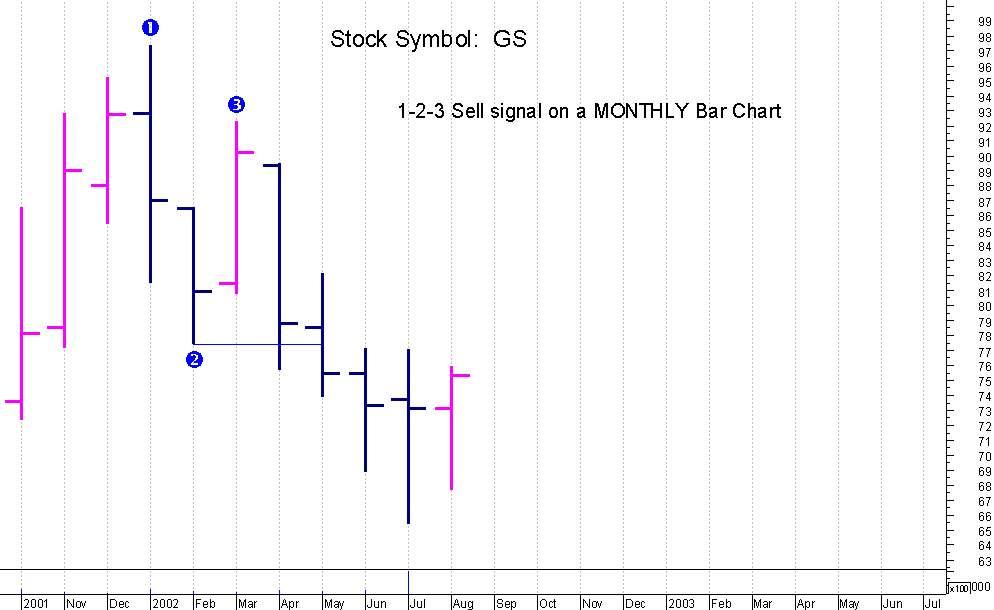
So, you remember what I said above? About how generally the more bars that are involved in the 1-2-3 pattern the more powerful and long lasting the move is. Where do you now think the biggest move is:
A daily chart where the 1-2-3 develops over five bars? OrA monthly chart where the 1-2-3 pattern develops over ten bars?
Of course you said b. Bear this in mind. Generally 1-2-3 patterns on monthly
Of course you said b. Bear this in mind. Generally 1-2-3 patterns on monthly 2-3 on a weekly chart indicates bigger trend than one developed on a daily chart and so on…
Here is a very general rule of thumb table for you to consider. Consider that if you spot a 1-2-3 bottom on the NASDAQ monthly it could signal a new bull market that could last 6 months to two years plus.
1-2-3 Length of chart Generally the move could lastdaily chart 2 – 8 weeks
weekly chart 4- 16 weeks
monthly chart 2 to 12 months