OK to quickly recap this is what a valid 1-2-3 signal looks like on a bar chart. This is a PERFECTLY FORMED 1-2-3 signal. But as we all know we do not live in a perfect world, especially when it comes to looking at stock charts.
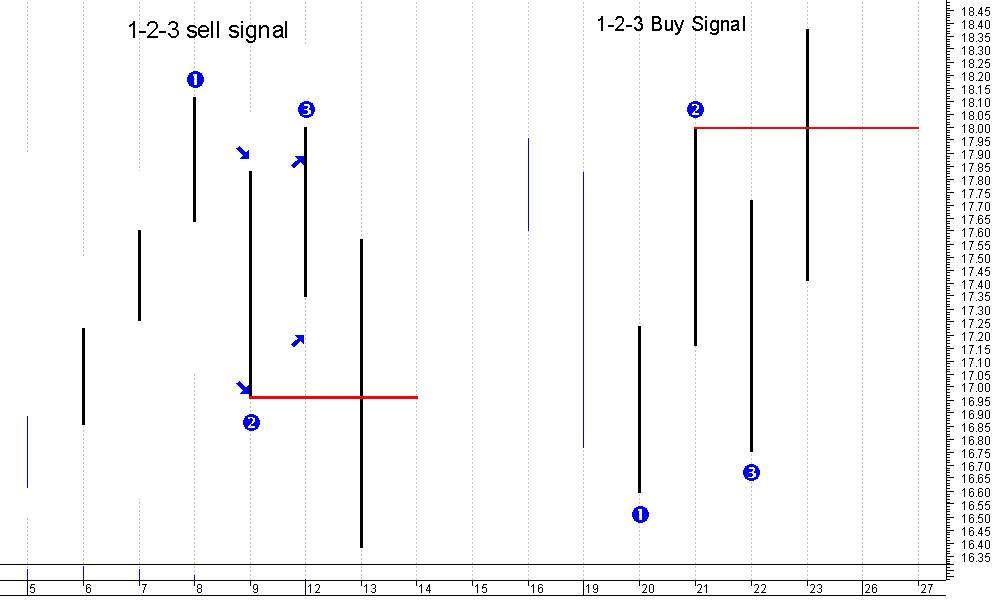 So there is absolutely nothing wrong with 1-2-3 formations forming over several bars as opposed to the one bar corrections above. Let us have a look.
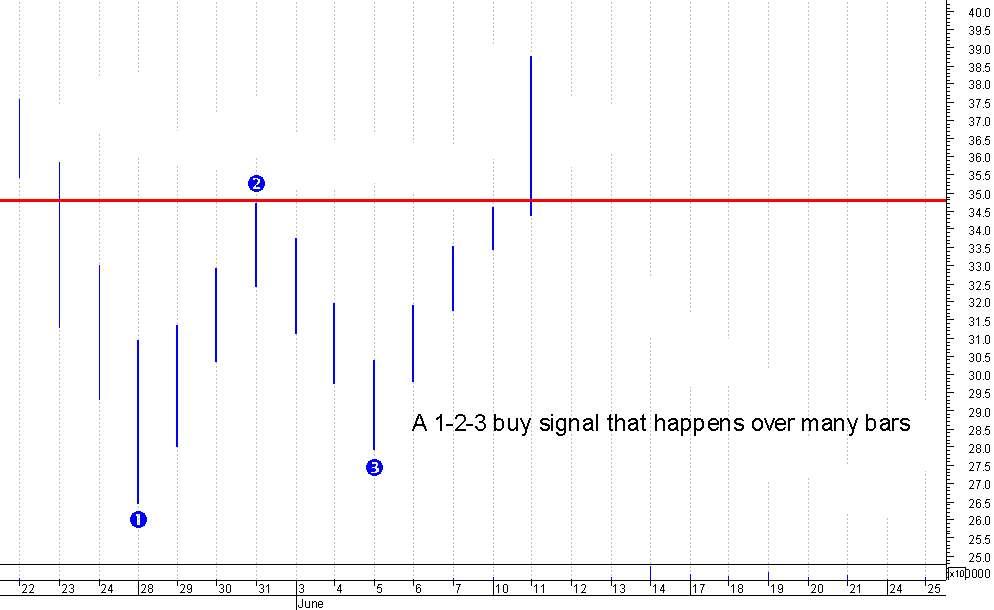
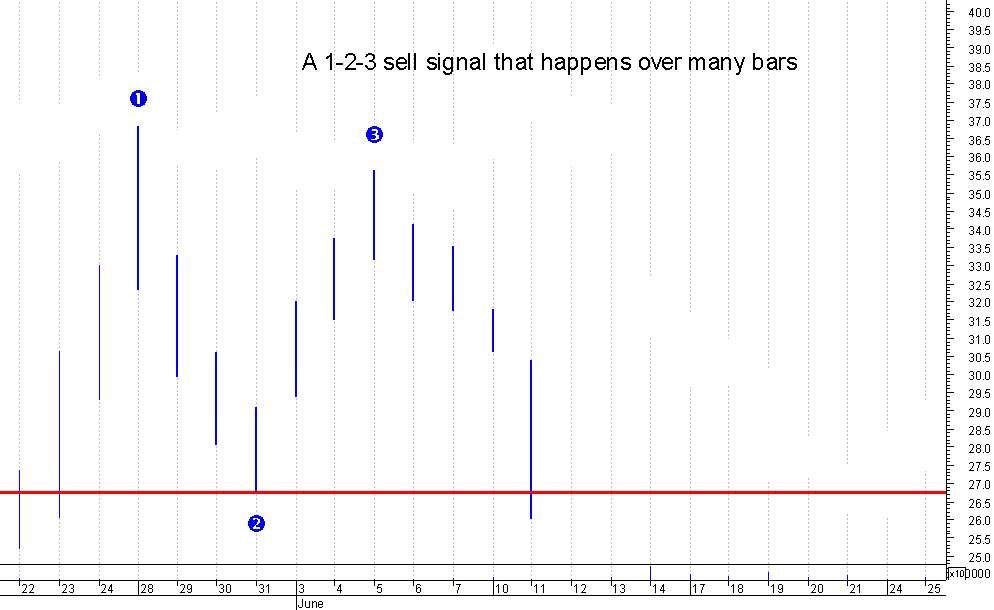 As you can see sometimes the 1-2-3 pattern happens very quickly or it can take time to develop.
 Here is an important point for you to remember:
Generally, the more bars that are involved in the 1-2-3 buy or sell pattern THE BIGGER the move. In the above three examples I would expect bigger moves form the last two examples as opposed to the first one. Simply because there are more bars involved in the 1-2-3 patterns. Like I say, it is a general rule. Not hard and fast. Something for you to chew over.
Now, 1-2-3 patterns happen in ALL time frames. I mean from 5 minute tick charts right the way through to yearly charts. As I have never and never will day trade I am not going to show any examples of this. But let’s look at weekly and monthly charts, just to prove to you that the 1-2-3 pattern is valid in these time frames.