Purdue Digital Signal Processing Labs by Charles A. Bouman - HTML preview
Download the book in PDF, ePub, Kindle for a complete version.
Chapter 2. Lab 1 - Discrete and Continuous-Time Signals
Questions or comments concerning this laboratory should be directed to Prof. Charles A. Bouman, School of Electrical and Computer Engineering, Purdue University, West Lafayette IN 47907; (765) 494-0340; bouman@ecn.purdue.edu
Introduction
The purpose of this lab is to illustrate the properties of continuous and discrete-time signals using digital computers and the Matlab software environment. A continuous-time signal takes on a value at every point in time, whereas a discrete-time signal is only defined at integer values of the “time” variable. However, while discrete-time signals can be easily stored and processed on a computer, it is impossible to store the values of a continuous-time signal for all points along a segment of the real line. In later labs, we will see that digital computers are actually restricted to the storage of quantized discrete-time signals. Such signals are appropriately known as digital signals.
How then do we process continuous-time signals? In this lab, we will show that continuous-time signals may be processed by first approximating them by discrete-time signals using a process known as sampling. We will see that proper selection of the spacing between samples is crucial for an efficient and accurate approximation of a continuous-time signal. Excessively close spacing will lead to too much data, whereas excessively distant spacing will lead to a poor approximation of the continuous-time signal. Sampling will be an important topic in future labs, but for now we will use sampling to approximately compute some simple attributes of both real and synthetic signals.
Be sure to read the guidelines for the written reports.
Matlab Review
Practically all lab tasks in the ECE438 lab will be performed using Matlab. Matlab (MATrix LABoratory) is a technical computing environment for numerical analysis, matrix computation, signal processing, and graphics. In this section, we will review some of its basic functions. For a short tutorial and some Matlab examples click here.
Starting Matlab and Getting Help
You can start Matlab (version 7.0) on your workstation by typing the command
matlab
in a command window. After starting up, you will get a Matlab window. To get help on any specific command, such as “plot”, you can type the following
help plot
in the “Command Window” portion of the Matlab window. You can do a keyword search for commands related to a topic by using the following.
lookfor topic
You can get an interactive help window using the function
helpdesk
or by following the Help menu near the top of the window.
Matrices and Operations
Every element in Matlab is a matrix. So, for example, the Matlab command

creates a matrix named “a” with dimensions of 1×3. The variable “a” is stored in what is called the Matlab workspace. The operation
b = a .'
stores the transpose of “a” into the vector “b”. In this case, “b” is a 3×1 vector.
Since each element in Matlab is a matrix, the operation
c = a * b
computes the matrix
product of “a” and “b”
to generate a scalar
value for “c” of 
Often, you may want to apply an operation to each element of a vector. For example, you many want to square each value of “a”. In this case, you may use the following command.
c = a .* a
The dot before the *
tells Matlab that the multiplication
should be applied to each corresponding element of “a”.
Therefore the .*
operation is not a matrix operation.
The dot convention works with many other Matlab commands
such as divide ./
, and power .^.
An error results if you try to perform element-wise operations on matrices that aren't the same size.
Note also that while the operation a .' performs a transpose on the matrix "a", the operation a ' performs a conjugate transpose on "a" (transposes the matrix and conjugates each number in the matrix).
Matlab Scripts and Functions
Matlab has two methods for saving sequences of commands as standard files. These two methods are called scripts and functions. Scripts execute a sequence of Matlab commands just as if you typed them directly into the Matlab command window. Functions differ from scripts in that they accept inputs and return outputs, and variables defined within a function are generally local to that function.
A script-file is a text file with the filename extension ".m". The file should contain a sequence of Matlab commands. The script-file can be run by typing its name at the Matlab prompt without the .m extension. This is equivalent to typing in the commands at the prompt. Within the script-file, you can access variables you defined earlier in Matlab. All variables in the script-file are global, i.e. after the execution of the script-file, you can access its variables at the Matlab prompt. For more help on scripts click here.
To create a function called func,
you first create a text file called func.m.
The first line of the file must be
function output = func(input)
where input designates the set of input variables, and output
are your output variables.
The rest of the function file then contains the desired operations.
All variables within the function are local; that means the function
cannot access Matlab workspace variables that you don't pass as inputs.
After the execution of the function,
you cannot access internal variables of the function.
For more help on functions click here.
Continuous-Time Vs. Discrete-Time
The "Introduction" mentioned the important issue of representing continuous-time signals on a computer. In the following sections, we will illustrate the process of sampling, and demonstrate the importance of the sampling interval to the precision of numerical computations.
Analytical Calculation
Compute these two integrals. Do the computations manually.
- (2.1) ∫0 2 π s i n2 ( 5 t ) d t
- (2.2) ∫01etd t
Hand in your calculations of these two integrals. Show all work.
Displaying Continuous-Time and Discrete-Time Signals in Matlab
For help on the following topics, visit the corresponding link: Plot Function, Stem Command, and Subplot Command.
It is common to graph a discrete-time signal as dots
in a Cartesian coordinate system.
This can be done in the Matlab environment
by using the stem command.
We will also use the subplot command
to put multiple plots on a single figure.
Start Matlab on your workstation and type the following sequence of commands.
n = 0:2:60;
y = sin(n/6);
subplot(3,1,1)
stem(n,y)
This plot shows the discrete-time signal formed by computing the values of the function sin ( t / 6 ) at points which are uniformly spaced at intervals of size 2. Notice that while sin ( t / 6 ) is a continuous-time function, the sampled version of the signal, sin(n/6), is a discrete-time function.
A digital computer cannot store all points of a continuous-time
signal since this would require an infinite amount of memory.
It is, however, possible to plot a signal which looks like
a continuous-time signal, by computing
the value of the signal at closely spaced points in time,
and then connecting the plotted points with lines.
The Matlab plot function may be used to generate
such plots.
Use the following sequence of commands to generate two continuous-time plots of the signal sin ( t / 6 ) .
n1 = 0:2:60;
z = sin(n1/6);
subplot(3,1,2)
plot(n1,z)
n2 = 0:10:60;
w = sin(n2/6);
subplot(3,1,3)
plot(n2,w)
As you can see, it is important to have many points to make the signal appear smooth. But how many points are enough for numerical calculations? In the following sections we will examine the effect of the sampling interval on the accuracy of computations.
Submit a hard copy
of the plots of the discrete-time function
and two continuous-time functions.
Label them with the
title command, and include your names.
Comment on the accuracy of each of the continuous time
plots.
Numerical Computation of Continuous-Time Signals
For help on the following topics, click the corresponding link: MatLab Scripts, MatLab Functions, and the Subplot Command.
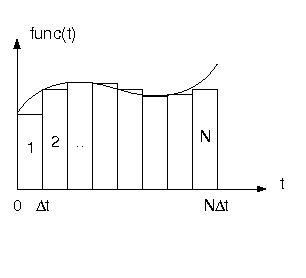
One common calculation on continuous-time signals is integration. Figure 2.1 illustrates a method used for computing the widely used Riemann integral. The Riemann integral approximates the area under a curve by breaking the region into many rectangles and summing their areas. Each rectangle is chosen to have the same width Δt, and the height of each rectangle is the value of the function at the start of the rectangle's interval.
To see the effects of using a different number of points
to represent a continuous-time signal,
write a Matlab function
for numerically computing the integral
of the function
s
i
n2
(
5
t
)
over the interval
[
0
,
2
π
]
.
The syntax of the function should be
I=integ1(N)
where
I
is the result and
N
is the number of rectangles
used to approximate the integral.
This function should use the sum command
and it should not contain any for loops!
Since Matlab is an interpreted language, for loops are relatively slow. Therefore, we will avoid using loops whenever possible.
Next write an m-file script that evaluates I(N) for 1≤N≤100, stores the result in a vector and plots the resulting vector as a function of N. This m-file script may contain for loops.
Repeat this procedure for a second function
J=integ2(N)
which numerically computes the integral of exp(t) on the interval [0,1].
Submit plots of I(N) and J(N) versus N. Use the subplot command to put both plots on a single sheet of paper. Also submit your Matlab code for each function. Compare your results to the analytical solutions from the "Analytical Calculation" section. Explain why I(5)=I(10)=0.
Processing of Speech Signals
For this section download the speech.au file. For instructions on how to load and play audio signals click here.
Digital signal processing is widely used in speech processing for applications ranging from speech compression and transmission, to speech recognition and speaker identification. This exercise will introduce the process of reading and manipulating a speech signal.
First download the speech audio file speech.au, and then do the following:
Use the
aureadcommand to load the file speech.au into Matlab.Plot the signal on the screen as if it were a continuous-time signal (i.e. use the
plotcommand).Play the signal via the digital-to-analog converter in your workstation with the Matlab
soundfunction.
Submit your plot of the speech signal.
Attributes of Continuous-Time Signals
For this section download the signal1.p function.
In this section you will practice writing .m-files
to calculate the basic attributes of continuous-time signals.
Download the function signal1.p.
This is a pre-parsed pseudo-code file (P-file), which is
a “pre-compiled” form of the Matlab function signal1.m.
To evaluate this function,
simply type y = signal1(t)
where t
is a vector
containing values of time.
Note that this Matlab function is valid for any real-valued time, t
,
so y = signal1(t)
yields samples of a continuous-time function.
First plot the function using the plot command.
Experiment with different values for the sampling period
and the starting and ending times, and choose values that
yield an accurate representation of the signal.
Be sure to show the corresponding times in your plot using a command
similar to plot(t,y).
Next write individual Matlab functions to compute the
minimum, maximum, and approximate energy of this particular signal.
Each of these functions should just accept an input vector of times, t,
and should call signal1(t) within the body of the function.
You may use the built-in Matlab functions min and max.
Again, you will need to experiment with the sampling period,
and the starting and ending times so that your computations of the min, max, and energy are accurate.
Remember the definition of the energy is

Submit a plot of the function, and the computed values of the min, max, and energy. Explain your choice of the sampling period, and the starting and ending times. Also, submit the code for your energy function.
Special Functions
Plot the following two continuous-time functions over
the specified intervals. Write separate script files if you prefer.
Use the subplot command to put both plots in a single figure,
and be sure to label the time axes.
sinc(t) for t in [–10π,10π]
rect(t) for t in [–2,2]
The function rect(t) may be computed in Matlab
by using a Boolean expression.
For example, if t=-10:0.1:10,
then y=rect(t) may be computed using the Matlab command
y=(abs(t)<=0.5).
Write an .m-script file to stem
the following discrete-time function for a=0.8, a=1.0 and a=1.5.
Use the subplot command to put all three plots
in a single figure.
Issue the command orient('tall')
just prior to printing to prevent crowding of the subplots.
an(u(n)–u(n–10)) for n in [–20,20]
Repeat this procedure for the function
cos(ωn)anu(n) for ω = π / 4, and n in [–1,10]
The unit step function y = u(n) may be computed in Matlab
using the command y = (n>=0)
, where n
is a vector of time indices.
Submit all three figures, for a total of 8 plots. Also submit the printouts of your Matlab .m-files.
Sampling
The word sampling refers to the conversion of a continuous-time signal into a discrete-time signal. The signal is converted by taking its value, or sample, at uniformly spaced points in time. The time between two consecutive samples is called the sampling period. For example, a sampling period of 0.1 seconds implies that the value of the signal is stored every 0.1 seconds.
Consider the signal f(t)=sin(2πt). We may form a discrete-time signal, x(n), by sampling this signal with a period of Ts. In this case,

Use the stem command to plot the function
Find Your Next Great Read
Describe what you're looking for in as much detail as you'd like.
Our AI reads your request and finds the best matching books for you.
Popular searches:
Create a Free Account to Download
Join 9.7 million readers — your free account takes a minute, and your first book is ready right away