Applied Computational Fluid Dynamics by Hyoung Woo Oh - HTML preview
Download the book in PDF, ePub, Kindle for a complete version.

64
Applied Computational Fluid Dynamics
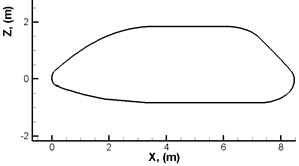
Fig. 1. Vehicle configurations with quotes.
2.1 Freestream conditions
The flight scenario considered so far is summarized in Table 1. They refer to entry
conditions compatible with a vehicle entering the Mars atmosphere both from a hyperbolic
orbit (HO), e.g., direct planetary entry, and an elliptic orbit (EO) e.g., planetary entry after aerobraking (Gupta et al., 1996).
Mach
AoA
Altitude
[-]
[deg] [km]
Perfect Gas
10
10
10.0
15
40
60.0
22
40
60.0
EO PH
22
40
44.2
HO PH
26
40
52.1
Reacting Gas
10
10
10.0
10
20
10.0
10
30
10.0
10
40
10.0
NCW
22
40
44.2
EO PH
FCW
22
40
44.2
NCW
26
40
52.1
HO PH
FCW
26
40
52.1
EO PH (Elliptic Orbit Peak Heating)
HO PH (Hyperbolic Orbit Peak Heating)
NCW (Non-Catalytic Wall)
FCW (Fully Catalytic Wall)
Table 1. CFD freestream conditions
Therefore, thirteen CFD numerical simulations have been performed. As one can see, CFD
computations (both Euler and Navier-Stokes) have been performed, both in trajectory-based
and space-based design approaches (Hanley et al., 1964). Several Mach numbers and
Fluid Dynamics Analysis of a Space Vehicle Entering the Mars Atmosphere
65
different angles of attack () have been investigated and compared each other. The Fluent
code together with user defined functions (UDFs), developed in order to simulate mixtures
of gas in thermo-chemical non-equilibrium, have been used for CFD computations with a
non-equilibrium chemical model suitable for Martian atmosphere (Gupta et al., 1996) (Mack
et al., 2008) (Kustova et al., 2009).
For the reacting gas computations, the Martian atmosphere has been considered as a
mixture of 95.7% carbon-dioxide, 1.6% Argon and 2.7% nitrogen. The flow has been
modelled as a reacting gas mixture of 9 species (Ar, CO2, N2, O2, CO, NO, N, O, C) involved
in the chemical reactions of Table 2 (Park et al., 1994) (Anderson, 1989). The reaction
mechanism and the related chemical kinetics, taken into account in the present work, are
summarized in Table 2, where M is the reacting partner (third body) that can be any of the
nine reacting species of the gas mixture.
Non-equilibrium computations have been performed since one of the most challenging
problem facing the design of atmospheric entry vehicle is the phenomenon of “real gas
behaviour”. At hypersonic speeds, the shock wave produced ahead of the vehicle suddenly
elevates the gas temperature in the shock layer. So the gas thermal energy may be
comparable with the energy associated with a whole range of gas chemical processes such
as: molecular vibrational excitation; dissociation of atmospheric molecules into their atomic forms; formation of other chemical species through recombination reactions; and ionisation
of both molecular and atomic species (Park et al., 1994).
Reaction
Third Body
A
T
r
r
d
M
[cm3mol-1s-1]
[K]
CO M CO O M
CO
2
2,CO,N2,O2,NO
6.9x10²¹ -1.5
63275
Ar
6.9x10²⁰
C,N,O
1.4x10²²
CO M C O M
CO2,CO,N2,O2,NO
2.3x10²⁰ -1.0
129000
Ar
2.3x10¹⁹
C,N,O
3.4x10²⁰
N M N N M
CO
2
2,CO,N2,O2,NO
7.0x10²¹ -1.6
113200
Ar
7.0x10²¹
C,N,O
3.0x10²²
O M O O M
CO
2
2,CO,N2,O2,NO
2.0x10²¹ -1.5
59750
Ar
3.0x10²¹
C,N,O
3.0x10²²
NO M N O M
CO2,C,N,O,NO
1.1x10¹⁷ 0.0
75500
Ar
5.0x10¹⁵
CO,N2,O2
5.0x10¹⁵
C2+M C+C+M
All
2.0x10²¹ -1.5
59750
NCO+M CO+N+M
All
6.3x10¹⁶ -0.5
24000
NO O N O
8.4x10¹² 0.0
19450
2
N O NO N
6.4x10¹⁷ -1.0
38370
2
CO O C O
3.9x10¹³ -0.18
69200
2
CO O CO O
2.1x10¹³ 0.00
27800
2
2
Table 2. Reactions mechanism and rate parameters (Park et al., 1994).

66
Applied Computational Fluid Dynamics
Therefore, the gas mixture has to be considered in thermal and chemical non-equilibrium.
Finally, the CFD analysis of the MBS have been preceded by a code validation phase
performed considering the available numerical and experimental data for the Mars
Pathfinder probe at entry peak heating conditions, as summarized in (Viviani et al., 2010)
(Gnoffo et al., 1998) (Gnoffo et al., 1996) (Mitcheltree et al., 1995).
2.2 Numerical results
The aerodynamic analysis of MBS is shown in term of lift (CL), drag (CD) and pitching
moment (CMy) coefficients which are calculated according to Eq. (1) and Eq. (2), respectively.
F
i
C
i L,
i
D (1)
1
2
v S
2
ref
M
j
C
M j
j Y (2)
1
2
v L S
2
ref
ref
The reference parameters Lref (e.g., longitudinal reference length) and Sref (e.g., reference surface) are the vehicle length (e.g., 8 m) and planform area (e.g., 32 m2). The pitching
moment is computed from the vehicle nose (i.e. 0, 0, 0). Engineering based aerodynamic
analysis has been extensively performed by using a 3D Panel Methods code developed by
CIRA, namely HPM (Viviani and Pezzella, 2009). This tool, at high supersonic and
hypersonic speeds, is able to accomplish the aerodynamic and aerothermodynamic analyses
of a complex re-entry vehicle configuration by using simplified approaches as local surface
inclination methods and approximate boundary-layer methods, respectively. The SIM
typical of hypersonics are based on Newtonian, Modified Newtonian, and Prandtl-Mayer
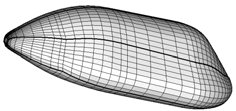
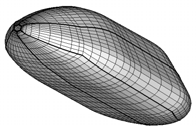
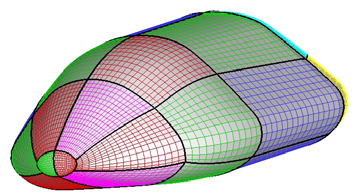
theories (Anderson, 1989). Typical surface meshes of the MBS, used for the engineering level computations, are shown in Fig. 2.
Fig. 2. Example of panel mesh for engineering-based aerodynamic analysis.
MBS aerodynamic results, provided by engineering-based analysis, cover ranging from 0
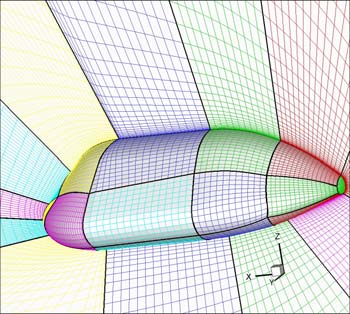
to 50 deg. Present CFD computations for the MBS have been carried out on a 3-D multiblock
structured grid close to that shown in Fig. 3. The grid consists of about 20 blocks and 900.000
cells (half body). Both computational domains are tailored for the free-stream conditions of Table 1. The distribution of surface grid points has been dictated by the level of resolution desired in various areas of the vehicle such as the stagnation region and the base fillet one, according to the computational scopes. Fig. 3 shows also a close-up view of the 3-D mesh on
Fluid Dynamics Analysis of a Space Vehicle Entering the Mars Atmosphere
67
the vehicle surface and pitch plane. Grid refinement in strong gradient regions of flowfield has been made through a solution adaptive approach.
Fig. 3. Example of computational mesh domains for Euler CFD simulations
The preliminary results of CFD simulations performed so far are summarized hereinafter.
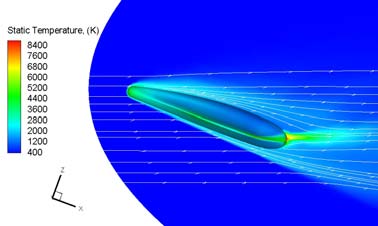
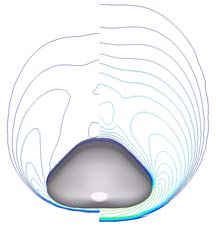
For example, Fig. 6 shows the static temperature contours on the vehicle symmetry plane
and static pressure contours on vehicle surface at M=20 and =20 deg, considering the
Mars atmosphere as a reacting gas mixture. As shown, the MBS bow shock structure around
the descent vehicle can be appreciated as well.
Fig. 4. Results for M=20 and =20 deg. (Left) static temperature field on vehicle symmetry
plane; (right) static pressure contour on vehicle surface for non-equilibrium reacting gas
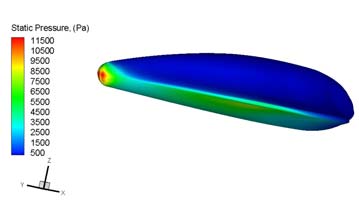
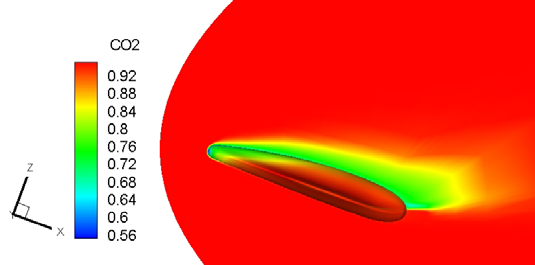
At the same flight conditions, Fig. 5 reports on chemical dissociation of the flow in the shock layer considering the contours of CO2 mass fraction on MBS pitch plane. As a consequence,
flow dissociation determines a large density ratio across the strong bow shock compared
with a flow of the same gas where no dissociation takes place (Viviani and Pezzella, 2009)
(Anderson, 1989). This results in a thinner shock layer around the entry vehicle (e.g., lower stand-off distance).
68
Applied Computational Fluid Dynamics
Under conditions where dissociation exists, the aerodynamics of vehicle depends
primarily on shock density ratio. In fact, the change of aerodynamic characteristics is the
result of change in surface pressure acting on the vehicle forebody (Gnoffo et al., 1998)
(Viviani et al., 2010).
Fig. 5. Results for M=20 and =20 deg. Contours of CO2 mass fraction
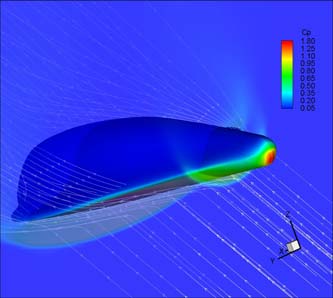
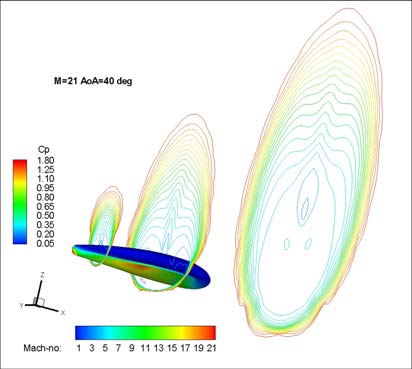
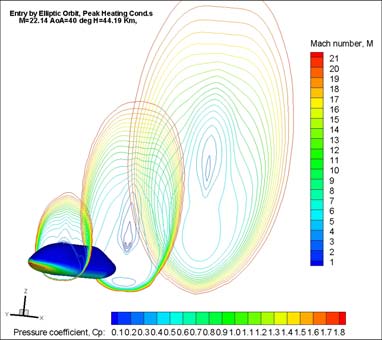
Moreover, Fig. 6 shows CFD results for M=21 and =40 deg. The left side reports pressure
coefficient contours (Cp) on vehicle surface and on two cross sections; whereas on the right Cp contours on vehicle surface and Mach number contours on three cross sections have been
shown.
Fig. 6. Results for M=21 and =40 deg. (Left) pressure coefficient contours (Cp) on vehicle surface and on two cross sections; (right) Cp contours on vehicle surface and Mach number
contours on three cross sections
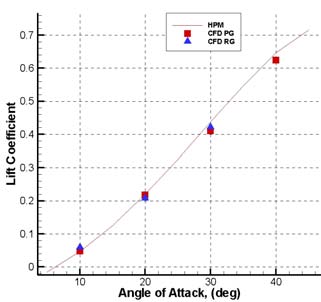
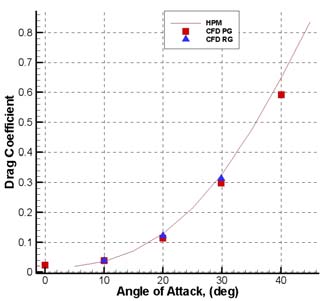
The curves of lift and drag coefficients are shown in Fig. 7. Those curves collect MBS
aerodynamic coefficients compared with available numerical data both for perfect gas and
reacting gas approximations, reported in order to highlight accuracy of both numerical and
engineering-based results (Viviani et al., 2010).


Fluid Dynamics Analysis of a Space Vehicle Entering the Mars Atmosphere
69
Fig. 7. CL and CD versus . Comparison between panel methods and CFD results for perfect
and reacting gas approximations.
As one can see, engineering and numerical data compare very well, thus confirming that
engineering-based estimations represent reliable preliminary aerodynamics of a Mars entry
vehicle. Moreover, real gas effects increase the aerodynamic drag coefficient whereas the lift is only slightly influenced.
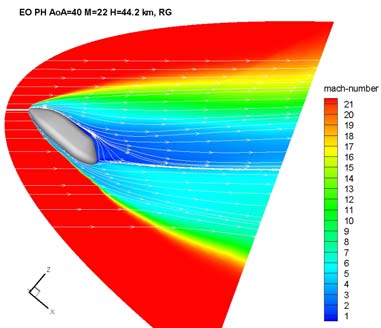
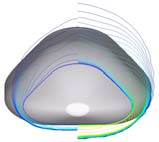
As far as CFD results for the second configuration are concerned, Fig. 8 shows the Mach
number contour field that takes place around the vehicle when it is flying at the peak
heating conditions of entry by EO (e.g., M=22, =40 deg, and H=44.20 km).
In particular, the left side of Fig. 8 shows the Mach contour field on the vehicle pitch plane while at the right side of Fig. 8 gives an idea of the bow shock shape that envelopes the
vehicle since the Mach field is reported on three different flowfield cross sections.
As shown, a thin shock layer envelopes the entry vehicle windside with a strong expansion
that characterizes the flow at the end of the vehicle.
Fig. 8. Mach contours on the vehicle pitch plane and three flowfield cross sections at the
EOPH conditions.
70
Applied Computational Fluid Dynamics
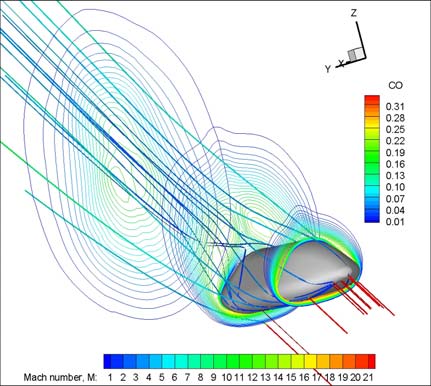
The CO mass fraction field around the vehicle for the same freestream conditions is shown
in Fig. 9 where some streamtraces colored by Mach number are also reported.
Fig. 9. CO mass fraction at the EOPH conditions on three cross sections with streamtraces
colored by Mach number
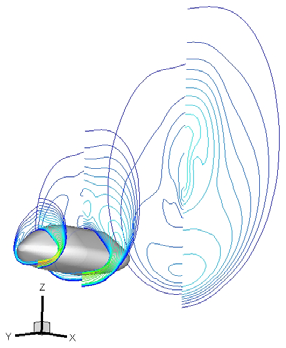
As shown the CO concentration reaches its maximum value close to the body. Fig. 10 shows
the temperature comparison among non-equilibrium flow (right side of pilot) and perfect
gas computation, evaluated at three flowfield cross sections (x=1.5 [m], 5.5 [m] and 9.5 [m]).
It is clearly evident how real gas phenomena affect the vehicle shock layer, thus confirming all the conclusions highlighted before.
2
1
Fig. 10. Temperature comparison between non-equilibrium flow (right side of pilot) and
perfect gas computation at x=1.5 [m], 5.5 [m] and 9.5 [m] flowfield cross sections
Fluid Dynamics Analysis of a Space Vehicle Entering the Mars Atmosphere
71
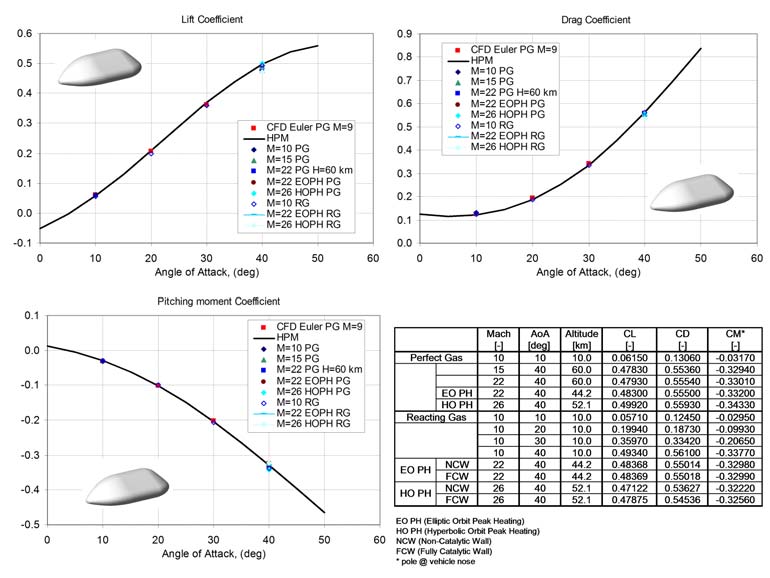
Finally, the curves of lift, drag, and pitching moment coefficients are shown in Fig. 11.
Real gas effects increase both drag and pitching moment coefficients, whereas the lift is only slightly influenced. Vehicle aerodynamics is also summarized in the table of Fig. 11.
Fig. 11. Lift, Drag and pitching moment coefficients versus . Comparison between panel
methods and CFD results for perfect and non-equilibrium gas computations.
3. Conclusion
The paper deals with the flowfield analysis of two braking systems for manned exploration
mission to Mars.
A number of fully 3D Navier-Stokes and Euler CFD computations of the hypersonic
flowfield past two lifting body vehicles have been performed for several freestream
conditions of a proposed Mars entry loading environment. These evaluations have been
aimed at carrying out only a preliminary design of the MBS configuration, in compliance
with the Phase-A design level.
The range between Mach 2 and Mach 26 has been analyzed, to provide both aerodynamic
databases according to both the space-based and trajectory-based design approaches.
Numerical results show that real gas effects increase both the aerodynamic drag and
pitching moment coefficient, whereas the lift is only slightly influenced.
72
Applied Computational Fluid Dynamics
4. References
Anderson, J. D., Hypersonic and High Temperature Gas Dynamics, McGraw-Hill Book
Company, New York, 1989.
Gnoffo, P., Weilmuenster, K., Braun, R., Cruz, C., Influence of Sonic-Line Location on Mars Pathfinder Probe Aerothermodynamics, Journal of Spacecraft and Rockets, vol. 33 No 2, March-April 1996.
Gnoffo, P., Braun, R., Weilmuenster, K., Mitcheltree, R., Engelung, W., Powell, R., Prediction and Validation of Mars Pathfinder Hypersonic Aerodynamic Data Base, 7th AIAA/ASME
Joint Thermophysics and Heat Transfer Conference. June 15-18, Albuquerque, NM
(USA). 1998.
Gupta, R., Lee, K., Scott, C., Aerothermal Study of Mars Pathfinder Aeroshell, Journal of Spacecraft and Rockets, vol.33 No 1, Jan.-Feb. 1996.
Hanley, G. M., Lyon, F. J., The Feasibility of Spacecraft Deceleration by Aerodynamic Braking at the Planet Mars, Proc. of the 1th AIAA Annual Meeting. Washington, D.C. June 29-July 2, 1964. AIAA-64-479.
Hannemann, V., Mack, A., Chemical Non Equilibrium Model of the Martian Atmosphere, Proc. of the 6th European Symposium on Aerothermodynamics for Space Vehicles.
Versailles, France. 3-6 Nov. 2008 – ESA SP-659, January 2009.
Kustova, E.V., Nagnibeda, E.A., Shevelev, Y. D., Syzranova, N.G., Comparison of Non-
Equilibrium Supersonic CO2 Flows with Real Gas Effects near a Blunt Body, Proc. of the 6th European Symposium on Aerothermodynamics for Space Vehicles. Versailles,
France. 3-6 Nov. 2008 – ESA SP-659, January 2009.
Mack, A., CFD Validation for CO2 Reentry Applications, 2nd Inter. ARA Days. Arcachon, France, 21-23 October 2008. AA-3-2008-37.
Mitcheltree, R. A., Gnoffo, P. A., Wake Flow about the Mars Pathfinder Entry Vehicle, Journal of Spacecraft and Rockets, Vol. 32 No 5, Sept.- Oct. 1995.
Polishchuk, G., Pichkhadze, K., Vorontsov, K., Pavela, V., Proposal on application of Russian technical facilities for International Mars Research Program for 2009–2015, Acta
Astronautica, Vol. 59, pp.113-118. 2006.
Park, C., Howe, J. T., Jaffe, R. L., Candler, G. V., Review of Chemical-kinetic Problems of Future NASA Missions, II: Mars Entries, Journal of Thermophysics and Heat Transfer, vol.
8, No 1, pp. 9-23, Jan-Mar 1994.
Viviani, A., Pezzella, G.,