Structure and Interpretation of Signals and Systems by Edward Ashford Lee and Pravin Varaiya - HTML preview
Download the book in PDF, ePub for a complete version.
Probing Further: Household electrical power
In the U.S., household current is delivered on three wires, a neutral wire and two hot
wires. The voltage between either hot wire and the neutral wire is around 110 to 120
volts, RMS (root mean square, the square root of the average of the voltage squared).
The voltage between the two hot wires is around 220 to 240 volts, RMS. The higher
voltage is used for appliances that need more power, such as air conditioners. The
voltage between the hot wires and the neutral wire is sinusoidal with a frequency of
60 Hz. Thus, for one of the hot wires, it is a function x : R → R where the domain
represents time and the range represents voltage, and
∀ t ∈ R, x(t) = 170cos(60 × 2πt).
This 60 Hertz sinusoidal waveform completes one cycle in a period of T = 1/60 sec-
onds. Why is the amplitude 170 volts, rather than 120? Because the 120 voltage is RMS
(root mean square). That is,
1 Z T
voltage
=
RMS
x2(t)dt volts = 120,
T 0
the square root of the average of the square of the voltage.
The voltage between the second hot wire and the neutral wire is a function y : R → R
where
∀ t ∈ R, y(t) = −170cos(60 × 2πt) = −x(t).
It is the negative of the other voltage at any time t. This sinusoidal signal is said to have
a phase shift of 180 degrees, or π radians, compared to the first sinusoid. Equivalently,
it is said to be 180 degrees out of phase. We can now see how to get the higher voltage
for power-hungry appliances. We simply use the two hot wires rather than one hot wire
and the neutral wire. The voltage between the two hot wires is the difference, a function
z : R → R where
∀ t ∈ R, z(t) = x(t) − y(t) = 340cos(60 × 2πt).
This corresponds to 240 volts RMS, as shown in figure 1.5.
Note that the neutral wire should not be confused with the ground wire in a three-
prong plug. The ground wire is a safety feature to allow current to flow into the earth
rather than through a person.
Lee & Varaiya, Signals and Systems
11
1.1. SIGNALS
1.1.2
Images
If an image is a grayscale picture on a 11 × 8.5 inch sheet of paper, the picture is repre-
sented by a function
Image : [0, 11] × [0, 8.5] → [0, MaxIntensity],
(1.1)
where MaxIntensity is the maximum grayscale value (0 is black and MaxIntensity is
white). The set [0, 11] × [0, 8.5] defines the space of the sheet of paper. More generally, a
400
300
phase 1 − phase 2
200
phase 2 − neutral
100
neutral
0
−100
phase 1 − neutral
−200
−300
−4000
0.002
0.004
0.006
0.008
0.01
0.012
0.014
0.016
0.018
Figure 1.5: The voltages between the two hot wires and the neutral wire and
between the two hot wires in household electrical power in the U.S.
12
Lee & Varaiya, Signals and Systems

1. SIGNALS AND SYSTEMS
grayscale image is a function
Image : VerticalSpace × HorizontalSpace → Intensity,
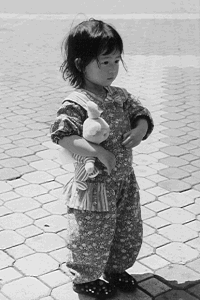
where Intensity = [0, MaxIntensity] is the intensity range from black to white. An example
is shown in Figure 1.6.
For a color picture, the reflected light is sometimes measured in terms of its RGB values
(i.e. the magnitudes of the red, green, and blue colors), and so a color picture is repre-
sented by a function
ColorImage : VerticalSpace × HorizontalSpace → Intensity3.
The RGB values assigned by ColorImage at any point (x, y) in its domain is the triple
(r, g, b) ∈ Intensity3 given by
(r, g, b) = ColorImage(x, y).
Different images will be represented by functions with different spatial domains (the size
of the image might be different), different ranges (we may consider a more or less detailed
Figure 1.6: Grayscale image on the left, and its enlarged pixels on the right.
Lee & Varaiya, Signals and Systems
13
1.1. SIGNALS
way of representing light intensity and color than grayscale or RGB values), and different
assignments of color values to points in the domain.
Since a computer has finite memory and finite wordlength, an image is stored by dis-
cretizing both the domain and the range, similarly to the ComputerVoice function. So, for
example, your computer may represent an image by storing a function of the form
ComputerImage :
DiscreteVerticalSpace × DiscreteHorizontalSpace → Integers8
where
DiscreteVerticalSpace
=
{1,2,··· ,300},
DiscreteHorizontalSpace
=
{1,2,··· ,200},and
Integers8
=
{0,1,··· ,255}.
It is customary to say that ComputerImage stores 300 × 200 pixels, where a pixel is an
individual picture element. The value of a pixel is
ComputerImage(row, column) ∈ Integers8,
where row ∈ DiscreteVerticalSpace, column ∈ DiscreteHorizontalSpace. In this example
the range Integers8 has 256 elements, so in the computer these elements can be repre-
sented by an 8-bit integer (hence the name of the range, Integers8). An example of such
an image is shown in Figure 1.6, where the right-hand version of the image is magnified
to show the discretization implied by the individual pixels.
A computer can store a color image in one of two ways. One way is to represent it as a
function
ColorComputerImage :
DiscreteVerticalSpace × DiscreteHorizontalSpace → Integers83
(1.2)
so each pixel value is an element of {0, 1, · · · , 255}3. Such a pixel can be represented as
three 8-bit integers. A common method that saves memory is to use a colormap. Define
the set ColorMapIndexes = {0, · · · , 255}, together with a Display function,
Display : ColorMapIndexes → Intensity3.
(1.3)
Display assigns to each element of ColorMapIndexes the three (r, g, b) color intensities.
This is depicted in the block diagram in Figure 1.7. Use of a colormap reduces the re-
quired memory to store an image by a factor of three because each pixel is now repre-
sented by a single 8-bit number. But only 256 colors can be represented in any given
image. The function Display is typically represented in the computer as a lookup table.
14
Lee & Varaiya, Signals and Systems
1. SIGNALS AND SYSTEMS
Probing Further: Color and light
The human eye is sensitive to electromagnetic waves of certain frequency. The fre-
quency f in Hertz of a purely sinusoidal electromagnetic wave is related to its wave-
length λ in meters by the formula, f = c/λ, where c is the speed of light (about
3 × 10⁸ meters/second). The wavelengths of visible light range from about 350-400
nm (nanometers or 10−9 meters) to 750-800 nm. We experience light of different wave-
lengths as having different colors: violet (350 nm), indigo, blue, green, yellow, orange,
red (800 nm).
The retina has three different groups of cones, each sensitive to one of the three pri-
mary colors–red, green, and blue. Other colors are perceived when these three groups
are stimulated in different combinations, as shown below:
Red
Y
ta
ellow Magen
W Cyhite
Green a
Blue
n
By combining its red, green, and blue light sources in different amounts, a computer
monitor can create the perception of all colors. The color white is obtained by adding
all three primary colors, and the absence of any light is perceived as black. This “ad-
ditive” model of color perception was proposed in 1802 by Thomas Young and H.L.F.
Helmholz.
In a computer, if the amount of each primary color is typically represented by an 8-bit
word, and each color is represented by three 8-bit words, giving a total of 28 × 28 × 28 =
224 = 16, 777, 216 different colors. An 8-bit colormap by contrast can only generate 256
different colors.
Painting works by subtraction: different pigments of color absorb (subtract) light of
different wavelengths. The primary subtractive colors are magenta, yellow, and cyan.
The ear and eye are quite different perceptual systems. If we listen to a sound con-
sisting of the sum of two pure tones, we can distinguish the two tones. However, we
cannot perceive the difference between, say, a yellow light source and an appropriate
combination of red and green sources. The ear can be modeled as a linear time-invariant
system, see Chapter 5. The eye cannot.
Lee & Varaiya, Signals and Systems
15
1.1. SIGNALS
red
Display : ColorMapIndexes ! Intensity 3
image display device
green
(specified as a colormap table)
(e.g. monitor)
colormap index
blue
Figure 1.7: In a computer representation of a color image that uses a colormap,
pixel values are elements of the set ColorMapIndexes. The function Display con-
verts these indexes to an RGB representation.
1.1.3
Video signals
A video is a sequence of still images displayed at a certain rate (frequency) ranging from
25 frames per second to much higher (for specialty video). To the human visual system,
a sequence of still images displayed at a high enough rate looks like continuous motion.
At 30 frames per second, the domain of a video signal is discrete time, FrameTimes =
{0,1/30,2/30,···}, and its range is a set of images, ImageSet. A video signal, therefore,
is a function
Video : FrameTimes → ImageSet.
(1.4)
For any time t ∈ FrameTimes, the image Video(t) ∈ ImageSet is displayed. The signal
Video is illustrated in Figure 1.8.
An alternative way of specifying a video signal is by the function Video whose domain is
a product set as follows:
Video : FrameTimes × DiscreteVerticalSpace × HorizontalSpace → Intensity3.
Similarly to Figure 1.8, we can depict Video as in Figure 1.9. The RGB value assigned to a point (x, y) at time t is
(r, g, b) = Video (t, x, y).
(1.5)
If the signals specified in (1.4) and (1.5) represent the same video, then for all t ∈ FrameTimes and (x, y) ∈ DiscreteVerticalSpace × HorizontalSpace,
(Video(t))(x, y) = Video (t, x, y).
(1.6)
16
Lee & Varaiya, Signals and Systems
1. SIGNALS AND SYSTEMS
It is worth pausing to understand the notation used in (1.6). Video is a function of t,
so Video(t) is an element in its range ImageSet. Since elements in ImageSet them-
selves are functions, Video(t) is a function. The domain of Video(t) is the product set
DiscreteVerticalSpace × HorizontalSpace, so (Video(t))(x, y) is the value of this func-
tion at the point (x, y) in its domain. This value is an element of Intensity3. On the
right-hand side of (1.6), Video is a function of (t, x, y) and so Video (t, x, y) is an ele-
ment in its range, Intensity3. The equality (1.6) asserts that for all values of t, x, y the
two sides are the same. On the left-hand side of (1.6) the parentheses enclosing Video(t)
are not necessary; we could equally well write Video(t)(x, y). However, the parentheses
improve readability.
1.1.4
Signals representing physical attributes
The change over time in the attributes of a physical object or device can be represented as
functions of time or space.
Example 1.11: The position of an airplane can be expressed as
Position : Time → 3
R ,
0
1/30 2/30 3/30 ...
n/30 ...
FrameTimes
ImageSet
Figure 1.8: Illustration of the function Video.
Lee & Varaiya, Signals and Systems
17
1.1. SIGNALS
( x,y)
0
1/30 2/30
...
n/30 ...
B
( r,g,b)
red, green, blue values
G
R
Figure 1.9: Illustration of the function Video .
where for all t ∈ Time,
Position(t) = (x(t), y(t), z(t))
is its position in 3-dimensional space at time t. The position and velocity of the
airplane is a function
s : Time → 6
R ,
(1.7)
where
s(t) = (x(t), y(t), z(t), vx(t), vy(t), vz(t))
(1.8)
gives its position and velocity at t ∈ Time.
The position of the pendulum shown in the left panel of figure 1.10 is represented
by the function
θ : Time → [−π, π],
where θ(t) is the angle with the vertical made by the pendulum at time t.
18
Lee & Varaiya, Signals and Systems
1. SIGNALS AND SYSTEMS
The position of the upper and lower arms of a robot depicted in the right panel of
Figure 1.10 can be represented by the function
(θu, θl) : Time → [−π, π]2,
where θu(t) is the angle at the elbow made by the upper arm with the vertical, and
θl (t) is the angle made by the lower arm with the upper arm at time t. Note that
we can regard (θu, θl) as a single function with range as the product set [−π, π]2
or as two functions θu and θl each with range [−π, π]. Similarly, we can regard s
in (1.7) as a single function with range
6
R or as a collection of six functions, each
with range R, as suggested by (1.8).
Example 1.12: The spatial variation of temperature over some volume of space
can be represented by a function
AirTemp : X ×Y × Z → R
where X ×Y × Z ⊂ 3
R is the volume of interest, and AirTemp(x, y, z) is the temper-
ature at the point (x, y, z).
Shoulder
θu
Arm
θl
θ
Pendulum
Robot Arm
Figure 1.10: Position of a pendulum and upper and lower arms of a robot.
Lee & Varaiya, Signals and Systems
19
1.1. SIGNALS
1.1.5
Sequences
Above we studied examples in which temporal or spatial information is represented by
functions of a variable representing time or space. The domain of time or space may be
continuous as in Voice and Image or discrete as in ComputerVoice and ComputerImage.
In many situations, information is represented as sequences of symbols rather than as
functions of time or space. These sequences occur in two ways: as a representation of
data or as a representation of an event stream. Sequences, in fact, are special sorts of
functions.
Examples of data represented by sequences are common. A file stored in a computer in
binary form is a sequence of bits, or binary symbols, i.e. a sequence of 0’s and 1’s. A text
is a sequence of words. A sheet of music represents a sequence of notes.
Example 1.13: Consider an N-bit long binary file,
b1, b2, · · · , bN,
where each bi ∈ Binary = {0, 1}. We can regard this file as a function
File : {1, 2, · · · , N} → Binary,
with the assignment File(n) = bn for every n ∈ {1, · · · , N}.
Sometimes we can give a mathematical expression for a binary signal. For instance,
the N-bit long binary file Alt consisting of an alternating sequence of 0’s and 1’s is
given by for all n,
0, n even
Alt(n) =
1, n odd
If instead of Binary we take the range to be EnglishWords, then an N-word long
English text is a function
EnglishText : {1, 2, · · · , N} → EnglishWords.
20
Lee & Varaiya, Signals and Systems
1. SIGNALS AND SYSTEMS
In general, data sequences are functions of the form
Data : Indices → Symbols,
(1.9)
where Indices ⊂ N, where N is the set of natural numbers, is an appropriate index set
such as {1, 2, · · · , N}, and Symbols is an appropriate set of symbols such as Binary or
EnglishWords.
One advantage of the representation (1.9) is that we can then interpret Data as a discrete-
time signal, and so some of the techniques that we will develop in later chapters for those
signals will automatically apply to data sequences. However, the domain Indices in (1.9)
does not necessarily represent uniformly spaced instances of time. All we can say is
that if m and n are in Indices with m < n, then the m-th symbol Data(m) occurs in the
data sequence before the n-th symbol Data(n), but we cannot say how much time elapses
between the occurrence of those two symbols.
The second way in which sequences arise is as representations of event streams. An event
stream or event trace is a record or log of the significant events that occur in a system of
interest. Here are some everyday examples.
Example 1.14: When you send a file to a printer, the normal trace of events is
CommandPrintFile, FilePrinting, PrintingComplete
but if the printer has run out of paper, the trace might be
CommandPrintFile, FilePrinting, MessageOutofPaper, InsertPaper, · · ·
When you enter your car the starting trace of events might be
StartEngine, SeatbeltSignOn, BuckleSeatbelt, SeatbeltSignOff, · · ·
Thus event streams are functions of the form
EventStream : Indices → EventSet.
We will see in Chapter 3 that the behavior of finite state machines is best described in
terms of event traces, and that systems that operate on event streams are often best de-
scribed as finite state machines.
Lee & Varaiya, Signals and Systems
21
1.1. SIGNALS
1.1.6
Discrete signals and sampling
Voice and PureTone are said to be continuous-time signals because their domain Time is
a continuous interval of the form [α, β] ⊂ R. The domain of Image, similarly, is a contin-
uous 2-dimensional rectangle of the form [a, b] × [c, d] ⊂ 2
R . The signals ComputerVoice
and ComputerImage have domains of time and space that are discrete sets. Video is also
a discrete-time signal, but in principle it could be a function of a space continuum. We
can define a function ComputerVideo where all three sets that are composed to form the
domain are discrete.
Discrete signals often arise from signals with continuous domains by sampling. We
briefly motivate sampling here, with a detailed discussion to be taken up later. Continuous
domains have an infinite number of elements. Even the domain [0, 1] ⊂ Time representing
a finite time interval has an infinite number of elements. The signal assigns a value in its
range to each of these infinitely many elements. Such a signal cannot be stored in a finite
digital memory device such as that in a computer. If we wish to store, say, Voice, we must
approximate it by a signal with a finite domain.
A common way to approximate a function with a continuous domain like Voice and Image
by a function with a finite domain is by uniformly sampling its continuous domain.
Example 1.15: If we sample a 10-second long domain of Voice,
Voice : [0, 10] → Pressure,
10,000 times a second (i.e. at a frequency of 10 kHz) we get the signal
SampledVoice : {0, 0.0001, 0.0002, · · · , 9.9998, 9.9999, 10} → Pressure, (1.10)
with the assignment
SampledVoice(t) = Voice(t),
for all t ∈ {0, 0.0001, 0.0002, · · · , 9.9999, 10}.
(1.11)
Notice from (1.10) that uniform sampling means picking a uniformly spaced subset
of points of the continuous domain [0, 10].
22
Lee & Varaiya, Signals and Systems
1. SIGNALS AND SYSTEMS
In the example, the sampling interval or sampling period is 0.0001 sec, corresponding
to a sampling frequency or sampling rate of 10,000 Hz. Since the continuous domain is
10 seconds long, the domain of SampledVoice has 100,000 points. A sampling frequency
of 5,000 Hz would give the domain {0, 0.0002, · · · , 9.9998, 10}, which has half as many
points. The sampled domain is finite, and its elements are discrete values of time.
Figure 1.11 shows an exponential function Exp : [−1, 1] → R defined by
Exp(x) = ex.
SampledExp is obtained by sampling with a sampling interval of 0.2. So its domain is
{−1,−0.8,··· ,0.8,1.0}.
The continuous domain of Image given by (1.1), which describes a grayscale image on an
8.5 by 11 inch sheet of paper, is the rectangle [0, 11] × [0, 8.5], representing the space of
3
3
2.5
2.5
2
2
1.5
1.5
1
1
0.5
0.5
0
0
−1
−0.5
0
0.5
1
−1
−0.5
0
0.5
1
Figure 1.11: The exponential functions Exp and SampledExp, obtained by sam-
pling with a sampling interval of 0.2.
Lee & Varaiya, Signals and Systems
23
1.1. SIGNALS
the page. In this case, too, a common way to approximate Image by a signal with finite
domain is to sample the rectangle. Uniform sampling with a spatial resolution of say, 100
dots per inch, in each dimension, gives the finite domain D = {0, 0.01, · · · , 8.49, 8.5} ×
{0,0.01,··· ,10.99,11.0}. So the sampled grayscale picture is
SampledImage : D → [0, MaxIntensity]
with
SampledImage(x, y) = Image(x, y), for all (x, y) ∈ D.
As mentioned before, each sample of the image is called a pixel, and the size of the image
is often given in pixels. The size of your computer screen display, for example, may be
600 × 800 or 768 × 1024 pixels.
Sampling and approximation
Let f be a continuous-time function, and let Sampledf be the discrete-tim