FHSST: Grade 10 Math by Ewald Zietsman - HTML preview
Download the book in PDF, ePub, Kindle for a complete version.
Chapter 2. Functions and graphs
Introduction to Functions and Graphs
Functions are mathematical building blocks for designing machines, predicting natural disasters, curing diseases, understanding world economies and for keeping aeroplanes in the air. Functions can take input from many variables, but always give the same answer, unique to that function. It is the fact that you always get the same answer from a set of inputs that makes functions special.
A major advantage of functions is that they allow us to visualise equations in terms of a graph. A graph is an accurate drawing of a function and is much easier to read than lists of numbers. In this chapter we will learn how to understand and create real valued functions, how to read graphs and how to draw them.
In addition to their use in the problems facing humanity, functions also appear on a day-to-day level, so they are worth learning about. A function is always dependent on one or more variables, like time, distance or a more abstract quantity.
Functions and Graphs in the Real-World
Some typical examples of functions you may already have met include:-
how much money you have, as a function of time. You never have more than one amount of money at any time because you can always add everything to give one number. By understanding how your money changes over time, you can plan to spend your money sensibly. Businesses find it very useful to plot the graph of their money over time so that they can see when they are spending too much. Such observations are not always obvious from looking at the numbers alone.
the temperature is a very complicated function because it has so many inputs, including; the time of day, the season, the amount of clouds in the sky, the strength of the wind, where you are and many more. But the important thing is that there is only one temperature when you measure it in a specific place. By understanding how the temperature is effected by these things, you can plan for the day.
where you are is a function of time, because you cannot be in two places at once! If you were to plot the graphs of where two people are as a function of time, if the lines cross it means that the two people meet each other at that time. This idea is used in logistics, an area of mathematics that tries to plan where people and items are for businesses.
your weight is a function of how much you eat and how much exercise you do, but everybody has a different function so that is why people are all different sizes.
Recap
The following should be familiar.
Variables and Constants
In Review of past work, we were introduced to variables and constants. To recap, a variable can take any value in some set of numbers, so long as the equation is consistent. Most often, a variable will be written as a letter.
A constant has a fixed value. The number 1 is a constant. Sometimes letters are used to represent constants, as they are easier to work with.
Investigation : Variables and Constants
In the following expressions, identify the variables and the constants:
2 x2 = 1
3 x + 4 y = 7

y = 7x – 2
Relations and Functions
In earlier grades, you saw that variables can be related to each other. For example, Alan is two years older than Nathan. Therefore the relationship between the ages of Alan and Nathan can be written as A=N+2, where A is Alan's age and N is Nathan's age.
In general, a relation is an equation which relates two variables. For example, y=5x and y2+x2=5 are relations. In both examples x and y are variables and 5 is a constant, but for a given value of x the value of y will be very different in each relation.
Besides writing relations as equations, they can also be represented as words, tables and graphs. Instead of writing y=5x, we could also say “y is always five times as big as x”. We could also give the following table:
| x | y = 5 x |
| 2 | 10 |
| 6 | 30 |
| 8 | 40 |
| 13 | 65 |
| 15 | 75 |
Investigation : Relations and Functions
Complete the following table for the given functions:
| x | y = x | y = 2 x | y = x + 2 |
| 1 | |||
| 2 | |||
| 3 | |||
| 50 | |||
| 100 |
The Cartesian Plane
When working with real valued functions, our major tool is drawing graphs. In the first place, if we have two real variables, x and y, then we can assign values to them simultaneously. That is, we can say “let x be 5 and y be 3”. Just as we write “let x=5” for “let x be 5”, we have the shorthand notation “let (x,y)=(5,3)” for “let x be 5 and y be 3”. We usually think of the real numbers as an infinitely long line, and picking a number as putting a dot on that line. If we want to pick two numbers at the same time, we can do something similar, but now we must use two dimensions. What we do is use two lines, one for x and one for y, and rotate the one for y, as in Figure 2.1. We call this the Cartesian plane.
Drawing Graphs
In order to draw the graph of a function, we need to calculate a few points. Then we plot the points on the Cartesian Plane and join the points with a smooth line.
Assume that we were investigating the properties of the function f(x)=2x. We could then consider all the points (x;y) such that y=f(x), i.e. y=2x. For example, (1;2),(2,5;5), and (3;6) would all be such points, whereas (3;5) would not since 5≠2×3. If we put a dot at each of those points, and then at every similar one for all possible values of x, we would obtain the graph shown in Figure 2.2
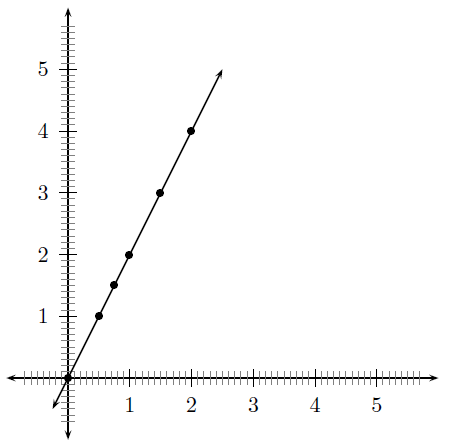
The form of this graph is very pleasing – it is a simple straight line through the middle of the plane. The technique of “plotting”, which we have followed here, is the key element in understanding functions.
Investigation : Drawing Graphs and the Cartesian Plane
Plot the following points and draw a smooth line through them. (-6; -8),(-2; 0), (2; 8), (6; 16)
Notation used for Functions
Thus far you would have seen that we can use y=2x to represent a function. This notation however gets confusing when you are working with more than one function. A more general form of writing a function is to write the function as f(x), where f is the function name and x is the independent variable. For example, f(x)=2x and g(t)=2t+1 are two functions.
Both notations will be used in this book.
If f(n)=n2–6n+9, find f(k–1) in terms of k.
Replace n with k–1 :
(2.1)
- Remove brackets on RHS and simplify :(2.2)

We have now simplified the function in terms of k.
If f(x)=x2–4, calculate b if f(b)=45.
Replace x with b :
(2.3)
f(b) = f(b) :
(2.4)
Recap
Guess the function in the form y=... that has the values listed in the table.
Table 2.3. x 1 2 3 40 50 600 700 800 900 1000 y 1 2 3 40 50 600 700 800 900 1000 Guess the function in the form y=... that has the values listed in the table.
Table 2.4. x 1 2 3 40 50 600 700 800 900 1000 y 2 4 6 80 100 Find Your Next Great Read
Describe what you're looking for in as much detail as you'd like.
Our AI reads your request and finds the best matching books for you.Showing results for ""Popular searches:
Create a Free Account to Download
Join 9.7 million readers — your free account takes a minute, and your first book is ready right away