Forex - A Quick Guide to Trading Forex by Easy-Forex - HTML preview
Download the book in PDF, ePub, Kindle for a complete version.
[6] Technical Analysis:
Patterns and forecast methods used today
Basic Forex forecast methods:
Technical analysis and fundamental analysis
This chapter and the next one provide insight into the two major methods of analysis used to forecast the behavior of the Forex market. Technical analysis and fundamental analysis differ greatly, but both can be useful forecasting tools for the Forex trader. They have the same goal - to predict a price or movement. The technician studies the effects, while the fundamentalist studies the causes of market movements. Many successful traders combine a mixture of both approaches for superior results.
If both Fundamental analysis and Technical analysis point to the same direction, your chances for profitable trading are better.

In this chapter…
The categories and approaches in Forex Technical Analysis all aim to support the investor in determining his/her views and forecasts regarding the exchange rates of currency pairs. This chapter describes the approaches, methods and tools used to this end. However, this chapter does not intend to provide a comprehensive and/or professional level of knowledge and skill, but rather let the reader become familiar with the terms and tools used by technical analysts.
As there are many ways to categorize the tools available, the description of tools in this chapter may sometimes seem repetitive. The sections in this chapter are:
[6.1] Technical Analysis: background, advantages, disadvantages;
[6.2] Various techniques and terms;
[6.3] Charts and diagrams;
[6.4] Technical Analysis categories / approaches:
a. Price indicators;
b. Number theory;
c. Waves;
d. Gaps;
e. Trends;
[6.6] Another way to categorize Technical Indicators.
[6.1] Technical analysis
Technical analysis is a method of predicting price movements and future market trends by studying what has occurred in the past using charts. Technical analysis is concerned with what has actually happened in the market, rather than what should happen, and takes into account the price of instruments and the volume of trading, and creates charts from that data as a primary tool. One major advantage of technical analysis is that experienced analysts can follow many markets and market instruments simultaneously.
Technical analysis is built on three essential principles:1. Market action discounts everything! This means that the actual price is a reflection of everything that is known to the market that could affect it. Some of these factors are: fundamentals (inflation, interest rates, etc.), supply and demand, political factors and market sentiment. However, the pure technical analyst is only concerned with price movements, not with the reasons for any changes.
2. Prices move in trends. Technical analysis is used to identify patterns of market behavior that have long been recognized as significant. For many given patterns there is a high probability that they will produce the expected results. There are also recognized patterns that repeat themselves on a consistent basis.
3. History repeats itself. Forex chart patterns have been recognized and categorized for over 100 years, and the manner in which many patterns are repeated leads to the conclusion that human psychology changes little over time. Since patterns have worked well in the past, it is assumed that they will continue to work well into the future.
Disadvantages of Technical Analysis• Some critics claim that the Dow approach (“prices are not random”) is quite weak, since today’s prices do not necessarily project future prices;
• The critics claim that signals about the changing of a trend appear too late, often after the change had already taken place. Therefore, traders who rely on technical analysis react too late, hence losing about 1/3 of the fluctuations;
• Analysis made in short time intervals may be exposed to “noise”, and may result in a misreading of market directions;
• The use of most patterns has been widely publicized in the last several years. Many traders are quite familiar with these patterns and often act on them in concern. This creates a self-fulfilling prophecy, as waves of buying or selling are created in response to “bullish” or “bearish” patterns.
• Technical analysis can be used to project movements of any asset (which is priced under demand/supply forces) available for trade in the capital market;
• Technical analysis focuses on what is happening, as opposed to what has previously happened, and is therefore valid at any price level;• The technical approach concentrates on prices, which neutralizes external factors. Pure technical analysis is based on objective tools (charts, tables) while disregarding emotions and other factors;
• Signaling indicators sometimes point to the imminent end of a trend, before it shows in the actual market. Accordingly, the trader can maintain profit or minimize losses.
Be disciplined, don’t be greedy.Close your Forex the position as you originally planned.
[6.2] Various techniques and terms
Many different techniques and indicators can be used to follow and predict trends in markets. The objective is to predict the major components of the trend: its direction, its level and the timing. Some of the most widely known include:
• Bollinger Bands - a range of price volatility named after John Bollinger, who invented them in the 1980s. They evolved from the concept of trading bands, and can be used to measure the relative height or depth of price. A band is plotted two standard deviations away from a simple moving average. As standard deviation is a measure of volatility, Bollinger Bands adjust themselves to market conditions. When the markets become more volatile, the bands widen (move further away from the average), and during less volatile periods, the bands contract (move closer to the average).
Bollinger Bands are one of the most popular technical analysis techniques. The closer prices move to the upper band, the more overbought is the market, and the closer prices move to the lower band, the more oversold is the market.
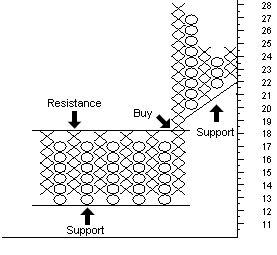
• Support / Resistance – The Support level is the lowest price an instrument trades at over a period of time. The longer the price stays at a particular level, the stronger the support at that level. On the chart this is price level under the market where buying interest is sufficiently strong to overcome selling pressure. Some traders believe that the stronger the support at a given level, the less likely it will break below that level in the future. The Resistance level is a price at which an instrument or market can trade, but which it cannot exceed, for a certain period of time. On the chart this is a price level over the market where selling pressure overcomes buying pressure, and a price advance is turned back.
• Support / Resistance Breakout - when a price passes through and stays beyond an area of support or resistance.CCI - Commodity Channel Index - an oscillator used to help determine when an investment instrument has been overbought and oversold. The Commodity Channel Index, first developed by Donald Lambert, quantifies the relationship between the asset's price, a moving average (MA) of the asset's price, and normal deviations (D) from that average. The CCI has seen substantial growth in popularity amongst technical investors; today's traders often use the indicator to determine cyclical trends in equities and currencies as well as commodities.
The CCI, when used in conjunction with other oscillators, can be a valuable tool to identify potential peaks and valleys in the asset's price, and thus provide investors with reasonable evidence to estimate changes in the direction of price movement of the asset.
• Hikkake Pattern – a method of identifying reversals and continuation patterns. Used for determining market turning-points and continuations (also known as trending behavior). It is a simple pattern that can be viewed in market price data, using traditional bar charts, or Japanese candlestick charts.
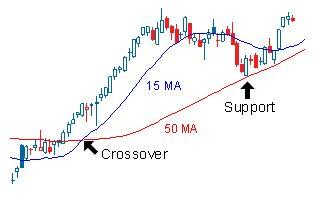
• Moving averages - are used to emphasize the direction of a trend and to smooth out price and volume fluctuations, or “noise”, that can confuse interpretation. There are seven different types of moving averages:
• simple (arithmetic)
• exponential
• time series
• weighed
• triangular
• variable
• volume adjusted
The only significant difference between the various types of moving averages is the weight assigned to the most recent data. For example, a simple (arithmetic) moving average is calculated by adding the closing price of the instrument for a number of time periods, then dividing this total by the number of time periods.
The most popular method of interpreting a moving average is to compare the relationship between a moving average of the instrument’s closing price, and the instrument’s closing price itself.
• Sell signal: when the instrument’s price falls below its moving average• Buy signal: when the instrument’s price rises above its moving average
The other technique is called the double crossover, which uses shortterm and long-term averages. Typically, upward momentum is confirmed when a short-term average (e.g., 15-day) crosses above a longer-term average (e.g., 50-day). Downward momentum is confirmed when a short-term average crosses below a long-term average.
• MACD - Moving Average Convergence/Divergence - a technical indicator, developed by Gerald Appel, used to detect swings in the price of financial instruments. The MACD is computed using two exponentially smoothed moving averages (see further down) of the security's historical price, and is usually shown over a period of time on a chart. By then comparing the MACD to its own moving average (usually called the "signal line"), traders believe they can detect when the security is likely to rise or fall. MACD is frequently used in conjunction with other technical indicators such as the RSI (Relative Strength Index, see further down) and the stochastic oscillator (see further down).
• Momentum – is an oscillator designed to measure the rate of price change, not the actual price level. This oscillator consists of the net difference between the current closing price and the oldest closing price from a predetermined period.
The formula for calculating the momentum (M) is:
M = CCP – OCP
OCP – old closing price
Momentum and rate of change (ROC) are simple indicators showing the difference between today's closing price and the close N days ago. "Momentum" is simply the difference, and the ROC is a ratio expressed in percentage. They refer in general to prices continuing to trend. The momentum and ROC indicators show that by remaining positive, while an uptrend is sustained, or negative, while a downtrend is sustained.
A crossing up through zero may be used as a signal to buy, or a crossing down through zero as a signal to sell. How high (or how low, when negative) the indicators get shows how strong the trend is.
• RSI - Relative Strength Index - a technical momentum indicator, devised by Welles Wilder, measures the relative changes between the higher and lower closing prices. RSI compares the magnitude of recent gains to recent losses in an attempt to determine overbought and oversold conditions of an asset.
The formula for calculating RSI is:
RSI = 100 – [100 / (1 + RS)]
N - predetermined number of days
The RSI ranges from 0 to 100. An asset is deemed to be overbought once the RSI approaches the 70 level, meaning that it may be getting overvalued and is a good candidate for a pullback. Likewise, if the RSI approaches 30, it is an indication that the asset may be getting oversold and therefore likely to become undervalued. A trader using RSI should be aware that large surges and drops in the price of an asset will affect the RSI by creating false buy or sell signals. The RSI is best used as a valuable complement to other stock-picking tools.
• Stochastic oscillator - A technical momentum indicator that compares an instrument's closing price to its price range over a given time period. The oscillator's sensitivity to market movements can be reduced by adjusting the time period, or by taking a moving average of the result. This indicator is calculated with the following formula:
%K = 100 * [(C – L14) / (H14 – L14)]
C= the most recent closing price;
L14= the low of the 14 previous trading sessions;
H14= the highest price traded during the same 14-day period.
The theory behind this indicator, based on George Lane’s observations, is that in an upward-trending market, prices tend to close near their high, and during a downward-trending market, prices tend to close near their low. Transaction signals occur when the %K crosses through a three-period moving average called the “%D”.
• Trend line - a sloping line of support or resistance.• Up trend line – straight line drawn upward to the right along successive reaction lows
• Down trend line – straight line drawn downwards to the right along successive rally peaks
Two points are needed to draw the trend line, and a third point to make it valid trend line. Trend lines are used in many ways by traders. One way is that when price returns to an existing principal trend line’ it may be an opportunity to open new positions in the direction of the trend in the belief that the trend line will hold and the trend will continue further. A second way is that when price action breaks through the principal trend line of an existing trend, it is evidence that the trend may be going to fail, and a trader may consider trading in the opposite direction to the existing trend, or exiting positions in the direction of the trend.
Don’t fall in love with your Forex position. Never take revenge of your Forex position.
[6.3] Charts and diagrams
Forex charts are based on market action involving price. Charts are major tools in Forex trading. There are many kinds of charts, each of which helps to visually analyze market conditions, assess and create forecasts, and identify behavior patterns.
Most charts present the behavior of currency exchange rates over time. Rates (prices) are measured on the vertical axis and time is shown of the horizontal axis.
Charts are used by both technical and fundamental analysts. The technical analyst analyzes the “micro” movements, trying to match the actual occurrence with known patterns. The fundamental analyst tries to find correlation between the trend seen on the chart and “macro” events occurring parallel to that (political and others).
What is an appropriate time scale to use on a chart?It depends on the trader’s strategy. The short-range investor would probably select a day chart (units of hours, minutes), where the medium and longrange investor would use the weekly or monthly charts. High resolution charts (e.g. – minutes and seconds) may show “noise”, meaning that with fine details in view, it is sometimes harder to see the overall trend.
The major types of charts:• Line chart
The simplest
form, based upon
the closing rates
(in each time
unit), forming a
homogeneous
line. (Such chart,
on the 5-minutes
scale, will show a
line connecting all
the actual rates
every 5 minutes).
This chart does not show what happened during the time unit selected by the viewer, only closing rates for such time intervals. The line chart is a simple tool for setting support and resistance levels.
• Point and figure charts - charts based on price without time. Unlike
Increases are represented by a rising stack of Xs, and decreases are represented by a declining stack of Os. This type of chart is used to filter out non-significant price movements, and enables the trader to easily determine critical support and resistance levels. Traders will place orders when the price moves beyond identified support / resistance levels.
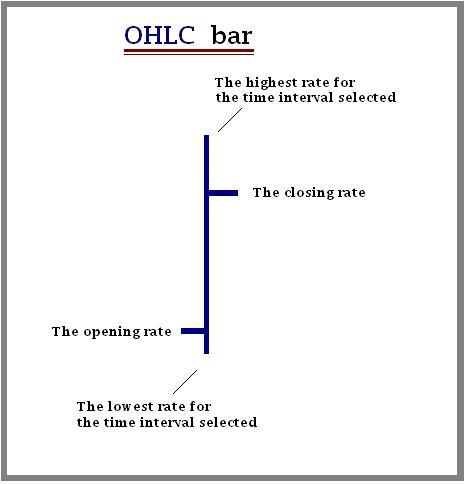
• Bar chart
This chart shows three
rates for each time
unit selected: the high,
the low, the closing
(HLC). There are also
bar charts including
four rates (OHLC,
which includes the
Opening rate for the
time interval). This
chart provides clearly
visible information
about trading prices
range during the time
period (per unit)
selected.
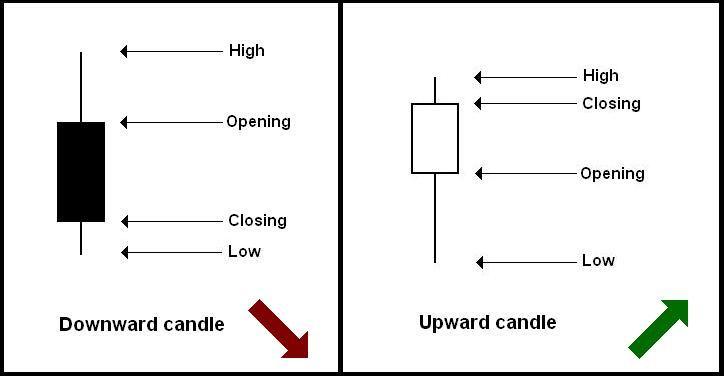
• Candlestick chart
This kind of chart is based on an ancient Japanese method. The chart represents prices at their opening, high, low and closing rates, in a form of candles, for each time unit selected.
The empty (transparent) candles show increase, while the dark (full) ones show decrease.The length of the body shows the range between opening and closing, while the whole candle (including top and bottom wicks) show the whole range of trading prices for the selected time unit.
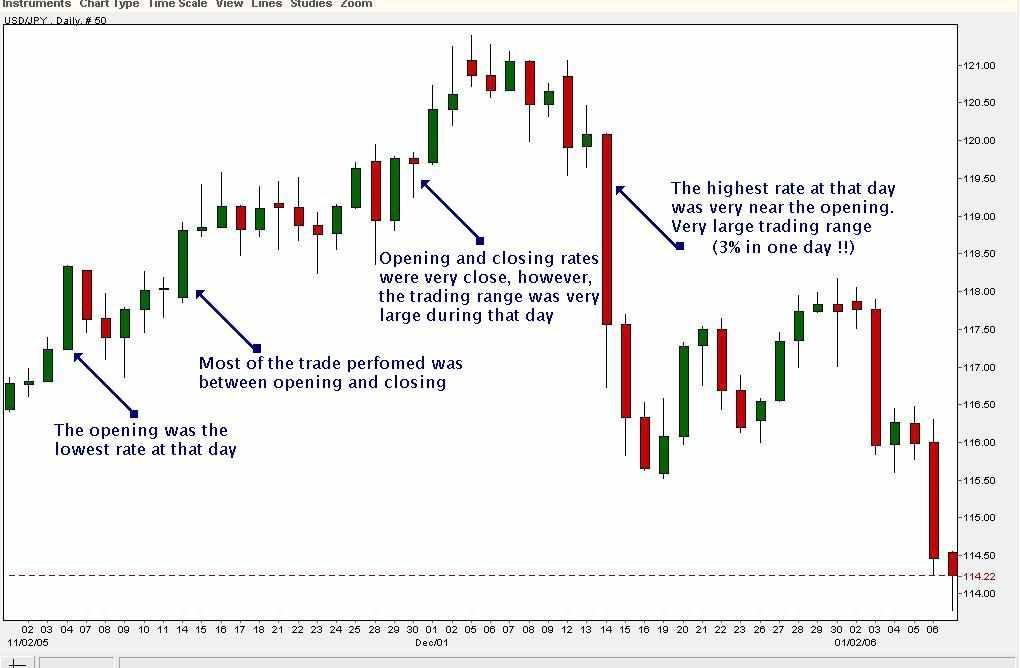
 Following is a candlestick chart (USD/JPY) with some explanations:
Pattern recognition in Candlestick charts
Pattern recognition is a field within the area of “machine learning”.
Alternatively, it can be defined as “the act of taking in raw data and taking an action based on the category of the data”. As such, it is a collection of methods for “supervised learning”.
A complete pattern recognition system consists of a sensor that gathers the observations to be classified or described; a feature extraction mechanism that computes numeric or symbolic information from the observations; and a classification or description scheme that does the actual job of classifying or describing observations, relying on the extracted features.
In general, the market uses the following patterns in candlestick charts:• Bullish patterns: hammer, inverted hammer, engulfing, harami, harami cross, doji star, piercing line, morning star, morning doji star.
• Bearish patterns: shooting star , hanging man, engulfing, harami, harami cross, doji star, dark cloud cover, evening star, evening doji star.
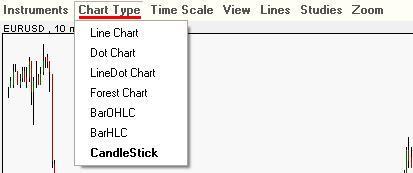
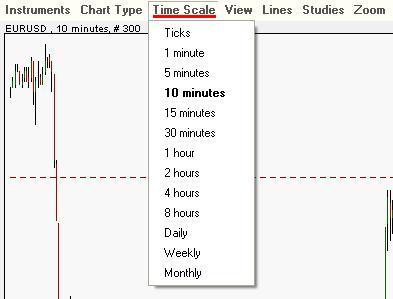
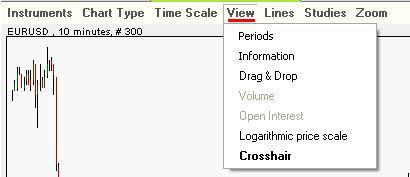
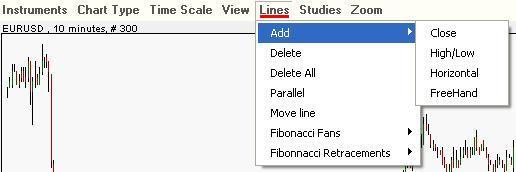
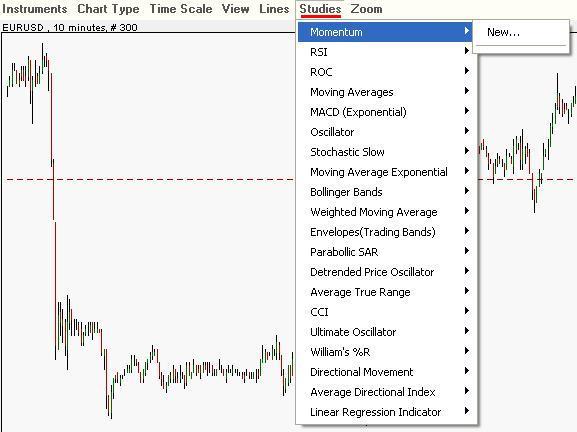
Chart system available at Easy-Forex™ Trading PlatformThe Easy-Forex™ Trading Platform offers the following charting tools, for both professional and beginner traders.
The chart types:
 The time scales:
 The view types:
 The "drawing line on the chart" types:
 The Study types:
Please note: the above screen-shots were taken around mid-2006. The Easy-Forex™ platform continuously upgrades its system, while adding new features on a regular basis.
[6.4] Technical Analysis categories / approaches
Technical Analysis can be divided into five major categories:
• Price indicators (oscillators, e.g.: Relative Strength Index (RSI))
• Number theory (Fibonacci numbers, Gann numbers)
• Waves (Elliott's wave theory)
• Gaps (high-low, open-closing)
• Trends (following moving average).
Relative Strength Index (RSI): The RSI measures the ratio of up-moves to down-moves and normalizes the calculation, so that the index is expressed in a range of 0-100. If the RSI is 70 or greater, then the instrument is assumed to be overbought (a situation in which prices have risen more than market expectations). An RSI of 30 or less is taken as a signal that the instrument may be oversold (a situation in which prices have fallen more than the market expectations).
Stochastic oscillator: This is used to indicate overbought/oversold conditions on a scale of 0-100%. The indicator is based on the observation that in a strong up-trend, period closing prices tend to concentrate in the higher part of the period's range. Conversely, as prices fall in a strong down-trend, closing prices tend to be near the extreme low of the period range. Stochastic calculations produce two lines, %K and %D, that are used to indicate overbought/oversold areas of a chart. Divergence between the stochastic lines and the price action of the underlying instrument gives a powerful trading signal.
Moving Average Convergence/Divergence (MACD): This indicator involves plotting two momentum lines. The MACD line is the difference between two exponential moving averages and the signal or trigger line, which is an exponential moving average of the difference. If the MACD and trigger lines cross, then this is taken as a signal that a change in the trend is likely.
[b] Number theory:Fibonacci numbers: The Fibonacci number sequence (1, 1, 2, 3, 5, 8, 13, 21, 34 ...) is constructed by adding the first two numbers to arrive at the third. The ratio of any number to the next larger number is 61.8%, which is a popular Fibonacci retracement number. The inverse of 61.8%, which is 38.2%, is also used as a Fibonacci retracement number (as well as extensions of that ratio, 161.8%, 261.8%). Wave patterns and behavior, identified in Forex trading, correlate (to some extent) with relations within the Fibonacci series. The tool is used in technical analysis that combines various numbers of Fibonacci retracements, all of which are drawn from different highs and lows. Fibonacci clusters are indicators which are usually found on the side of a price chart and look like a series of horizontal bars with various degrees of shading. Each retracement level that overlaps with another, makes the horizontal bar on the side darker at that price level. The most significant levels of support and resistance are found where the Fibonacci cluster is the darkest. This tool helps gauging the relative strength of the support or resistance of various price levels in one quick glance. Traders often pay close attention to the volume around the identified levels to confirm the strength of the support/resistance.
Gann numbers: W.D. Gann was a stock and a commodity trader working in the '50s, who reputedly made over $50 million in the markets. He made his fortune using methods that he developed for trading instruments based on relationships between price movement and time, known as time/price equivalents. There is no easy explanation for Gann's methods, but in essence he used angles in charts to determine support and resistance areas, and to predict the times of future trend changes. He also used lines in charts to predict support and resistance areas.
[c] WavesElliott's wave theory: The Elliott Wave Theory is an approach to market analysis that is based on repetitive wave patterns and the Fibonacci number sequence. An ideal Elliott wave pattern shows a five-wave advance followed by a three-wave decline.
[d] GapsGaps are spaces left on the bar chart where no trading has taken place. Gaps can be created by factors such as regular buying or selling pressure, earnings announcements, a change in an analyst's outlook or any other type of news release.
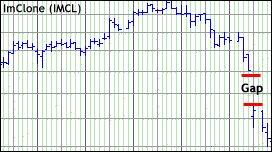
An up gap is formed when the lowest price on a trading day is higher than the highest high of the previous day. A down gap is formed when the highest price of the day is lower than the lowest price of the prior day. An up gap is usually a sign of market strength, while a down gap is a sign of market weakness. A breakaway gap is a price gap that forms on the completion of an important price pattern. It usually signals the beginning of an important price move. A runaway gap is a price gap that usually occurs around the mid-point of an important market trend. For that reason, it is also called a measuring gap. An exhaustion gap is a price gap that occurs at the end of an important trend and signals that the trend is ending.
[e] TrendsA trend refers to the direction of prices. Rising peaks and troughs constitute an up trend; falling peaks and troughs constitute a downtrend that determines the steepness of the current trend. The breaking of a trend line usually signals a trend reversal. Horizontal peaks and troughs characterize a trading range.
In general, Charles Dow categorized trends into 3 categories: (a) Bull trend (up-trend: a series of highs and lows, where each high is higher than the previous one); (b) Bear trend (down-trend: a series of highs and lows, where each low is lower than the previous one); (c) Treading trend (horizontaltrend: a series of highs and lows, where peaks and lows are around the same as the previous peaks and lows).
Moving averages are used to smooth price information in order to confirm trends and support-and-resistance levels. They are also useful in deciding on a trading strategy, particularly in futures trading or a market with a strong up or down trend. Recognizing a trend may be done using standard deviation, which is a measure of volatility. Bollinger Bands, for example, illustrate trends with this approach. When the markets become more volatile, the bands widen (move further away from the average), while during less volatile periods, the bands contract (move closer to the average).
Various Trend linesPattern recognition in Trend lines, which detect and draw the following patterns: ascending; descending; symmetrically & extended triangles; wedges; trend channels.