Get Your FREE course… Must Have Discoveries From a Trading Veteran – and more hints and tips… Just sign up to the newsletter by sending an email Here.
You are free to give this eBook away as you wish.
You can give it away free – to your subscribers, to your affiliates or to anyone else and you can make it available as part of a commercial package.
The only conditions are that this eBook must remain completely intact, without being altered and you cannot claim ownership of this eBook.
Attention: This eBook is protected by International Copyright Laws.
Introduction
In this ebook are several patterns which produce great trading signals/ trading opportunities for trading stocks, futures, FOREX and so on - especially when two or more of these patterns occur at once, in the same time frame or in more than one time frame.
All jargon/ terms like **this** are explained later so that identifying and using these killer patterns is extremely easy.When there is info like [[this]] - it means these terms are being explained. If you already know what these terms mean – you’ll know what to miss out.
OK let’s get to it...
Entering a **short trade** based on three sell signals would be a no-brainer, especially if one of these sell signals was the one shown on page 12.
- [[Entering a ‘short trade’ means selling to start with, without having bought anything first - and this is also known as ‘selling to open a position.’ The opposite is entering a ‘long trade,’ which means buying to start with, without having sold anything first – and this is also known as ‘buying to open a position.’]]
Furthermore, the longer the time frame that the patterns occur in, the longer the move is likely to be - either up or down. So patterns noticed on the weekly charts will produce bigger moves than patterns noticed on the daily charts. Also, signals in longer time frames are more reliable than signals given in shorter time frames.
Some of these patterns are so good that they don't require backup from other patterns for you to take the trade. This advice is a guide based on my trading, observations and reading of the markets over the last decade.
If you're anything like me you'll want to get on with it and just see the patterns that work extremely well and read the most valuable info - without an in depth description of how it's all calculated, so that’s what I've done. If you want a more thorough description please contact me through my site WizardTrader.com and I'll add it to a future eBook.
MACD Histogram(A histogram is a bar chart)
This indicator is one of the best and it shows whether **bulls or bears** are controlling prices and whether they are growing stronger or weaker. These signals are very easy to read too.
[[Bulls believe that prices will rise – so they buy to start with and bears believe that prices will fall - so they sell to start with.]]The slope of the MACD - histogram is more important than whether or not it is above or below the centre line.
An upward sloping MACD - histogram shows that the bulls are becoming stronger. It follows that a downward sloping MACD - histogram shows that the bears are getting stronger.
The price trend (up or down) is likely to continue when the slope of the MACD Histogram moves in the same direction as prices.The price trend is put in jeopardy though i.e. there is more risk of it changing, when the slope of the MACD Histogram moves in the opposite direction to prices. You should trade in the direction of the slope of the MACD - histogram.
The best buy signals are given when the MACD - histogram is below the centre line and its slope then turns upwards - showing that the bears are tired. And these signals are backed up and become extremely strong when there is a **bullish divergence.**
It follows that the best sell signals are created when MACD - histogram is above the centre line and its slope turns so that it is downwards. This shows that the bulls have become tired. These sell signals are backed up and become extremely strong when there is a **bearish divergence.**
So there are two main types of signals given by MACD - histograms. 1) The first type is just based on the direction of the slope of the histogram from one bar to the next.- If the slope is down (meaning that the most recent bar is lower than the one before it) it shows that the bears are in control and you should be short.
2) The second type is MACD Histogram Divergences – both bearish and bullish.
1) How to Trade Using The Slope of MACD Histogram.
This quick explanation is shown before the term is mentioned below: A stop or 'stop-loss' helps to protect your capital. - If you have initially sold (gone short), your initial stoploss will be an order that you place to ‘buy to close’ your trade at a price which is above the price at which you initially sold.
Go short as soon as the histogram stops getting higher and instead ticks down (moves down). Your initial stop should be placed above the last minor high in prices. If prices fall, this stop should then be moved down to lock in paper profits so as to be placed just above the highest price level in the last two days.
This should be a trailing stop - meaning that as the price drops, your stop follows the price and moves down, but if prices start to rise, your stop doesn't move.Go long as soon as the histogram stops going lower and ticks upwards instead. Your initial stop should be placed below the last minor low in prices. If prices rise, this stop should then be moved up to lock in paper profits so that it is placed just below the lowest price level in the last two days.
It's important to realise that these signals just described are only worthwhile on weekly charts and on charts of a longer time frame. - There are just too many moves up and down on the daily charts and on the charts of even shorter time frames to be useful.
Also - these signals definitely need confirmation from other signals and in as many time frames as possible, because on their own they're not extremely strong.You should know that MACD - histogram confirms (backs up) price trends when they both reach new lows at the same time or when they both reach new highs at the same time.
- So when there have been new lows in this indicator and new lows in prices at the same time - you can expect prices to continue to fall.- It follows that when there have been new highs in MACD - histogram and new highs in prices at the same to time - you can expect prices to move even higher.
And even when there are new lows in this indicator without new lows in prices at the same time - you can still expect even lower prices in the near future. This type of signal is even stronger when MACD histogram has reached its lowest level for the past three or four months.
It makes sense then that when there are new highs in this indicator even without new highs in prices at the same time - you can still expect even higher prices in the near future. Again, this signal is very strong when MACD histogram has reached its highest level for three or four months.
Now we'll move onto the strongest MACD histogram signals and probably the strongest signals in technical analysis. [[Put simply - divergences between indicators and prices means they have moved in different directions to each other.]]
Important. There can be some space between the tops or the bottoms that make up each MACD – histogram pattern i.e. these tops (or bottoms) don’t have to immediately follow each other.
Strongest Bearish DivergencesMACD divergences generally indicate that a major reversal is about to occur but they do not happen at every major top or bottom.
A strong bearish divergence is where prices reach a new high but the MACD histogram makes a lower top. This shows that the bulls are becoming weak. To trade this you should go short when the MACD histogram ticks down after its second top (the lower top) when prices are at a new high. Your stop loss should be placed above the most recent high in prices.
Price– Moving Up
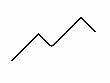 Indicator– Moving Down
If you get stopped out because prices go beyond the latest high, look for a 'Triple Bearish Divergence.' These signals are even stronger than normal divergences. They are identified by three price peaks and three indicator tops. Go short when the MACD histogram ticks down after its third top (the lowest top) when prices are at a new high. Again, you should place your protective stop above the most recent and highest high in prices.
Price– Moving UpAs I said earlier - the new downtrend in prices is confirmed if prices keep dropping to new lows and the MACD histogram continues to go lower at the same time.
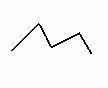
Strongest Bullish Divergences
A bullish divergence is where prices drop to a new low but the MACD - histogram makes a higher bottom. This shows that the bears are becoming weaker. To trade this you should buy when the MACD - histogram ticks up from its later and higher bottom, while the price is at a new low. Your stop-loss should be placed below the latest low in prices.
Price– Moving DownIf you get stopped out because prices have fallen and have made a new low - look out for a 'Triple Bullish Divergence.' This is where the MACD - histogram makes an even higher and later third bottom while prices continue to make new lows. This is an extremely strong buy signal. To trade this you should buy when the MACD - histogram ticks up from its latest and highest bottom while the price is at a new low. Your stop-loss should be placed below the latest low in prices.
Price – Moving DownThese divergences just described (both bearish and bullish) nearly always signal good trades.
All the following divergences are not as strong – so they need to be confirmed by other proven price signals.
Next Best Divergences
As before – in the case of the strongest bearish divergences, the MACD - histogram makes a lower peak, but this time prices make a double top - meaning that the two price tops are the same height.
To trade this you should go short when the MACD- histogram ticks down after its second top (the lower top), while prices are at their second top. Your stop loss should be placed above these recent highs in prices.
BullishPrices make a double bottom - which means that the two price bottoms have the same depth, while the MACD - histogram makes a higher bottom.
To trade this you should buy when the MACD - histogram ticks up from its second (and higher) bottom, while the price is at its second bottom. Your stop-loss should be placed below these lows in prices.
Weakest DivergencesPrices reach a new high, while the MACD - histogram makes a double top - meaning that the two tops are the same height.
To trade this you should go short when the MACD - histogram ticks down after its second top, while prices are at a new high (their second top). Your stop loss should be placed above this last high in prices.
BullishPrices make a new low, while the MACD - histogram makes a double bottom - again meaning that the two bottoms are same depth.
To trade this you should buy when the MACD - histogram ticks up from its second bottom, while prices are at a new, lower low. Your stop-loss should be placed below this new and lower low in prices.
A Strong Chart SignalThe following chart pattern gives an almost perfect shorting opportunity where the arrow points to - especially when there is a bearish divergence in the MACD - histogram at the same time.
This shorting opportunity is even better when the slope of the uptrend that gets broken is very steep (noticeably steeper than normal) and it’s improved even more when the pullback to the up trend line occurs with falling volume.
Up trend lines should be drawn so that they connect two or more bottoms of price bars – where higher highs and higher lows in prices are being made.It follows that down trend lines should be drawn so that they connect two or more tops of price bars – where lower lows and lower highs in prices are being made
Trend lines should not connect extremes of prices. So they should not connect the bottoms of spikes lower in up-trends and they should not connect the tops of spikes higher in downtrends.
A very good buying opportunity occurs at point ii) to be described.
Please don’t try and force the issue by attempting to identify patterns that just aren’t there, for example, by resizing your trend lines constantly until you find something that might be a killer pattern. You’ll know when you’ve found a great set up fairly quickly.
SummaryTo sum up – this brief ebook describes some trading methods – but not a whole system.
Even when you’ve got your system - there are a couple of other vital parts to trading success which you shouldn’t neglect. These are psychology i.e. your mindset when trading and money management.
These areas - and more are looked into in my free newsletter Must Have Discoveries From a Trading Veteran and in the WizardTrader.com eBook.- So sign up to the newsletter by sending an email Here! It’s easy, fast and I’m pretty sure you’ll discover something new, even if you’ve been trading for years…
As I said at the start – the methods described in this e-book are not the same as the Wizard Trader methods – but when combined they produce extremely powerful signals.
So just combine the trading set-ups here with those over at – Wizard Trader for super powerful opportunities.

Reads:
2
Pages:
32
Published:
Apr 2024
Boost Your Online Traffic with the "Proven Traffic Mastery" eBook!Elevate your digital marketing skills with actionable strategies for increasing website traf...
Formats: PDF, Epub, Kindle, TXT

Reads:
34
Pages:
97
Published:
Feb 2024
You're going to learn from a master about generating website traffic. A LOT of website traffic. In fact, for better than ten years this has been one of the be...
Formats: PDF, Epub, Kindle, TXT

Reads:
144
Pages:
74
Published:
Sep 2023
Plan Your Visit Playbook: The Church Marketing Strategy That Generates 20-50 New Visitors Every Month. What is Plan Your Visit Playbook all about?To put it si...
Formats: PDF, Epub, Kindle, TXT

Reads:
198
Pages:
42
Published:
Jul 2023
the world of business and commerce is not slow to realize the profit potential of social media. In this eBook, you will find 200 unique and useful tips that w...
Formats: PDF, Epub, Kindle, TXT