1. ENERGY PRODUCTION AND RESOURCES OF THE U.K..............................2
PRIMARY ENERGY PRODUCTION. ............................................................................2
DEPLETION OF OIL RESOURCES.............................................................................4
GAS PRODUCTION AND RESERVES. ........................................................................5
COAL PRODUCTION AND RESERVES. ......................................................................5
CAPACITY OF RENEWABLE AND NUCLEAR ENERGY SOURCES.................................6
4. GOVERNMENT ENERGY POLICY..................................................................12 SECURITY............................................................................................................13 DIVERSITY...........................................................................................................14 SUSTAINABILITY ..................................................................................................15
D EPLETION OF NATURAL RESOURCES .............................................................16
EFFICIENT USE OF ENERGY.............................................................................16
ENVIRONMENT...............................................................................................17
ECONOMY .....................................................................................................18
SOCIAL..........................................................................................................19
COMPETITIVE PRICES ..........................................................................................19
5. ENERGY IN THE ECONOMY; INVESTMENT AND PRODUCTIVITY. ...........20 OUTPUT AND CONTRIBUTION TO THE BALANCE OF PAYMENTS. ..............................20 INVESTMENT IN THE ENERGY INDUSTRIES. ............................................................22 THE OIL AND GAS EXTRACTION INDUSTRY............................................................23 THE ELECTRICITY INDUSTRY.................................................................................24 THE DOWNSTREAM GAS INDUSTRY......................................................................25 THE COAL INDUSTRY. ..........................................................................................27 THE NUCLEAR INDUSTRIES. .................................................................................28
6. ENERGY AND THE ENVIRONMENT. .............................................................30 CLIMATE CHANGE ...............................................................................................30 UNITED KINGDOM: ENVIRONMENTAL ISSUES ........................................................31
A IR POLLUTION ..............................................................................................31
ENERGY USE AND CARBON EMISSIONS...........................................................32
ENERGY AND CARBON INTENSITY...................................................................34
PER CAPITA ENERGY CONSUMPTION..............................................................35
RENEWABLE ENERGY.....................................................................................35
UNITED KINGDOM ENTERING THE 21ST CENTURY ...........................................36
7. ENERGY CONSUMPTION INDICATORS AND STATISTICAL VIEW. .............37 ENERGY RATIO....................................................................................................37 ENERGY CONSUMPTION BY SECTOR......................................................................38 INDUSTRIAL ENERGY CONSUMPTION AND OUTPUT .................................................38 TRANSPORT ENERGY CONSUMPTION.....................................................................39 DOMESTIC ENERGY CONSUMPTION.......................................................................40 SERVICE SECTOR ENERGY CONSUMPTION.............................................................42
8. MAIN TRENDS IN ENERGY CONSUMPTION...................................................43 9. CONVERSION EFFICIENCIES: THE IMPACT OF INCREASING ACTIVITY, EFFICIENCY AND STRUCTURAL CHANGE IN THE ECONOMY. ......................4510. FINAL ENERGY CONSUMPTION....................................................................49 TOTAL DEMAND BY SECTOR ........................................................................49 TOTAL DEMAND BY FUEL ..............................................................................50 TOTAL DEMAND BY END USE........................................................................51
DOMESTIC SECTOR ..................................................................................52
INDUSTRY ..................................................................................................55
SERVICE SECTOR .....................................................................................56
TRANSPORT...............................................................................................57
11. ANALYSIS OF THE FACTORS DRIVING CHANGES. ...................................59 ENERGY INTENSITY........................................................................................60 INDUSTRY ..................................................................................................61 DOMESTIC SECTOR ..................................................................................62 SERVICE SECTOR DEMAND.....................................................................65 TRANSPORT DEMAND ..............................................................................67 ENERGY EFFICIENCY ...............................................................................69 THE GOVERNMENT’S APPROACH................................................................71 A SUSTAINABLE ENERGY POLICY...........................................................71 CLIMATE CHANGE .....................................................................................72
CONCLUSIONS AND RECOMMENDATIONS ......................................................73 CONCLUSIONS ................................................................................................73 DEPLETION OF RESOURCES............................................................................73 CONSUMPTION GROWTH.................................................................................74 FUTURE DEVELOPMENT..................................................................................76 WHY SUPPORT RENEWABLES?........................................................................79 RECOMMENDATIONS .....................................................................................82
REFERENCES ........................................................................................................84Energy plays a vital role in our modern society, underpinning the quality of life we enjoy. Whether in the domestic sector, industry and commerce or transport, its constant and uninterrupted availability is something we often take for granted. For vulnerable consumers, this security can be a lifeline. In recent years, energy production and consumption has played an ever-increasing role. In the past decade or so, it has become increasingly obvious that the production and use of energy has significant environmental implications. This has led to a range of agreements in various international forums aimed at limiting further damage to the environment. It will be a major challenge to achieve a balance between the need, on the one hand, for economic growth and, on the other, the need to reduce the impact of energyrelated emissions on the environment, since historically economic growth has marched hand in hand with increased energy consumption. Ensuring secure, diverse and sustainable supplies of energy at competitive prices remains a key policy objective of the United Kingdom Government.
The increasing importance of energy in modern life and the global growth of energy consumption was the reason that appealed to me to examine in deep the energy consumption of UK. In this project module I investigate principally the energy system of UK, including energy production and resources of the UK and the energy use indicators, energy market and prices. I look at the international energy production and use and UK government energy policy and the role of energy in the economy. The present major report examines specifically energy consumption of the UK in different aspects and the relation between energy consumption and the environment. It provides the latest figures on energy production, energy use, foreign trade and prices of fuels and discusses the main trends in energy consumption of UK and of the world, conversion efficiencies and final energy consumption by sector.
Environmental objectives are becoming increasingly important. Climate change, arising from man-made emissions to the atmosphere -mostly from energy use - must be addressed. The acceleration in energy use around the world has led the International Energy Agency to forecast an increase in world energy demand of two-thirds by 2020. The task for governments is to match the need to protect the environment with the demand for economic growth, which is close related with rising energy consumption. Analysing factors driving changes I tried to answer the question about the future consumption of UK and integrated activities what must focuss on creating and applying new solutions which achieve balanced improvements to Britain’s energy, environmental and economic performance and thereby contribute towards a sustainable future for UK’s citizens.
Energy sources can be considered as primary or secondary. Primary fuels either occur naturally, as in the case of crude oil, natural gas or coal, or are derived by directly harnessing naturally occurring energy, as with nuclear or hydro electricity. UK is using fossil fuels in the form of coal, oil and natural gas, plus nuclear and renewable power as primary sources of energy. Secondary fuels, such as petroleum products, coke and secondary electricity, are obtained either from primary fuels or from other secondary fuels, by conversion processes.
UK is fortunate in possessing a range of different primary fuels, such as oil and natural gas. It is self sufficient in energy – unlike most of its competitors, dominates the foreign fuel trade, by crude oil and petroleum. It is also by far the most less dependent member state of the European Union on imports.
Energy production and total consumption can be expressed in terms of the energy content of the primary fuels. A common unit of energy, the tonne of oil equivalent, is used to enable data on different fuels to be combined and aggregated.
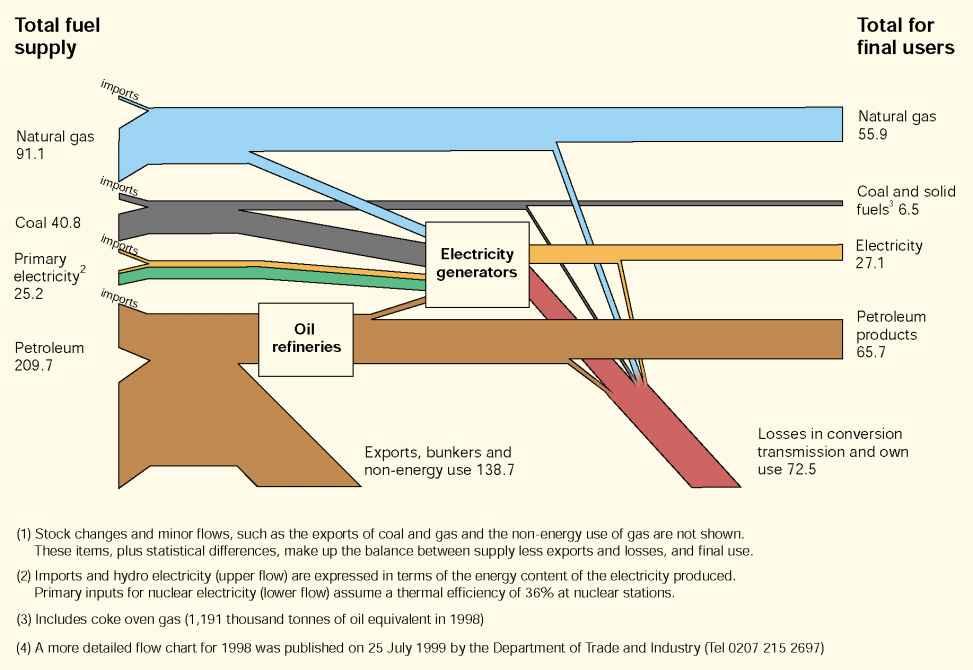
Chart 1.1
UK energy flows, 2002(1)(4) (Million tonnes of oil equivalent)
Source: Office for National Statistics
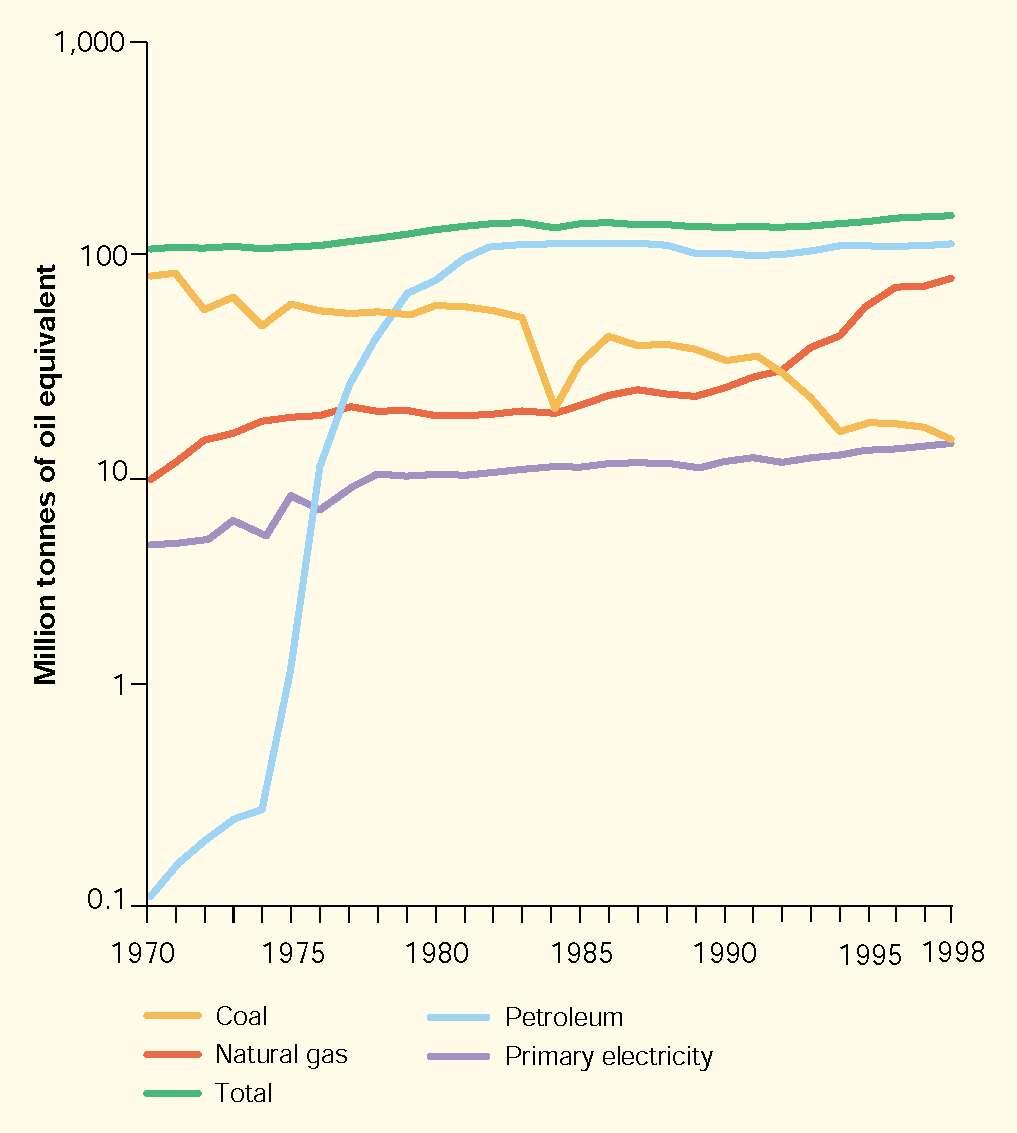
Chart 1.2
UK production of primary fuels, 1970 to 1998 Source: Office for National Statistics
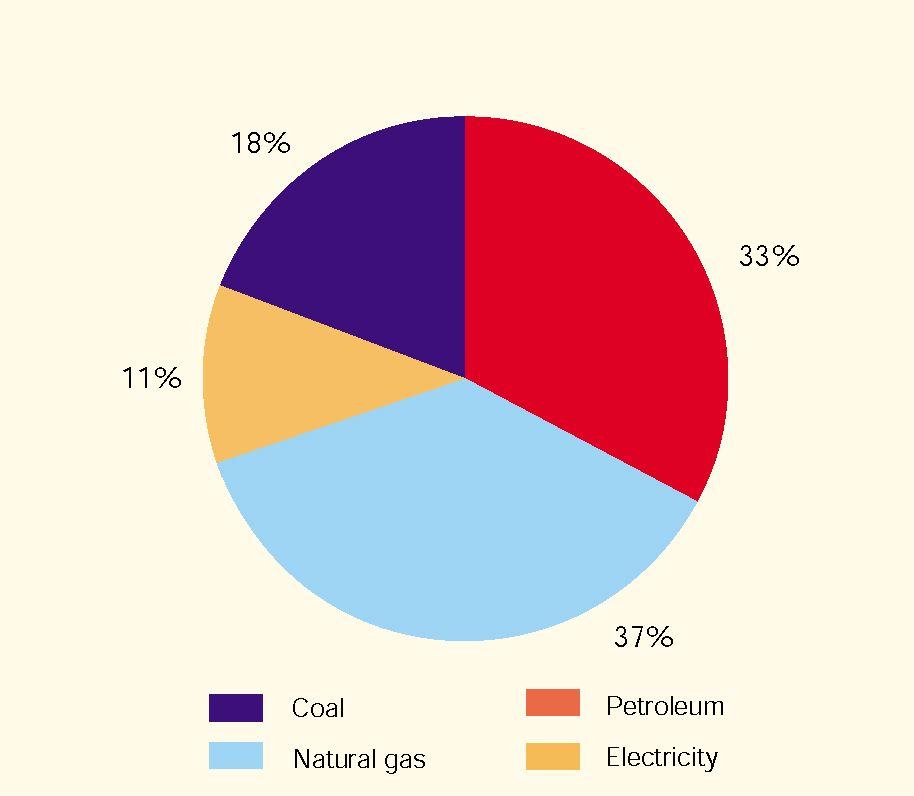
Chart 1.3
Primary energy supply by fuel, 1998 Source: Office for National Statistics
The flow of energy from primary production, through the conversion industries and to final users is shown in Chart 1.1.In this very simplified flow chart stock changes and minor flows such as exports of coal and gas and the non-energy use of gas, are not shown. It can be seen from the flow chart that final energy demand is met by a combination of primary and secondary fuels. The chart also illustrates the relative magnitude of the energy losses occurring during the production of these secondary fuels, particularly during electricity generation.
The UK is fortunate in possessing a range of different primary fuels. Chart 1.2 shows trends in the production of these fuels and illustrates the rapid increase in the production of North Sea oil and natural gas in the 1970s. Chart 1.3 shows the contribution of these fuels to primary energy supplies in 1998.Supplies are met from domestic production and from imports. Unlike most of its competitors the UK is self-sufficient in energy. Chart 1.4 shows the UK’s primary energy production and consumption, and illustrates the degree to which the country was dependent on energy imports prior to North Sea oil and gas becoming available. In the early 1970s energy imports accounted for over 50 per cent of the UK’s consumption, but in 1983 the UK was a net exporter, at a level equivalent to 18 per cent of inland consumption. After 1983, net exports declined slowly, and, following temporary production losses in the North Sea since 1988, the UK was a net importer of energy until 1993.The balance switched again in 1994 as production on the UK continental shelf started to recover. Since then production has continued to rise.
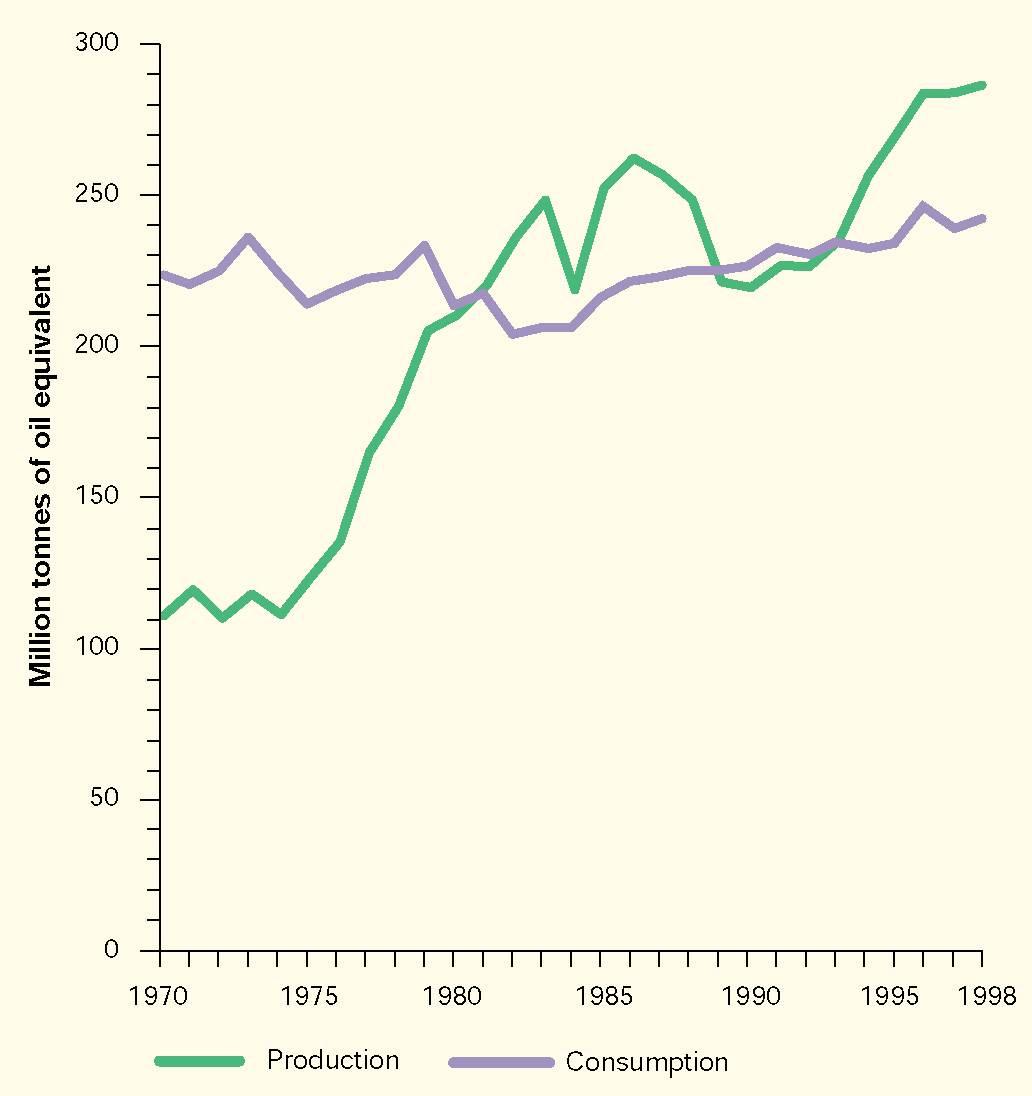
Chart 1.4
UK primary energy production
and consumption, 1970 to 1998
Source: Office for National Statistics
To the west of the Western Isles, Orkney and Shetland, where the shallow waters of the UK geological Continental Shelf meet the deeper waters of the North Atlantic, lies the region known as the Atlantic Margin. The rock beneath the seabed holds large amounts of crude oil and gas, trapped many miles beneath the bottom of the ocean between geological layers millions of years old. Oil companies have explored this area for more than 20 years. So far they have found reservoirs that contain up to 1.5 billion barrels of crude oil that could be extracted. These reserves would be the equivalent of 5% of all UK oil discoveries to date.
Remaining reserves of oil have been broadly unchanged since the mid-1980s despite large increases in production.Revisions to estimates of reserves in 1998 are due to limited new discoveries and by the impact of low oil prices during the year affecting the economic viability of some previous discoveries, and affecting company activities.
Oil production as a proportion of reserves has increased steadily since 1992, and in 1998 reached a high for the period, partly due to downward revisions to the estimates for reserves, but also due to increased production.
About 7.5% of the UK's proven, probable and possible oil reserves were consumed in 1998. The ratio of extraction has been increasing steadily since 1980 and in 1988 it exceeded the previous high level of 6.8 per cent in 1985. Since 1980, estimates of remaining proven, probable and possible oil reserves fluctuated around 2 billion tonnes level, despite production totalling 2.0 billion tonnes over the period.
However, these ratios should not be taken as a measure of the future life of these reserves; additional reserves continue to be discovered and it is therefore likely that production of oil will continue at current levels for longer than suggested by these depletion rates.
Typically, the estimates of remaining reserves in present discoveries have stayed at broadly the same level over the last 10 years, despite the large increase in oil and gas extracted. This is due to new discoveries being made and new technology allowing exploitation of discoveries that were previously regarded as not viable.
Remaining gas reserves have increased slightly since the late 1980s despite large increases in production.
For gas, the depletion rate of 5.3 per cent seen in 1998 does not allow for additional discoveries or for the exploitation of coal bed methane. Since 1980, estimates of remaining proven, probable and possible gas reserves have been revised each year so that at the end of 1998 they are still 0.2 trillion cubic meters higher than at the end of 1980. This is the net result of increased discoveries amounting to 1.2 trillion cubic meters being offset by production of 1.0 trillion cubic meters of gas over the period.
As with oil, estimates of reserves of gas were revised downwards at the end of 1998, and this was the main reason for the increase seen in the depletion rate in the year (from 4.6 per cent in 1997) rather than any large increase in the level of production. This downwards revision to reserves followed from the close link that exists between the level of oil and gas prices affecting the economics of the production process, as well as increasingly gas being produced in association with oil production. As such, any decrease in the estimate of oil reserves has a direct impact on the estimates of gas reserves.
Gas production as a proportion of reserves has more than doubled since 1984. About 5.5%of the UK's proven, probable and possible gas reserves were consumed in 1998. The increase is mostly due to the downward revisions to the estimates for reserves, with only a slight increase in the level of production in the year.
However, these ratios should not be taken as a measure of the future life of these reserves; additional reserves continue to be discovered and it is therefore likely that production of gas will continue at current levels for longer than suggested by these depletion rates.
Coal Production and reserves.There were estimated to be approximately 200 million tonnes of economically viable coal reserves at existing mines at the end of March 1999.
Coal production declined during the 1980s, largely in response to falling demand caused by switching away from UK coal to more economic fuels.
In the 1990s UK produced coal has met with competition for electricity generation from gas and from cheaper imported coal. Whilst production fell rapidly in the early 1990s, (by nearly 40%between 1992 and 1995) its decline has slowed in recent years (to 20% between 1995 and 1998).
Between 1989 and 1995, coal production in the United Kingdom fell by half, while natural gas production increased 74 percent. Britain's move away from coal-fired electric power towards natural gas power is the result of rapidly changing prospects for both of these UK industries. The closure of uneconomic coal mines in the United Kingdom coincides with increasingly available natural gas supplies that have come on stream in the North Sea.
Privatization of electricity in the United Kingdom had an important impact upon fuel use in electricity generation. Coal had long been the predominant fuel in electricity generation and the electricity industry had long been the primary purchaser of British coal. However, between the 1980's and the mid 1990's, developments in the electricity, coal, and natural gas industries, along with changes in the political environment, created an environment that favored the use of natural gas (rather than coal) to become the preferred fuel of choice in UK electricity generation.
Environmental considerations also worked against UK coal in recent years. In
Environmental considerations also worked against UK coal in recent years. In percent reduction in total sulfur dioxide emissions by 2003, compared to 1980 emissions levels.
Since that time international prices have fallen slightly, and the coal quality specifications of UK consumers are set to tighten. Production levels will be affected by changes in demand caused by factors such as environmental limits on sulfur dioxide (SO2) emissions, by competition from gas and imported coal in the electricity generation sector, by planning constraints on opencast developments and by exhaustion of current deep-mined capacity.
Capacity of Renewable and Nuclear Energy Sources.Renewable sources of energy are those which are continuously and sustainably available in our environment such as energy from the sun, energy from water, energy from wind, energy from wood and crops, energy from waste and other renewables such as: waves, tides, heat from inside the earth.
Renewable sources accounted for 3%of all electricity generating capacity in the UK in 1998. Hydro electricity schemes provide two-thirds of the total capacity from renewables.
Renewable sources of energy make an important contribution to secure, sustainable and diverse energy supplies and are an essential element of a cost-effective climate change programme.
The Government is working towards a target of renewable energy providing 10 per cent of UK electricity supplies as soon as possible. It hopes to achieve this by 2010. Whilst this is an ambitious target it is not an end in itself. Rather the programme outlined in this document (and on which we would welcome your views) aims to give new and renewable technologies a push in the right direction. The Government expects renewables not only to generate power, but also to provide heat and transport for our homes, industry and commerce in centuries to come.
Renewables are not only important in generating jobs and developing future industries, they will also play a crucial role in enabling the UK to meet our environmental targets of reducing greenhouse gases by 12.5 per cent by 2008–2012 and our goal of reducing emissions of carbon dioxide by 20 per cent by 2010. UK’s Government is committed to putting the environment at the heart of decision making. As the Kenyan proverb says, “The earth was not given to us by our parents; it was loaned to us by our children”. We all have a responsibility to ensure that the way we live today does not adversely affect the inheritance we leave for generations to come1.
The capacity for electricity generation from renewable sources other than hydro is five and a half times its level in 1990. However, renewables contributed only 1 % to the UK's primary energy supply in 1998.
The United Kingdom was one of the first countries to employ nuclear power in electricity generation. The first nuclear power plant, the Calder Hall unit, was connected to the national electricity grid in 1956. In 1995, nuclear power accounted for 26 percent of all electricity generated in the United Kingdom.
The UK's nuclear plant capacity in 1998 was nearly four times greater than at the end of 1970. Nuclear electricity contributed about 10% to the UK's primary energy consumption and accounted for 28 % of electricity supplied in 1998.
Because electricity produced from nuclear sources generates none of the greenhouse gases associated with burning fossil fuels, nuclear power makes a substantial contribution to limiting such emissions. For example, if the electricity currently generated in the UK were to be generated using fossil fuels, there would be an increase in carbon emissions each year of between 11 and 22 million tonnes, depending on the mix of fossil fuels used as replacements. Put another way, nuclear electricity generation currently reduces national carbon emissions by between 7 and 14 per cent.
1 New & Renewable Energy Prospects for the 21st Century, John Battle Minister for Energy and IndustryA range of factors can influence price movements, including the degree of competition and the amount of liberalization within a market; the relative costs of primary fuels; and general movements in world
energy prices. Final prices can vary a
lot according to consumption - a large
industrial consumer will pay considera
bly less per unit than small user.
The introduction of competition, along
with other factors such as plentiful fuel
supplies, in industrial energy supply
markets has contribute to lower prices.
A similar trend has been evident in the
domestic gas market where in 1998
new competitors were offering reduc
tions of over 20 per cent off existing
British Gas prices. The opening up of
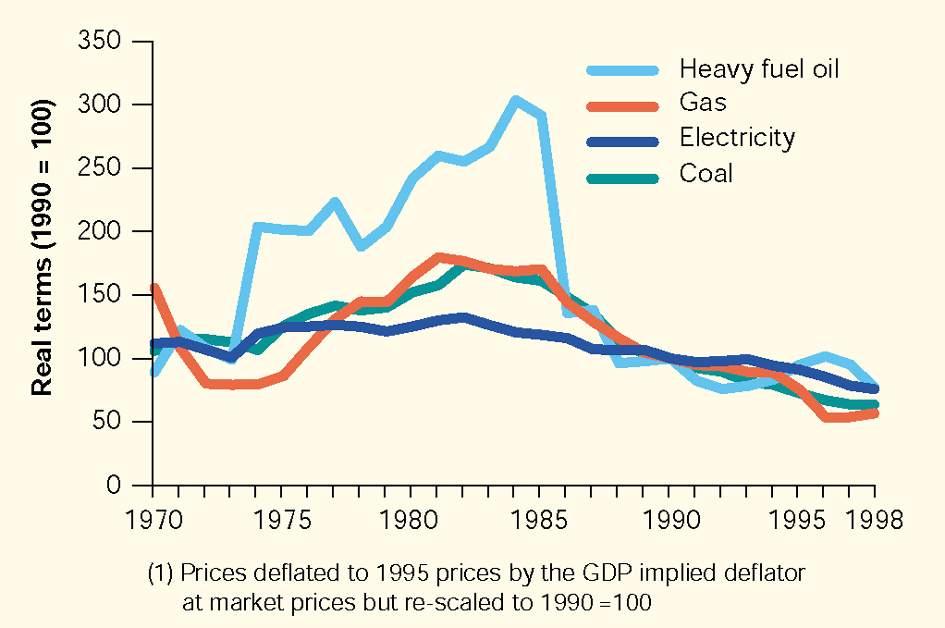 Fuel price indices
(1)
Chart 2.1
the domestic electricity market to full competition in 1999 appears to be having a
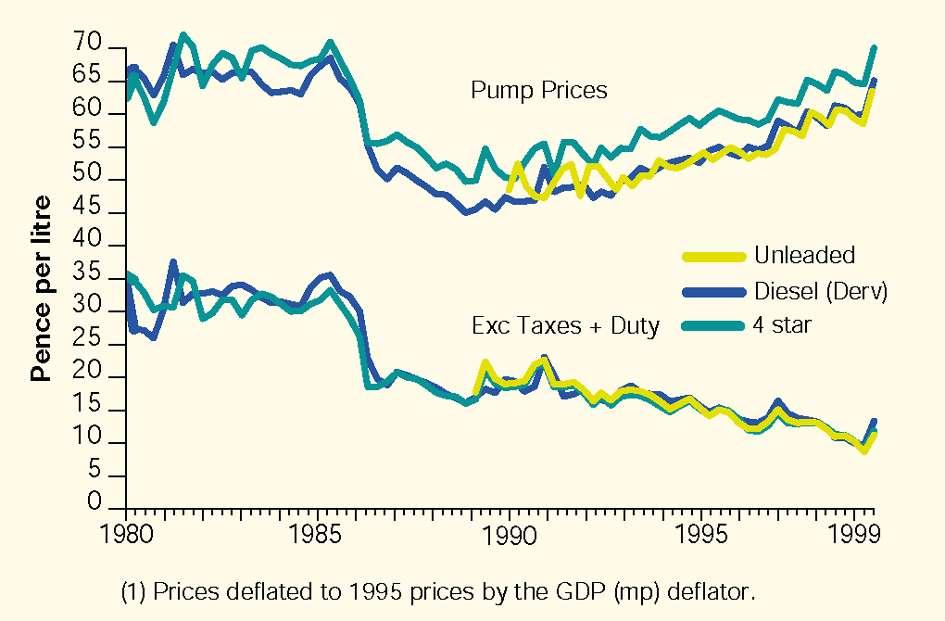
Chart 2.2
Petrol and diesel prices(1) , 1980 to 1999 Source: Office for National Statistics
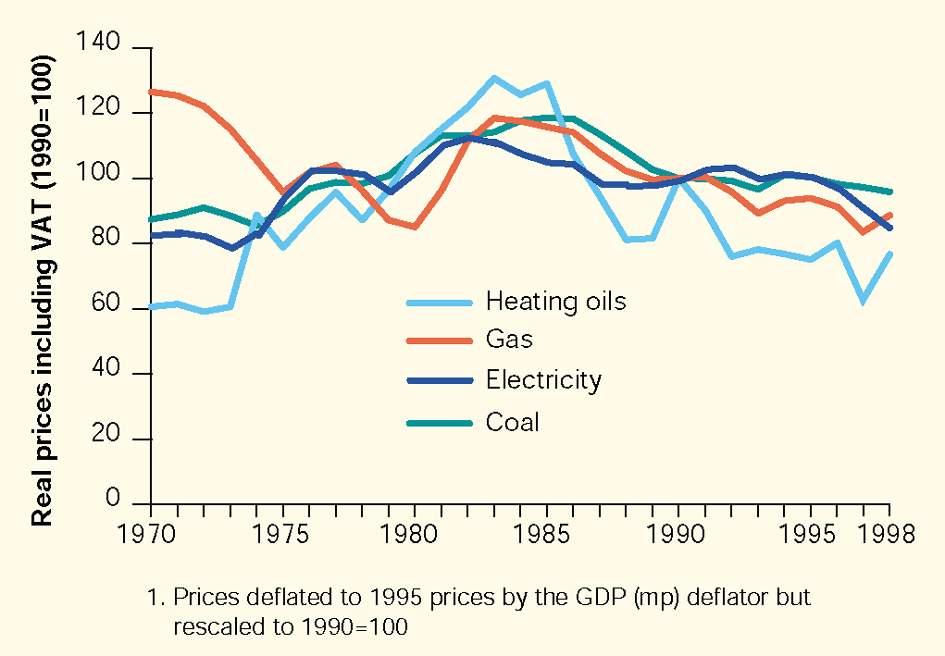
Chart 2.3
Fuel price indices(1) for the domestic sector, 1970 to 1998 Source: Office for National Statistics
similar effect on electricity prices. However, competition itself does not guarantee lower prices an indeed competition may be base on other factors such as quality of service. Prices paid by final consumers are influence by several factors including: international prices of key raw materials such as crude oil the balance of supply an demand taxes an the costs of extracting, manufacturing (i.e. refining or generation), distribution, retailing an marketing individual fuels.
The indicators presented here show trends in UK prices for both industrial and domestic consumers.
The importance of energy prices will vary between consumers, depending on what proportion energy costs are of their total costs: for example, an energy- intensive industry, such as metals manufacture or cement, will be very aware of price levels and of keeping control over its energy use. Similarly, for domestic consumers, energy use can account for 10 per cent or more of the expenditure of lower income households, but perhaps 3 per cent or less for the highest earners. More details on energy prices, including international comparisons will be given in the individual fuel chapters on the main report. The above data summarizes the latest main trends.
Annual average industrial prices for electricity and coal in 1998, in real terms, were at their lowest level since records began in 1970.Gas prices were lower only in 1996 and 1997.
Between 1990 and 1998 real industrial prices have fallen by 36% for coal; 43% for gas; 24% for electricity and 23%for heavy fuel oil. Annual average 4 star petrol prices have risen in real