• Starting at the top left hand corner draw a diagonal line to the center of the page.
• Where you stop mark this with a BIG NUMBER 1.
• Now from this point draw another diagonal line towards the top right hand corner but only go about half way up.
• Mark this point with a BIG NUMBER 2.
• Draw a diagonal line from the number 2 point, parallel to the first line, down towards the bottom right hand corner. BUT DO NOT GO ANYWHERE NEAR AS FAR DOWN AS YOUR NUMBER ONE POINT. This line should be your shortest one. Make it about half the length of your number 2 line.
• Mark this point with a BIG NUMBER 3.• Now you have a zig-zag pattern, marked clearly as a 1-2-3. Now draw a flat, horizontal line right on top of the number two point. On top of this line write: BUY HERE!
• Now imagine this is a stock you have been observing and it has formed a 1-2-3 bottom. IF THAT HORIZONTAL LINE across the number two is taken out then you have a valid buy.
• For a 1-2-3 topping formation that gives a valid sell signal simply reverse the whole procedure.• Practice, practice and practice some more until the pattern is firmly fixed in your mind. It takes a little time and effort to grasp the pattern but it is like riding a bike, when you get it right, you will never have to learn it again.
(This is how your drawing should have looked)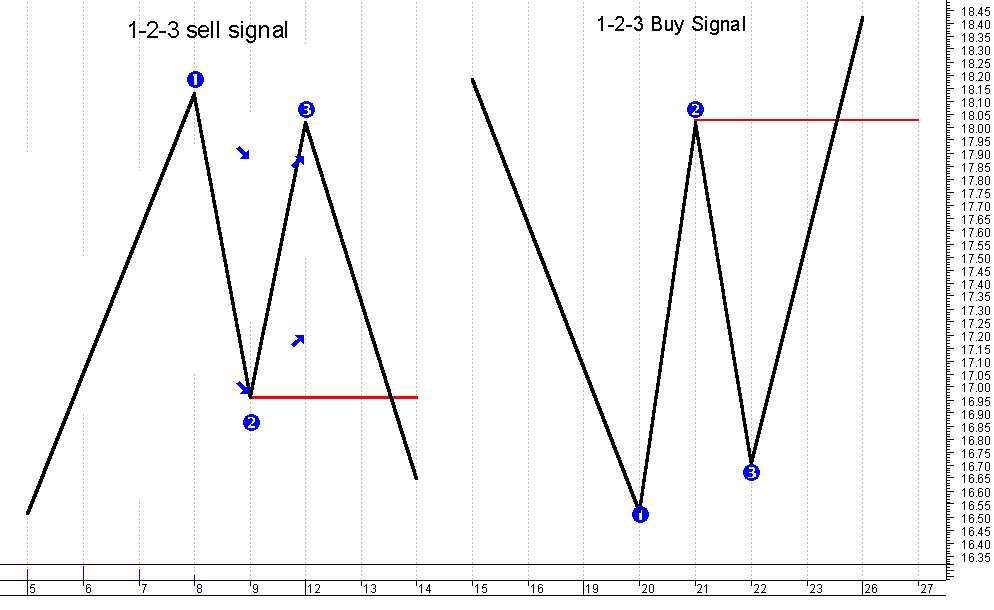 Let us have a look at a few more examples.

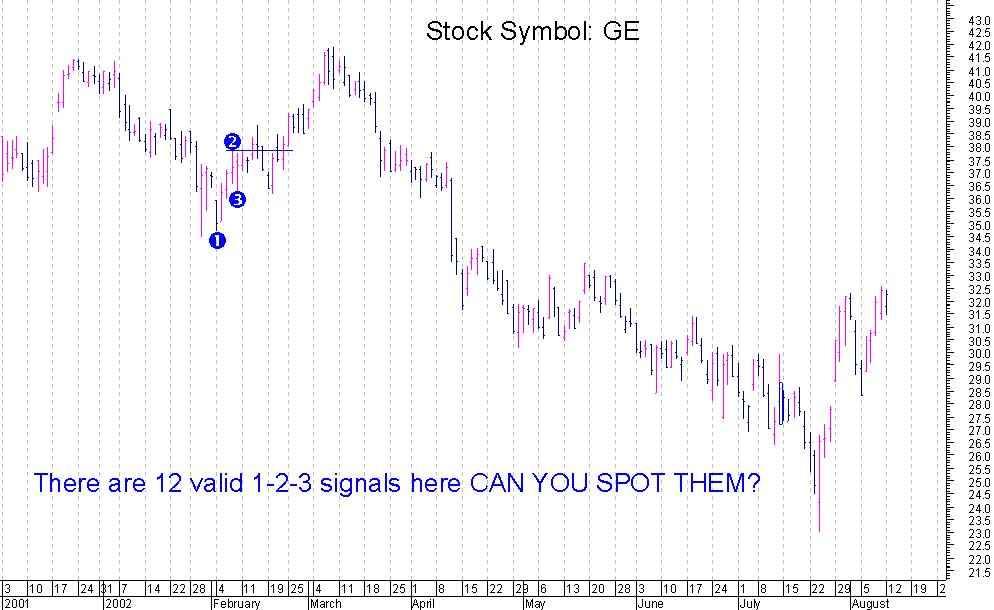
3 buy and sell signals are present on this daily bar chart of General Electric? (there are twelve) It may be difficult for you to spot them on this shrunken down version… that is not the most important point. The point is I wanted to show you how amazingly consistent this pattern is.
Have a look.
OK. That’s chapter one completed. Practice drawing 1-2-3’s and looking for them on your favourite stocks and futures markets. They happen all the time and are about 70% accurate in the price prediction. Let’s look at different charts and time frames with 1-2-3 signals.
* This is not 100% true. I’ll explain why in chapter four