 David Chia
 A Gift from COMBO Forex Profit System
2. Why Successful Traders Use Fibonacci and the Golden Ratio
3. Different Types of Market Orders: Using Each for the Best Fills
4. How to Make Money in Sideways Market?
5. How to Make Money In Trending Market 6. Nuggets of Wisdom from Jesse Livermore, Greatest Trader Ever
Achieving success in forex trading requires avoiding numerous pitfalls as much, or more, than it does seeking out and executing winning trades.
Following are 10 of the more prevalent mistakes I believe traders make in forex trading.
This list is in no particular order of importance.
1. Failure to have a trading plan in place before a trade is executed. A trader with no specific plan of action in place upon entry into a forex trade does not know, among other things, when or where he or she will exit the trade, or about how much money may be made or lost. Traders with no pre-determined trading plan are flying by the seat of their pants, and that's usually a recipe for a "crash and burn."
2. Inadequate trading assets or improper money management. It does not take a fortune to trade forex markets with success. Traders with less than $5,000 in their trading accounts can and do trade forex successfully. And, traders with $50,000 or more in their trading accounts can and do lose it all in a heartbeat. Part of trading success boils down to proper money management and not gunning for those highly risky "home-run" type trades that involve too much trading capital at one time.
3. Expectations that are too high, too soon.
Beginning forex traders that expect to quit their "day job" and make a good living trading forex in their first few weeks of trading are usually disappointed. You don't become a successful doctor or lawyer or business owner in the first couple years of the practice. It takes hard work and perseverance to achieve success in any field of endeavor -- and trading forex is no different. Forex trading is not the easy, "get-rich-quick" scheme that a few unsavory characters make it out to be. You must have your own plan and have a precise trading system, then you practice for a few months before you can actually win in trading forex.
4. Failure to use protective stops.
Using protective buy stops or sell stops upon entering a trade provide a trader with a good idea of about how much money he or she is risking on that particular trade, should it turn out to be a loser. Protective stops are a good money-management tool, but are not perfect. There are no perfect money-management tools in forex trading.
5. Lack of "patience" and "discipline."
While these two virtues are over-worked and very often mentioned when determining what unsuccessful traders lack, not many will argue with their merits. Indeed. Don't trade just for the sake of trading or just because you haven't traded for a while. Let those very good trading "set-ups" come to you, and then act upon them in a prudent way. The market will do what the market wants to do -- and nobody can force the market's hand.
6. Trading against the trend--or trying to pick tops and bottoms in markets. It's human nature to want to buy low and sell high (or sell high and buy low for short-side traders). Unfortunately, that's not at all a proven means of making profits in forex trading. Top pickers and bottom-pickers usually are trading against the trend, which is a major mistake.
7. Letting losing positions ride too long.
Most successful traders will not sit on a losing position very long at all. They'll set a tight protective stop, and if it's hit they'll take their losses (usually minimal) and then move on to the next potential trading set up. Traders who sit on a losing trade, "hoping" that the market will soon turn around in their favor, are usually doomed.
8. "Over-trading."
Trading too many markets at one time is a mistake -- especially if you are racking up losses. If trading losses are piling up, it's time to cut back on trading, even though there is the temptation to make more trades to recover the recently lost trading assets. It takes keen focus and concentration to be a successful forex trader. Having "too many irons in the fire" at one time is a mistake.
9. Failure to accept complete responsibility for your own actions. When you have a losing trade or are in a losing streak, don't blame your broker or someone else. You are the one who is responsible for your own success or failure in trading. You make the trading decisions. If you feel you are not in firm control of your own trading, then why do you feel that way? You should make immediate changes that put you in firm control of your own trading destiny.
10. Not getting a bigger-picture perspective on a market.
One can look at a daily bar chart and get a shorter-term perspective on a market trend. But a look at the longer-term weekly or monthly chart for that same market can reveal a completely different perspective. It is prudent to examine longer-term charts, for that bigger-picture perspective, when contemplating a trade.
Support and resistance levels on bar charts are a major component in the study of technical analysis. Many traders, including myself, use support and resistance levels to identify entry and exit points when trading markets. When determining support and resistance levels on charts, one should not overlook the key Fibonacci percentage "retracement" levels. I will detail specific Fibonacci percentages in this feature, but first I think it's important to examine how those numbers were derived, and by whom.
Leonardo Fibonacci da Pisa was a famous 13th century mathematician. He helped introduce European countries to the decimal system, including the positioning of zero as the first digit in the number scale. Fibonacci also discovered a number sequence called "the Fibonacci sequence." That sequence is as follows: 1,1,2,3,5,8,13,21,34 and so on to infinity. Adding the two previous numbers in the sequence comes up with the next number.
Importantly, after the first several numbers in the Fibonacci sequence, the ratio of any number to the next higher number is approximately .618, and the next lower number is 1.618. These two figures (.618 and 1.618) are known as the Golden Ratio or Golden Mean. Its proportions are pleasing to the human eyes and ears. It appears throughout biology, art, music and architecture. Here are just a few examples of shapes that are based on the Golden Ratio: playing cards, sunflowers, snail shells, the galaxies of outer space, hurricanes and even DNA molecules. William Hoffer, in the Smithsonian Magazine, wrote in 1975: "The continual occurrence of Fibonacci numbers and the Golden Spiral in nature explain precisely why the proportion of .618034 to 1 is so pleasing in art. Man can see the image of life in art that is based on the Golden Mean."
I could provide more details about the Fibonacci sequence and the Golden Ratio and Golden Spiral, but space and time here will not permit. However, I do suggest you read the book "Elliott Wave Principle" by Frost and Prechter, published by John Wiley & Sons. Indeed, much of the basis of the Elliott Wave Principle is based upon Fibonacci numbers and the Golden Ratio.
Two Fibonacci technical percentage retracement levels that are most important in market analysis are 38.2% and 62.8%. Most market technicians will track a "retracement" of a price uptrend from its beginning to its most recent peak. Other important retracement prcentages include 75%, 50% and 33%. For example, if a price trend starts at zero, peaks at 100, and then declines to 50, it would be a 50% retracement. The same levels can be applied to a market that is in a downtrend and then experiences an upside "correction."
The element I find most fascinating about Fibonacci numbers, the Golden Ratio and the Elliott Wave principle, as they are applied to technical analysis of markets-
-and the reason I am sharing this information with you--is that these principles are a reflection of human nature and human behavior.
The longer I am in this business and the more I study the behavior of markets, the more I realize human behavior patterns and market price movement patterns are deeply intertwined.
A customer signed up for my service the other day and was asking me about stops and different types of market orders. They were good questions and they reiterated to me the fact that I have subscribers that range from seasoned trading professionals to those testing the forex trading waters for the first time.
One thing I always like to point out to the less-experienced traders: There are no "dumb" questions and there is no shame in being inexperienced. Every single forex trader that ever walked the face of the earth has been inexperienced at one point.
This section on types of market orders, including stops, may be a "refresher" feature for the more experienced traders, and will likely be a more valuable feature for the traders newer to this fascinating field.
Market Order
The market order is the most frequently used forex trading order. It usually assures you of getting a position (a fill). The market order is executed at the best possible price obtainable at the time the order reaches the forex trading pit.
Limit Order
The limit order is an order to buy or sell at a designated price. Limit orders to buy are placed below the market; limit orders to sell are placed above the market. Since the market may never get high enough or low enough to trigger a limit order, a trader may miss getting filled if he or she uses a limit order. Even though you may see the market touch your limit price several times, this does not guarantee a fill at that price.
Stop Orders
Stop orders can be used for three purposes: One, to minimize a loss on a long or short position. Two, to protect a profit on an existing long or short position. Three, to initiate a new long or short position. A buy stop order is placed above the market and a sell stop order is placed below the market. Once the stop price is touched, the order is treated like a market order and will be filled at the best possible price.
Importantly, while stops and MIT's are usually elected only when the specific price is touched, they can be elected when the opening of a market is such that the price is through the stop or MIT limit. In this case, you can routinely expect the fill to be much worse than the original stop or better on the MIT. This applies to stop orders and MIT orders placed before the opening of pit trading.
Stop-Limit Orders
A stop-limit order lists two prices and is an attempt to gain more control over the price at which your stop is filled. The first part of the order is written like the stop order. The second part of the order specifies a limit price. This indicates that once your stop is triggered, you do not wish to be filled beyond the limit price. Care should be taken when considering stop-limit orders--especially when trying to exit a position, because of the possibility of not being filled even though the stop portion of the order is elected. There is no stop-limit order without a second price. If your order cannot be filled by the floor broker immediately at the stop price, it becomes a straight limit order at the stop price.
Specify a time for your limit and market orders to go live.
Example: If you wanted to place a buy order based on the release of some news event. Specify the order parameters as you would, check the time parameter box and enter your specified time.
Trailing Stop
Ride a currency's price trend, profit from its movement, and limit your downside risk without constantly monitoring prices. Trailing stops move your stop price with the price of the currency and are server-sided, protecting you in the event you lose Internet connection.
When using the trailing stop, it is important to know the answer to the question: How do you represent a pip per currency pair? A pip is the last digit to the right of the decimal point in the current currency dealing rate.
Example #1: EUR/USD 1 pip = .0001
Example #2: USD/JPY 1 pip = .01
Example: It is very important to know how to represent 1 pip in each of the currency pairs traded when submitting a trailing stop order. If we are long the EUR/USD at a basis of 1.1888, we want to place a trailing stop by trailing the bid price by 12 pips. This trail offset for the EUR/USD is written as .0012. In contrast the same trail for the USD/JPY would be written as .12 as the trail offset. If we buy from the ask and sell to the bid, then when we are long our stop price would be set to 12 pips below the current bid at the time of submitting the order. If the bid price is 1.1887, then our initial stop price would be set to 1.1875. If the bid price increased to 1.1902, then our new stop price would be set to 1.1890. With this being said, please note that our trailing stops update based on a pip by pip movement. If the bid did move up to 1.1902, then immediately pulled back to 1.1890, the order would go live and sell at market.
Threshold Triggered Order (TTO)
Specify two prices, an upper and lower price trigger. Once the market trades at either price, a market order is sent to the marketplace. This order type was designed to help limit potential losses and lock-in potential profits. Additional Explanation: Many Forex traders want to place one price trigger to take profits and one to stop out of their position at the same time, and they want whichever order is executed first to cancel the other part of the order automatically. The best order type to accommodate this strategy is the TTO. This order type allows you to set both an upper and lower price trigger. The system will send out a market order for whichever price trigger is met first.
"Combo" Order Types
A combo order involves a combination of two different order types. Whatever the action of the first part of the combo order is (either buy or sell), the trading system will send out an opposite order when the first part receives an execution. If we place a buy Market + TTO, the system will send out a market order to buy, and upon execution of that buy market order the system will send out an auto-closing sell TTO. This explanation would be the exact opposite for a sell market + TTO, first part of the order is a sell, the second part is the buy (to cover).
Limit + TTO
This combo order type will initially place a limit order (either a buy or sell) and upon execution, places an opposite TTO (either a buy or sell). Note: Upon execution of any part of the initial limit order, an equal TTO is placed with your pre-set trigger prices. Please keep in mind that when the system sends out an equal TTO, you have to cancel and replace the TTO to change either the upper or lower trigger. With this being said, it is important to know how to place a stand-alone TTO (explained in the TTO section above).
Limit + Trailing Stop
Initially places a limit order on one side (either a buy or sell) and upon execution, places an opposite trailing stop on the other side (either a buy or sell). Note: Upon execution of any part of the initial limit order, an equal trailing stop is placed with your pre-set offset.
Note: It is very important that you understand how to represent the number of pips for your trailing offset for your trailing stop order when placing the trailing stop order. (See Trailing Stop order type explanation)
Limit + Stop Market
Initially places a limit order on one side (either a buy or sell) and upon execution, places an opposite stop market order for the other side (either a buy or sell).
Market + TTO
Initially places a market order (either a buy or sell) and upon execution, places an opposite TTO (either a buy or sell). Note: Upon execution of any part of the initial market order, an equal TTO is placed with your pre-set stop prices. To change either of your TTO price trigger parameters you must cancel and replace the order. Either the bid or ask price can trigger your upper and lower price triggers. At the time the trigger is met the system sends out a market order.
Market + Trailing Stop
Initially places a market order (either a buy or sell) and upon execution, places an opposite trailing stop (either a buy or sell). Note: Upon execution of any part of the initial market order, an equal trailing stop is placed with your pre-set offset. You must know how to represent the number of pips of your trail offset per currency pair.
Stop Limit + TTO
Initially places a stop limit order (either a buy or sell), which works like a Stop Market order with one major exception. Once the order is activated (by the currency trading at or through the stop price), it does not become a market order. Instead, it becomes a limit order with a specified limit price. Your order fill price will be either at your specified limit price or better. Upon execution of the first part of the combo order, the system will place an opposite TTO (either a buy or sell). To change either of your TTO price trigger parameters you must cancel and replace the order. Note: Either the bid or ask price can trigger your upper and lower price triggers. At the time the trigger is met the system sends out a market order.
Stop + TTO
Initially places a stop market order (either a buy or sell) and upon execution, places an opposite TTO (either a buy or sell). Note: Upon execution of any part of the initial stop order, an equal TTO is placed with your pre-set stop prices. To change either the upper or lower trigger you must cancel and replace the TTO. To change either of your TTO price trigger parameters you must cancel and replace the order. Note: Either the bid or ask price can trigger your upper and lower price triggers. At the time the trigger is met the system sends out a market order.
Stop + Trailing Stop
Initially places a Stop Market order (either a buy or sell) and upon execution, places an opposite Trailing Stop order (either a buy or sell). Note: You must know how to represent the number of pips of your "trail offset" per currency pair. At the time you place a buy Stop + Trailing stop you would enter your desired stop price to enter the position. When this buy stop price is reached by the market (in this case the ask) a market order to buy will be triggered. Upon execution of this first part of the combo order the system will send out an auto-closing trailing stop (reflecting the trailing offset you selected when first placing the order).
To be successful in forex trading, following the trend perhaps would be among the most popular skills that a trader must master. However this section won’t discuss about trending, but discuss about its opposite. History shows that most markets tend to move in a non-trending, or "sideways" fashion more of the time than they are in a trending mode. So how to trade in non-trending markets. The most popular answer would be "swing trading."
The key point for swing trading is finding a market that is trapped in a sideways trading range (also called a congestion area), or in an up-trending or down-trending channel on the chart (remember, channel!). When observing from the chart, the trader must be able to distinguish some clear support and resistance levels that are boundaries of the congestion area or channel. When a market price comes close to the support or resistance area boundary, the trader will establish a position: long if prices are moving lower and close to the support boundary, and short if prices are moving higher and toward the resistance boundary. It sounds simple, but remember, trading contains a lot of surprises. The price might break out the support or resistance boundary anytime, therefore skills to response quick, or good money management strategies are always critical characteristics of a seasoned trader.
Swing trading techniques can be used in any chart time frame -- daily, weekly, monthly and intra-day charts. Nevertheless, the most popular timeframe for swing trading is the daily bar chart.
Note that the strength of the support and resistance at the boundaries is usually determined by the number of times the market has pivoted at the boundaries. The rule is that the more times a market has reached a support or resistance boundary, and then reversed course, the more powerful is that boundary. It can also be said that the longer continues a channel, the more reliable is that channel. Thus, a trader wants to find a well-established channel or trading range for which to attempt to swing trade.
An exception to this is a market that has been in a trading range, but is bound by one or two powerful spike moves, which also indicate a strong support or resistance boundary. That means some congestion areas that may offer a good swing-trade opportunity do not require several pivot points. In fact, those one or two spike levels would be determined to be a potentially good pivot area for a market.
The swing trader should still use tight protective stops. As I mentioned, a breakout can occur anytime, might due to bad political news etc…Good money management strategies will keep traders out of problems. A good area to place a protective stop is just outside of a support or resistance boundary that makes up the trading channel or congestion area. For instance, if a market in a trading channel is nearing the upper boundary of that channel, the swing trader would establish a short position and would want to place his protective buy stop just above the resistance level that serves as the upper boundary of the trading channel. Interestingly, if the market keeps moving higher and breaks out above the channel, or congestion area, (stopping the swing trader out of the market) then that would likely be considered an upside "breakout," which is a favorite trading set-up among many veteran position traders. This set-up would suggest establishing a long position if there was good follow-through buying strength the following session after the upside breakout from the congestion area or channel. The trader establishing the long position would place his protective sell stop just below the former upper boundary of the trading channel or congestion area that was just penetrated on the upside.
A trending market refers to the presence of a strong price trend. During a period of time when the market is in a strong trend there are a number of adaptations that technical analysts have to make in order to make allowances for changes in the way indicators and technical tools act. Technical tools like the Stochastic Oscillator which range from over bought to oversold territory will not provide much evidence of a trending market. We can use some other technical tools or chart techniques to identify the buy/sell signal. Remember, trading in trending market is about finding out the best tools to identify the trend(buy/sell signal) and ride the trend until reversed.
Here I am explaining some examples of how we can trade in trending market:Example 1: Using Candlestick Patterns To Identify Entry Points In Trending Markets
Candlestick patterns, combined with support & resistance, trendlines or other technical analysis tools can be very powerful in finding possible market entry and exit points more quickly and with a higher degree of reliability. The great thing about candlesticks patterns is that they can be applied to pretty much all time frames and in both trending and range bound markets.
Now, let's take a look how to identify possible entry points using candlestick patterns in trending markets:
Identify the overall trend drawing a trendline
For an up trendline to be drawn, connect the low points the currency pair hits as its price continues to rise. For a down trendline to be drawn, connect the high points the currency pair hits as its price continues to fall.
How to find an entry point to go short (again) in this down trending market?
1) Look for a retracement
2) Look for a candlestick pattern to confirm a possible reversal at or near the falling trendline:
Looking to the above chart:
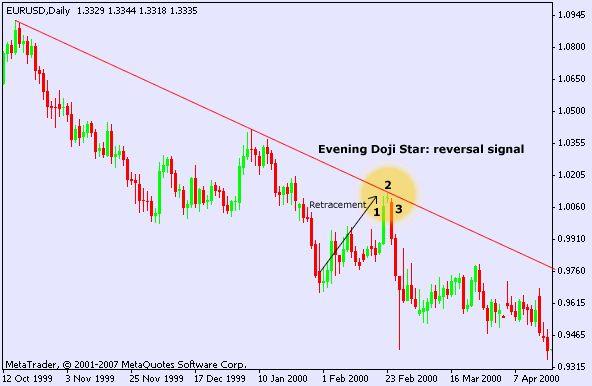 We identify an Evening Doji Star candlestick near the falling trendline which indicates a bearish reversal signal in it's upwards retracement.
 How to trade this bearish pattern?
We go short at the close of candle 3 with a stop 1 pip above the high of candle
Example 2: Using The Percent “R” Indicator: How To Make It Work For You
The Percent Range (%R) technical indicator was developed by renowned author and trader Larry Williams. This system attempts to measure overbought and oversold market conditions. The %R always falls between a value of 100 and 0. There are two horizontal lines in the study that represent the 20% and 80% overbought and oversold levels.
In his original work, Williams' method focused on 10 trading days to determine a market's trading range. Once the 10-day trading range was determined, he calculated where the current day’s closing price fell within that range.
The %R study is similar to the Stochastic indicator, except that the Stochastic has internal smoothing and that the %R is plotted on an upside-down scale, with 0 at the top and 100 at the bottom. The %R oscillates between 0 and 100%. A value of 0% shows that the closing price is the same as the period high. Conversely, a value of 100% shows that the closing price is identical to the period low. The Williams %R indicator is designed to show the difference between the period high and today's closing price with the trading range of the specified period. The indicator therefore shows the relative situation of the closing price within the observation period.
Williams %R values are reversed from other studies, especially if you use the Relative Strength Index (RSI) as a trading tool. The %R works best in trending markets. Likewise, it is not uncommon for divergence to occur between the %R and the market. It is just another hint of the market’s condition.
On specifying the length of the interval for the Williams %R study, some technicians prefer to use a value that corresponds to one-half of the normal cycle length. If you specify a small value for the length of the trading range, the study is quite volatile. Conversely, a large value smoothes the %R, and it generates fewer trading signals. Some computer trading programs use a default period of 14 bars. Importantly, if an overbought/oversold indicator, such as Stochastics or Williams %R, shows an overbought level, the best action is to wait for the forex contract’s price to turn down before selling.
Selling just because the contract seems to be overbought (or buying just because it is oversold) may take a trader out of the particular market long before the price falls (or rises), because overbought/oversold indicators can remain in an overbought/oversold condition for a long time--even though the contract’s prices continue to rise or fall. Therefore, one may want to use another technical indicator in conjunction with the %R, such as the Moving Average Convergence Divergence (MACD).
The trading rules are simple. You sell when %R reaches 20% or lower (the market is overbought) and buy when it reaches 80% or higher (the market is oversold). However, as with all overbought/oversold indicators, it is wise to wait for the indicator price to change direction before initiating any trade.
Larry Williams defines the following trading rules for his %R: Buy when %R reaches 100%, and five trading days have passed since 100% was last reached, and after which the %R again falls below 85/95%. Sell when %R reaches 0%, and five trading days have passed since 0% was last reached, and after which the Williams %R again rises to about 15/5%.
Like most other "secondary" tools in my Trading Toolbox, I use the Williams %R indicator in conjunction with other technical indicators -- and not as a "primary" trading tool or as a stand-alone trading system. <

Reads:
47
Pages:
23
Published:
Sep 2025
Enhance Your Financial Intelligence is your step-by-step guide to understanding, managing, and multiplying money with confidence. In a world where financial s...
Formats: PDF, Epub, Kindle, TXT

Reads:
12
Pages:
47
Published:
Jul 2025
The Digital Revolution: Central Bank Digital Currencies (CBDC) Unveiled explores the transformative impact of CBDCs on global financial systems. Written by sc...
Formats: PDF, Epub, Kindle, TXT

Reads:
26
Pages:
88
Published:
Apr 2023
Ce livre a pour objectif d’analyser l’impact des services financiers de proximité sur l’évolution des capacités réelles d’actions des femmes rurales. Des pers...
Formats: PDF, Epub, Kindle, TXT

Reads:
197
Pages:
41
Published:
Feb 2023
This eBook is a summary of a new and unique trading method.
Formats: PDF, Epub, Kindle, TXT
Describe what you're looking for in as much detail as you'd like.
Our AI reads your request and finds the best matching books for you.
Popular searches:
Join 2.9 million readers and get unlimited free ebooks