In our work for a better economy we need to look more closely at government spending and sources of revenue, Social Security and health care. Using 2007 IRS data ( http://www.nber.org/palmdata/indicators/personal.html#Totalpersonalincome) I’ve created a pie chart showing the sum of all income for 2007 in the figure below.
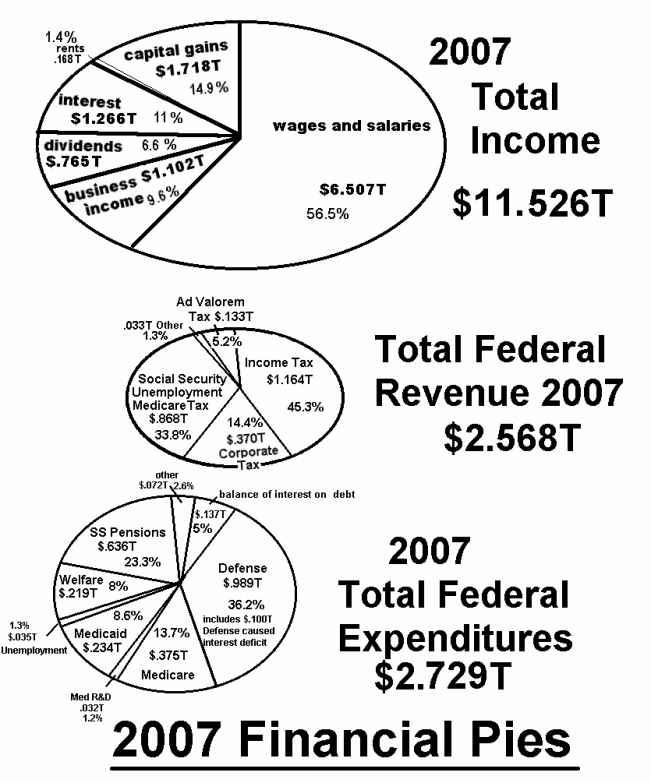
I believe that this IRS data is the best for using real numbers. I also show government tax revenues and real expenditures for the same year 2007. I break this data down and develop the pies in Appendix 1, item 3.
The lower pie in the above trio shows federal government spending for 2007. The data, developed in Appendix 1 section 3, shows a large preponderance of defense spending
http://en.wikipedia.org/wiki/List_of_countries_by_military_expenditures
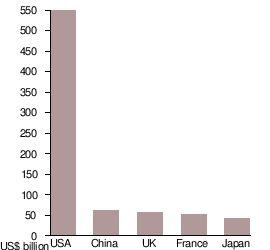
By far the US spends more than the sum of the rest of the world’s defense budgets for defense. This is Empire size defense spending and not sovereign nation size spending. The top 5 are shown above. The reason that the US government is involved militarily in 130 nations of the world is that private US business interests have struck deals with these nations that help the US in its business endeavors around the globe to facilitate us being the world’s biggest consumer nation. So the defense department of the US government is in bed with private business interests (and has been since World War II). The good economy of the 50s thru the mid 70s was in response to a huge number of combat trained U.S. veterans coming home to join a new peacetime economy. A lot of money was made by U.S. contractors during the war, money that funded the capital development of the new economy. So it was like a celebration for many Americans. African Americans had experienced good treatment from people overseas and didn’t want to return to Jim Crow. They fought and died to restore first class citizenship to foreigners abroad, and understandably didn’t want to return to a second class citizenship in their own country. Unrest and continued abuse of rights led to the civil rights movement of the 50s & 60s which continues to this day. The most horrifically affected by our one sided economy is still Black America. Conservative ideologies do not seem to exclude racism. Maybe they should be called by what they do conserve, “conservaturds.” Now liberals that want anarchy are really “libe- rats”, in my opinion. So you have your good and your bad on both sides of conservative and liberal. What I’d like to see is “conservagoods” and “liberights” working together for a revised “economax” and “Goodvernment”. That’s what I’m proposing.
Our first step with Goodvernment is to stop the war, bring the troops home, and stop incurring debt. Eliminate Homeland security and transfer its best 5% “think on your feet” people to the Immigration and Naturalization Service (INS). Bring a staff of Coast Guard thinkers and doers into INS as well. Cut the CIA down to eyes and ears functions (cut 90%), and secure our borders. Of those whom are kept, exchange personnel amongst the intelligence communities at mid and upper management levels to foster better understanding, cooperation, and sharing of information. Cut the rest of the government in half (except national park service and FBI), and phase the people into the private economy with a trickle down on their government pay as with CIA and Homeland layoffs. Cut contract mercenary soldiers out altogether and pare down developments and procurements of arms to meet a new defense missions. Reduce force sizes to less than 50% of the current levels and store/scrap/destroy the weapon systems. Civil Service employees (both federal and state) need a new pension system that is more austere and do-able. I’d say have them serve 30 years & retire closer to 60-65yrs old and be capped at $30-40K for adequate care in their old age, not the “life of Riley” care starting at age 55. Give temporary promotions above GS-12 for general service employees as discussed earlier. Remove all big industry people in government that function for the corporatocracy. Balance the federal budget and then create a surplus with which to pay down the national debt. Make the number add up.
As mentioned above, our foreign policy has been closely aligned with private industry operations around the world, and our military is stationed all around the world in support of this function. We need to retreat from imperialism and ramp up solar, wind, and other green technologies at home. We need to move into our cities and revitalize them for shorter commutes and get away from suburbia thinking to lower the average commute and create and/or maintain farmland. We need to use more small scale diversified sustainable farming, and get away from large scale risky, genetically altered crops and animals. A 10% cut in housing costs could fund a 20-30% increase in food costs in our budgets to better sustain the small farmer, as some increases in organic food costs would be expected to entice people back into family farming.
Here’s the defense budget and proposed changes over 1-2 years.defense item basic
war
Homeland intel
aid & space DOD civ 55 27 VA med, disabil, educ 72 72 mil retirement
DOD civ retirement
DOD share of debt interest from past overages 100 handle outside of DOD
43 2 to INS 8 (+32)
9 4 (no foreign mil aid)
Other budget alterations are recommended (plus a change in the tax structure) in three key areas: Social Security, Medicare/Medicaid, health care in general. Let’s look at Social Security.
One reduction of SS that comes to mine is that recipients at or over the 95% of income do not need it and should not burden the system. From the 90-95% there should be a tapering off. Appendix 1 section 9 develops the data of how much this represents. The top 10% get 21.5% of SS receipts or, for a 710B total SS benefit, 153B. They also get about 40% of the medicare benefit as there is no incentive to keep them from overusing the system. So I propose to limit both SS and Medicare to those who don’t need it and cut back the overall cost for those who do need it. With fraud reduction and a cut back on procedures I expect to lower government sponsored health care by 22%. The Medicare share would then be .78(450B) = 351B. The next figure shows these proposed changes.
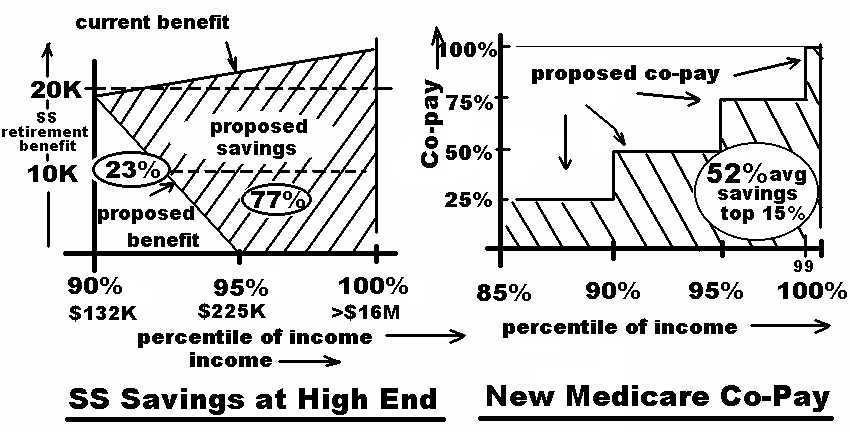
The Medicare reduction is in the copay for services. Using the split in services identified in Appendix 1, section 9, the 80-90% group uses 19% of the $351B benefit or 67B for one 10% population group that it represents. So the above diagram shows a co-pay of 25% of half this region from 85% to 90% or .25 X
To finance $(710-118)= 592 billion of Social Security pension money, one might try a 1/3, 2/3 split between business and workers, rather than ½ and ½. This gives business a boost and helps make it slightly easier to make payroll. So business would provide $197B. This would be equivalent to about 4% of wages. The remaining $395B would be a flat tax against all income above the median of $33K shown as the 50% point in the total income curve of Appendix 1 section 4. Since the lower 50% in that curve earn a total of $1.04T and the total income for all
combined total income of $6T or $235B, (their share of total income in the top 50%, 6/10.1 X395B(two thirds of total paid by all workers)), but by the new system, they would receive .21X.23X592 = $29B (where 21% is their normal share (from App.1 section 9)), but, by my plan, recipients in the 90-100 range only receive 23% of that as they are tapered off from 90-95%) or $29B in benefits, so their charity is 235-29= 206B or 3.4% of $6T income, which is partially offset on the business ownership side where total cost went down and from Wolf’s tables, . 93 of that savings would go to the upper 10%. The difference between the 206B extra liability and the tax savings would be the net affect on the upper 10%.
For Medicare, Medicaid and CHIP (Children’s Health Insurance Program)$740B is listed http://en.wikipedia.org/wiki/2010_United_States_federal_budget. I really think that Medicare should be reduced some amount for fraud, with the simple installation of fraud detection, and an additional 20% for reductions in hospital and doctor charges for overdoing tests and follow-up visits and over billing. I’d settle at 22% reduction of the Medicare portion of 450B, making Medicare .78(450B) = 351B as mentioned above before the co-payment savings is considered. Medicaid and CHIPS should take some part of these hits, currently at 740-450=290B, maybe a reduction to 225B. So the three medical services would come up to 276+225= about 500B for Medicare, Medicaid, and CHIPs, $276B of which is Medicare. If 2/3rds of this Medicare comes out of the total income of the top 50% then a tax rate of 1.8% on total income of the top 50% would be required. So in this
Medicare, and this amounts to 395 + 167 = $562B. The business share of Medicare would be 1/3X276B or 92B, and the SS share 197B, or 290B for a savings of 400B – 290B = 110B
The medical profession should not be carrying so many specialists who get too much money for too little work. A board of physicians should publish work/rest guidelines for different surgical teams/office procedures. Hospital management representatives could provide data on operating room use and prorated cost of space and supplies. Charges should not be made for lack of occupancy or lack of use. My intuition finds it hard to justify $50-100K type procedures, unless they’re covering a lot of downtime. Maybe $8K/day for the top guy, 2K apiece for a couple of good specialists, maybe 3K for assistants, 2K for use of the operating room (maybe it’s used twice a day), and 2K for supplies and use of tools and equipment, for $19K and 5days in the hospital for another 5K. So a huge $24K operation becomes? $50K?, $100K? to cover downtime (of facility or doctor).
The profession needs a well coordinated and responsive queuing system . If people schedule their good doctor so that he’s never available except through his company’s queue, then he would not be part of any general queue. But physicians who are not booked enough could be handled in a queuing system where they respond within a certain radius for a procedure if they can make an opening. Being flexible to being able to go where the need is through use of a queue, can save on facility and space costs and up percentage of billable time. Maybe some small pay would be given for just being available that day (sort of on alert) and in the queue for use. The bigger part would be the pay rate when actually working. Somebody must have already looked at this for use in health care. Some balance between density of facilities and mobility of health care providers for best overall performance (quality/cost).
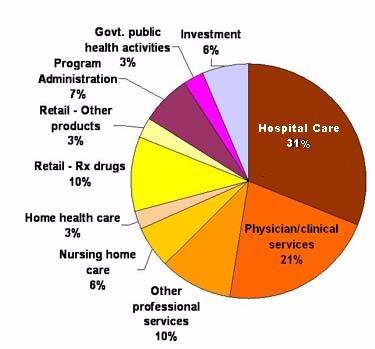
The whole system of health care has a large number of variables to consider. Let’s start at the top. The total budget for health care in 2007 was $2.241T. It was paid by the government $1.03T, 46%; industry, $874B- $262B = $612B, 27%; and directly by users, 262B+364B =$626B, 27% (through insurance companies or otherwise).
The average employer-sponsored premium for a family of four costs close to $13,000 a year, and the employee foots about 30 percent of this cost. That part was deducted from their pay and sent in by their company ($262B), but should be listed as a people paid expense, as shown in the above split. 67M employees could be covered with a family plan of 13K for 874B.
National health expenditures are expected to increase faster than the growth in
Gross Domestic Product (GDP) between 2008 and 2018, the average increase in national health expenditures is expected to be 6.2 percent per year, while the GDP is expected to increase only 4.1 percent per year. This produces a 22% net increase in health costs with respect to the GDP growth over the same 10 year interval (ratio of compounded growth of each) = (1.062) 10/ (1.041)10= 1.22, or a 22% increase of the top unit over the bottom unit over 10 years compounded. The graphs show the cost of health care going up by a factor of 9 = 2.2/.25 (1980 - 2007) while the overall inflation rate was 2.1 = 2.1/1 (1983 - 2008). The totally adjusted increase in health care costs in the family budget is 9/2.1= 4.2 , or about a factor of 4.
It is estimated that health care costs for long term care and chronic disease treatment account for over 75% of national health expenditures. For those already suffering from chronic diseases, disease management strives to improve and streamline the treatment regimen for common, chronic health conditions, like diabetes, cardiovascular disease, and cancer, which are correlated with obesity, smoking, diet, and exercise and are very expensive to treat over long periods of time. If smokers were made to be in an insurance pool made up of only their own kind then premiums and out of pocket care for them would go up as is appropriate for the condition they bring upon themselves. Their incentives to quit would dramatically increase. By my calculations from Appendix 1 section 10, the smoker would pay out of pocket $2,546./yr more than in the current system, the company would send in the same 874B but keep the savings of $39.3B. By keeping them in the bigger group we are enabling their smoking and should stop doing that. Let them experience the natural consequence of their own behavior. I suggest the average 27% increase in the relative premium of smoker to non-smoker to achieve this, as suggested in Appendix 1 section 10, so that their premiums are directly proportional to their health care, with the same proportionality as nonsmokers have to their health care at any given age.
In addition some experts estimate that up to 30% of health care is unnecessary, emphasizing the need to streamline the health system and eliminate this needless spending. The current system of provider compensation pays physicians a given fee per procedure or test, for example as dictated by the Medicare Physician Fee Schedule guidelines for the value of over 10,000 physician services. Currently, there are proposals to revamp some provider payments to ensure that fees paid to physicians reward value and health outcomes, rather than volume of care. This is meant to eliminate unnecessary care and thereby decrease costs. I have one blatant personal example: Last year I had an angiogram following an emergency trip to the hospital because I was suffering from fairly high levels of chest pain and had a 13 year history of heart disease. Three to four doses of nitro glycerin in the ambulance failed to alleviate my discomfort. No heart attack was detected, so I was dismissed; but it cost $5K occupying a bed in emergency for several hours and took 2 months to coordinate my “heart” problem through my GP and Cardiologist and wait the queue time for the catheter lab with several lesser bouts of my problem that were scary. If they’d only given me some antacid treatment in the emergency room (since 4 doses of nitro didn’t ease constrictions? of blood flow? in the heart?, suggesting no heart problem), during my time there or in my doctors office within the week, my new gastric problem would have been diagnosed and handled for $20 in a day while I was waiting for doctor screening and the catheterization procedure (which would have been cancelled, saving an additional $10,000). Instead they trusted my feelings and not their science and did blood tests and x-rays and later did the cath lab, then asked me to try over the counter antacids, which worked. It should be a required screening for heart patients not handled immediately on an emergency basis to be screened for stomach acid /reflux problems. And if they don’t respond to 3 doses of nitro, then right then and there, try antacids. Is there a problem with that?
It would be nice if doctors would just rethink treatment sequences for the symptoms they find in order to follow good economy for the patient, concurrent with good quality of service. But the increase in specialized medicine in the last 30 years with huge increases in doctors’ earnings and procedures with the fee schedule type service, seems to stress the money incentive in medicine while making the costs rise. And it is also rumored that surgery is way overdone (for the income it creates for doctors?). I would think that doctors services could be sequenced to cut 20% out of their part of the pie. I think we need fewer physicians working more and a queuing system to cut down on capital expenditures for clinics, while cycling doctors to the ones in use in their area to fill out the doctor’s time to the income level he desires while helping the facility to have a higher use rate. Maybe we shoot for 80B savings and get $60B. The drug companies should save 20% by cutting back advertising and doing co- research.
The legal profession just makes it worse. 2-3% of the health care budget (which would represent 10-15% of the doctors slice of the pie), seems to be an upper boundary for mal practice insurance. That would be $47-70B for malpractice. http://voices.washingtonpost.com/ezra-klein/2009/09/medical_mapractice_costs.html
You better believe that that would make a doctor reasonably defensive about his practice, and more cautious and conservative treatment would inevitably result. Attorneys squawk at the loss of business with arbitration as they’d rather see doctors buying expensive mal-practice insurance and facing outrageous claims in court. Even if arbitration was forced and limits set in any court cases, you better believe that the shark tank of attorneys would not let things lie. They feed on money in court, which they gobble voraciously, and they’ll push hard to continue feeding at the blood bath. I would suggest a federal limit on wrong death suits, like $2M. I would support arbitration and get the blood suckers out of the loop. We could save $40B. This would work well with the reduction in services savings mentioned above. The attendant savings in Hospitals, if a few are shut down to keep all of the remaining closer to full production, with no overcharging, and fewer operations were done could be a try for 120B, with an actual savings of $90B for hospitals.
In medicine research continues and new treatments evolve that continue to save and extend lives. At some point (already here) the expense of procedures will limit who may receive them in our society. We cannot guarantee all Americans that they will get the best and perhaps most expensive treatments in a timely fashion all the time. If medicine is provided on a fee basis, there needs to be a limit, where only out of pocket allows for more treatment at the discretion of the patient. Maybe the patient’s share graduates up slowly and is dependent upon income. While I agree that every American deserves good medical care, I do not believe that it is possible for all Americans to get the best health care available (even when it’s available). As I said, in consideration of the economy, a public health policy might be somewhat limited in treatments approved. Whether or not medicine progressed anymore, and it will, doctors will continue to be faced with life and death options to discuss with their patients/families. This is and will continue to be part of their business.
This does not mean that the government limits the medical service that anot a procedure may be done in consideration of all the variables in the patient’s life. If no significant quality or extent of life is available, it doesn’t make much sense to me to have my body run by machines at any cost, when I would otherwise die naturally. So the fear that some status quo supporters are spreading in the media about government death panels deciding your fate is a lie. What really happens is that some hospitals (private industry) may taxi a patient to a care center because they need another bed, or private insurance companies suspend policies for not dotting an “i”, and people die as a result. Although I understand the Obama health care plan eliminated this.
Accumulated Medical Debt
With each passing year, families face increasing deductibles, co-payments, and other out-of-pocket expenses, requiring them to make difficult decisions in order to make ends meet. In fact, one survey estimated that 72 million, or 41 percent, of non-elderly adults have accumulated medical debt or had difficulty paying medical bills in the past year. A full 61 percent of those with difficulty had insurance. (www.healthreform.gov/reports/out_of_pocket/index.html)
Bankruptcy
A study, published in the journal Health Affairs, estimated that medical bankruptcies affect about 2 million Americans every year, including about 700,000 children. This represents about half the bankruptcies filed.
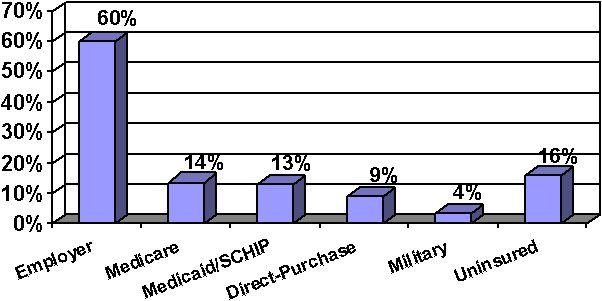
The bar chart at left shows the source of medical coverage for our population in 2004 of 291 million people. (U.S. Department of Health and Human Services). The total uninsured was 46 million; insured, 245million. 46 equals 16 percent of the total
population of 286 million. Today’s numbers would be similar. The next chart shows 25% of the uninsured are in the poverty

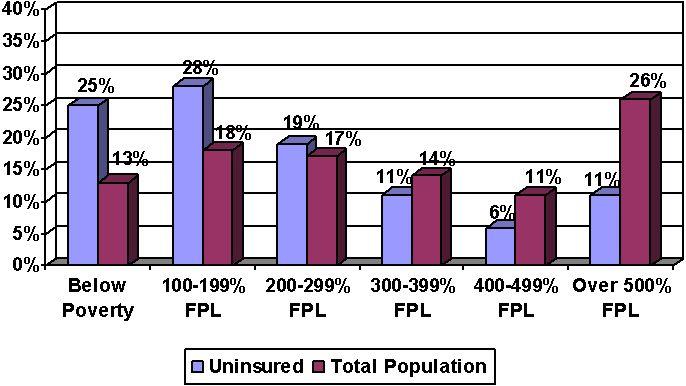
range level of income at the left end of the bar chart, but only 13% in that range of income are uninsured, probably because they are covered by the government or their employer. The numbers would be .25(46M) = 12Million uninsured in the below poverty level of income, out of a group of 12M/.13 = 92 million in this income range. So the blue shows the percent of all uninsured (in the pay range shown), and the red shows the percent of people in the pay range shown that are uninsured. While in total numbers there are more poor people uninsured, there are significant percentages of people within higher pay ranges that choose to be uninsured (because they don’t get insurance with the job automatically and they want to gamble that they will pay less in out of pocket for medical service per year than the annual sum of insurance premiums). Or they’re young adults and can’t get it or can’t afford it, or some other reason. The uninsured in the 300% and up range in the above bar chart are not disadvantaged people who need help getting medical insurance; i.e. there are 13Million high paid uninsured workers. If they are subtracted from the total uninsured, then 33Million are without insurance and are more needy.
While the very poor qualify for government provided health care (Medicare and Medicaid) there is a group of at least 8 million Americans who make too much to qualify for government assistance, but not enough to buy the smallest commercially available health policies. In addition about 4 million Americans have lost their health coverage since 1-1-08 due to loss of job (or denial by the insurance companies?). Bureau of Labor Statistics BLS: In September, 2009, said 8.5 million Americans were unemployed. So, maybe 17 million Americans are chronically without health care into the unforeseen future. This might be a number respected by conservatives. But BLS published access and take-up rates for medical insurance available through private industry say otherwise. 71% qualified, 53% took it. So 29% of workers in US industry do not even qualify for work sponsored health care. That would have to be in excess of 40M workers out of a force of 140M. Now, maybe all 40M qualify for government assistance. I don’t know. But I do know that if one tries to budget a family health plan into the family budget (which plans average $13,000/yr) about 65% of American families cannot afford it. So they get public assistance or it’s paid for on the job, or they don’t have it. Now the $874B paid to insurance companies from industry at 13K/yr would cover 67M employees with family policies. That would be the 53% of the force that took it up, meaning 67M/.53 - 67 = about 60M families of industry are without. 40M of those don’t qualify and the other 20M would rather gamble that their out of pocket on medical will be less than 30% of $13K or less than about $4000, because they can use that 4K, and don’t want it taken out of their salary. These people are at risk. So are the unemployed. So by my estimate about 29M families (9M unempl + 20M above) do not have health insurance for economic reasons. The $234B of Medicaid go to low-income adults under age 65, a group numbering more than 50 million people. The aid per person would get http://www.kff.org/healthreform/7914.cfm $234B/50M = $4.7K on the average.
According to the Institute of Medicine of the National Academy of Sciences, the United States is the "only wealthy, industrialized nation that does not ensure that all citizens have coverage" (i.e. some kind of insurance). The same Institute of Medicine report notes that "Lack of health insurance causes roughly 18,000 unnecessary deaths every year in the United States." A 2009 Harvard study says 45,000. A lack of medical care altogether (1997) caused about 100,000. deaths.
% population .1% avg .9% 90% 75% 50% 25% 0
Income/wages $174K $174K $98.2K 63.5K 32.9K 15K 0
extra income $9.3M $930K $34.2K 8 K 0 0 0
Fed income tax -$1.73M -$178K -$11.9K -4.9K -2.3K 0 0
Credit card Int. -$2.4K -$2.4K -$2.2K -1.7K -.57K 0 0
SS/Medicare tax -$9.6K -$8.8K -$7.5K -4.9K -2.5K -1.1K 0
Net Income $7.732M $915K $111K $60K $27.5K $14K 0
Describe what you're looking for in as much detail as you'd like.
Our AI reads your request and finds the best matching books for you.
Popular searches:
Join 2.9 million readers and get unlimited free ebooks