Capitalism and Plight of the American Family
To get a good understanding of the economy we want to know how the economy functions and where the income goes and how much. We want to know who pays the taxes and how much. We’d like to know where and how much is the discretionary income amongst Americans and where income is lacking. Into this discussion enters government spending and deficits and debts. Is any type of government spending more productive for the economy than any other? Are tax rates set up reasonably? Is the free market really free or a play ground for the rich to manipulate markets with power and money? Does Capitalism need to be adjusted with guidelines and regulations to stabilize it and keep everyone fed and clothed and housed? Not that I have any power to affect change, I’d still like to understand the mechanisms in our economy.
After World War II the nation went back to a peace time economy and it surged forward with gusto. Suburbia was born. And things were good. We even led in the reconstruction of Europe (the Marshall Plan). Wartime was not productive in producing the fun things of common life. The auto industries pretty much stopped manufacturing new cars and instead built tanks. There was a shortage of everything: gasoline, rubber, metal, tin cans, sugar. The shortage in war labor was made up by women, who joined the working world of industry in droves. But the economy didn’t directly do anything for the public in the way of peacetime products or services which directly enhance normal living during the war. Instead spending was increased to cover the war machine and people involved.
So after the war the conversion of the military ranks into a civilian work force with an attendant change of products in industry plus the marriage and family boom, and the housing boom, the economy took off. New cars were in production again. There was severance pay for many GIs to spend on the economy. Companies that helped the war effort did real well and could hire all kinds of help for their new peacetime production industries. Construction work was up. In the 50s President Eisenhower initiated an interstate highway system to link the country and facilitate interstate commerce. This created a lot of jobs. America’s market was mobile. A bonus out of this growth was the family vacation on the road with visits to national parks and other beautiful sites. The new work force bought new cars and trailers and roamed the highways during the 50s and 60s. The attendance at parks went from a few hundred thousand to over 10 million in a few short years. Plastics became big. The economy was booming with expansion everywhere.
Then came more war: the Korean war and the war in Viet Nam. The greatest beneficiaries were the war industries: defense plants, development companies, arms manufacturers, oil, and banking. All benefited from the war process, and benefited tremendously. President Kennedy; however, became an obstacle to the Viet Nam war and to the continuing profit of the war industries. He had signed an executive order to bring home all 15,000 troops by the end of 1965 with an initial installment of 1000 in December, 1963. His executive order to remove all American troops from Viet Nam had just gone into action when he was killed.
He was also going to cut back the CIA, who had incessantly interfered with his foreign policy by conducting covert military ops within Viet Nam to push the South into a war with the North ; Cuba, to sabotage industrial and military targets of the Castro regime, and projects elsewhere. He had started a peaceful process with the Soviet Union to put a ban on testing nuclear weapons, and he wanted peaceful coexistence with the Soviet Union as he outlined in his Graduation speech at American University in June of 1963.
He had also changed his position and was going to cut oil depletion allowances which gave the oil industry untaxed profits in the 100s of millions that other companies did not get. It’s like a condolence bonus for the loss of the oil that the oil companies sell. You’d think that the US felt sorry for the biggest and richest companies in America and let’s them take the first 27% of their sales profit tax free each year while other companies pay tax on every dollar of profit. This remained for 40 some odd years due to back room politics.
And Kennedy was also in favor of civil rights and space travel as part of the new generation of Americans under him. So he was killed for big business, war business. There is a distinct possibility that the cold war of arms build up and nuclear stockpiling would not have happened if he had been allowed to pursue a course of world peace. It is my opinion that the Viet Nam war and subsequent wars of choice, have not been necessary to preserve our nation or its way of life. Instead Oil, defense industries, and banking have pushed us into war for bigger profits. They are connected to our intelligence operatives abroad and sabotage things and create strife to stimulate military intervention. The US has since grown to dominate world business expansion with military forces in 130 nations and is the one and only super power on the planet. Simply said: we’re the biggest imperialist nation on the planet, and we do things our way, (by force if need be). American soldiers die for big business and not for our freedom.
The reason I mention this is because if that defense money had been spent building housing for the lower middle class and the poor people in America, it would be doing something productive. It would be doing well. That money could be the seed money for jobs in solar technologies. The people in foreign lands would still hear about us and if we were doing peaceful charitable things, they would hear this and be attracted to the ways of the US. and our non-military missions. The money might start up a different sort of automobile industry that didn’t follow orders from the oil industry and, instead built a lot more green and clean, and economic cars. The money might be invested in projects within the nation to put unemployed to work, where they, in turn, spend their money on the economy, and it continues up the ladder being spent more than once, to enhance more than one life. The multiplicative effect of a peacetime economy gets more money circulating and creates more demand so production increases, and more people are hired. In turn, their unemployment stops and they spend their wages on the economy, more than when they were unemployed, and this takes the economy doubly in the right direction. When the economy collapsed, money didn’t disappear, it just froze up. It changed hands and then didn’t move. Why isn’t it circulating and creating jobs? Some people made a lot of money and they’re sitting on it. It’s not getting to where it needs to be. To stimulate the economy, the lower end of the financial spectrum needs goods and services purchasing dollars, backed by jobs, to correctly drive a real market. I demonstrate this in Chapter 4.
It’s understandable that the advancement of civilization (with mass production run by computers) has eliminated the need for us to work so hard to provide the products for normal living: food, clothing, house ware, furniture, TVs and cell phones, and music systems.... etc. that everyone wants. But when people are laid off and put on unemployment as a result of this efficiency in industry, the economy suffers. People that don’t have jobs stop driving the market and the rich, who already own every imaginable toy, don’t have a propensity to spend so the market starts dieing. At the low end, those struggling, burden the merchants, the landlords, the utilities, the banks, etc with their failure to make payments. So the small businesses, in turn, get stressed and start closing. Overall the money didn’t disappear; it just got stuck near the top. Let’s take a look at the economy.
The graph on the next page shows the percent of tax filers, (starting with the poor ones), that have the income per year shown or less for 2007. The government puts out a lot of data to help us understand what’s happening. There were 141 million tax returns from 111million households employed in 2007 and represented on that curve, and the income they got is shown on that curve. Unemployed and under employed get help from the government, or live with relatives, but they’re not on the curve. The Bureau of Labor Statistics showed 7 million unemployed and 79 million not in the workforce for 2007 (http://www.bls.gov/cps/cpsaat1.pdf ). What percent of these are unemployed but fell off the radar (didn’t report their continuing unemployment) is unknown to me. Maybe there’s 10-20million of them, but I don’t know. Remember that there are a lot of 2 worker families so a household may be 1 or 2 people working with one or two tax filings (single, separate, joint married), or 1 working and the other one laid off, or?
The curve shows an abrupt rise in income in the highest 5% of the filers, which cannot be reasonably displayed. $7,800,000 average income of the top .1 % of tax returns (all 141,000 of them) would be about 7 pages above the top of the page on the graph. The annual earnings of the “population” is displayed in area segments. You could think of the curve below as all American taxpayers standing
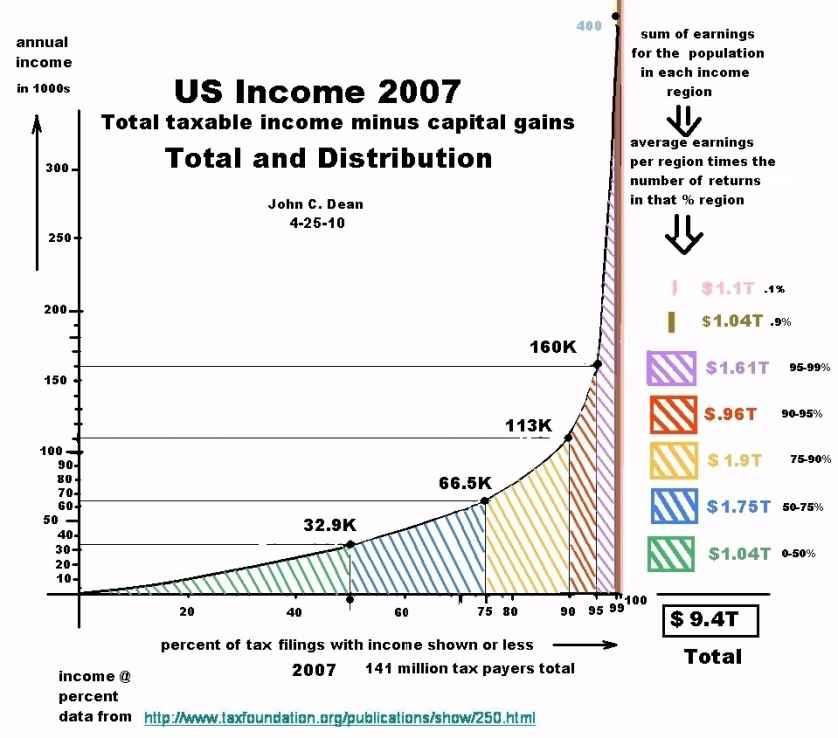
side by side, lined up in increasing income from left to right with a stack of the amount of money they make per year in front of them. The last 141,000 of them , the highest .1% of Americans in income rises to a pile 7 pages high off this page. Adding up there piles is like multiplying the number of people in a given section by the average income they get in that segment. The average income in the first 50% section is $14.8K. So the total income is the number of tax filings (half) 70.5million times $14.8K or $1043 thousand million or $1043 billion or 1.04 thousand billion or $1.04 trillion. The second area in blue between 50 and 75% of the filers represents .25 X 141million filers or 35.25million whose average income is (32.9 + 66.5)/2 = $49.7K , the average of the two ends where income is 32.9K at 50% and 66.5K at 75% and the connection between these points is close to a straight line. So this region produces the product of 35.25 million, times the average wage per tax return, or 35.25M X $49.7K or $1.75trillion. This area calculation where we take the average height is basically turning the area of the wedge or trapezium (shown in the graph) into an equivalent area rectangle, which area is easy to compute (height X width). Determining the area under the curve is the purpose of integral calculus, a branch of higher math familiar to technical nerds like me. But the basic idea is simple. It involves adding up the accumulative area under the curve, which can be done very accurately using a simple manual technique that employs straight line approximations of the curve. The method is described in Appendix 1 section 2. So you don’t need integral calculus to do it. Get out your calculator and check these numbers if you’d like. I tallied up the areas where the 99-99.9 region has $410K- $2 million in income with an average of $820K and produces 820X141X.009= $1.040T. The .1% final area has the average $7.8million. (reference shows 7.4M which I believe is inconsistent with other data provided), and totals $1.1T
http://www.taxfoundation.org/publications/show/250.html
The total of the little area regions is then the total taxable income of the entire working force, and it is $9.4 trillion for 2007. The only thing this excludes is capital gains which are taxed separately. One can play with adding these little regions and compare blocks of workers. The top 1% makes 2.14/9.4 = 22.8% of all the (non capital gain) taxable income. The top 5% make about 40% of this money. Now this is just taxable income excluding capital gains. It doesn’t count money not taxed through tax loopholes or money earned by tax evaders. 47million returns paid no taxes despite positive or negative Adjusted Gross Incomes through application of the Earned Income Tax Credit or other device. It should be clear that about half of Americans are doing ok and the other half is struggling, especially down at the low end, while the high end is off the map with pleasure and financial security. Tax evasion cost $345Billion in tax revenue for 2007 http://www.census.gov/compendia/statab/cats/income_expenditures_poverty_wealth.html .
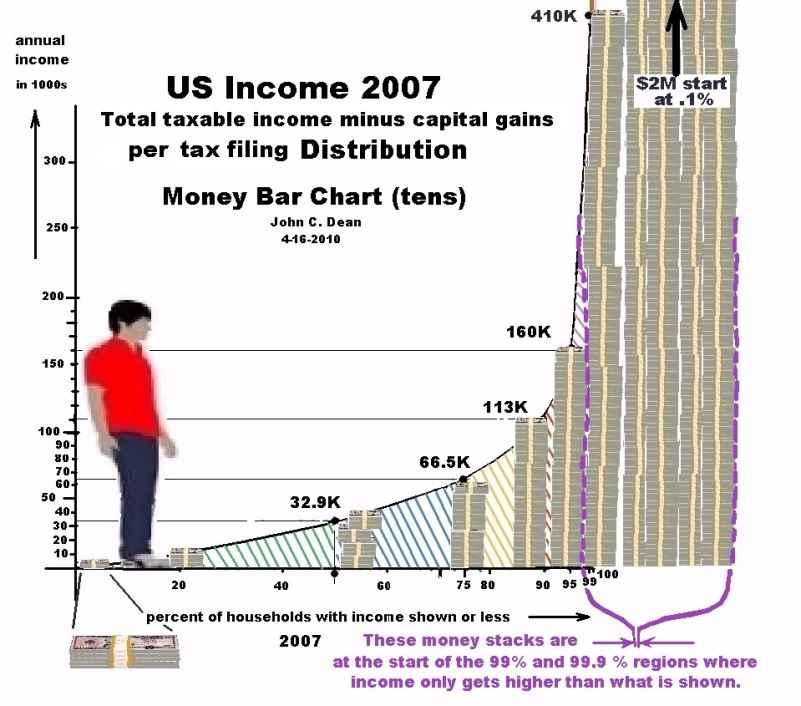
Redoing the plot with stacks of money in relative size to a human being reinforces the evident inequalities in income, visually. The basic unit is a small stack of ten dollar bills, shown enlarged at the beginning of the chart to the left. It is the size of a stack of 10 dollar bills adding up to $5,000. Then there’s a model of a human being to show the relative size of the money stacks to a human. At each point along the curve, the money stack is the total adjusted gross income from all sources except capital gains for that American filing for the year. It’s slightly over the shoe at the 20% point of working filers, and goes to about the waist at the 90% position. At 95% it’s up to the neck and goes up to twice the height at the start of the 99% position ($410K). From 99-99.9 the average income is four times the tax filers’ height. And from 99.9 to 100% the average income is over $7Million dollars per household, but it starts around 2 million which is shown in 4 stacks next to each other at the right end. At this 1% end, the tax rate is not as important to their luxurious living as the size of the stacks left for use after taxes.
A s it is, the rich pay nearly all the income tax the government collects, and in a greater proportion to their taxable income than the lower half of the nation, which might already seem more than fair. This taxation argument is true but very deceiving and has nothing to do with fairness. It is only good when comparing income tax to taxable income (excluding capital gains and other types of tax that most of us have to face that are insignificant to the rich). The other taxes, we all face, swamp out the poor people’s income so there is no money left to live off of, while the rich, who, for instance, are not bothered by social security tax, property tax and sales tax in comparison to the poor, have piles of cash with enormous back-up to their style of living after taxes even if the tax rate is 50%. But we still need to be thorough and refine our numbers a bit more to clarify our picture. First we’ll add capital gains to get the complete income. Wolf shows
top1% next 9% lower 90% Capital gains 20.2%$601 Billion $770 Billion $347 Billion per http://sociology.ucsc.edu/whorulesamerica/power/wealth.html for $1.718T total in capital gains. The federal income taxes are:
Taxes of $1.164T 40.4% 29% with (2.9% ,0-50%)
- $470Billion - $356Billion - $338Billion (-$32B) for the same three groups.
http://www.usgovernmentrevenue.com/yearrev2005_0.html
I have also split up the other income for interest, dividends, business income, and rents from the salaries included in the income curve, and calculated credit card interest payments, and Social Security taxes for our three groups (and more) in appendix 1, items 4, 5, 6, and 10, and with the help of Wolf’s tables that follow.
Investment Assets Top 1 percent Next 9 percent Bottom 90 percent Business equity 62.4% 30.9% 6.7% Financial securities 60.6% 37.9% 1.5% Trusts 38.9% 40.5% 20.6% Stocks and mutual funds 38.3% 42.9% 18.8% Non-home real estate 28.3% 48.6% 23.1% TOTAL investment assets 49.7% 38.1% 12.2%
The resultant table for net income follows:% population top.1% avg 99-99.9% avg 90% 75% 50% 25% 0
Income/wages $174K $174K $98.2K 63.5K 32.9K 15K 0
extra income $9.3M $930K $34.2K 8 K 0 0 0
Fed income tax -$1.73M -$178K -$11.9K -4.9K -2.3K 0 0
Credit card Int. -$2.4K -$2.4K -$2.2K -1.7K -.57K 0 0
SS/Medicare tax -$9.6K -$8.8K -$7.5K -4.9K -2.5K -1.3K 0
Net Income $7.732M $915K $111K $60K $27.5K $13.7K 0
The above table shows what earners get to keep after federal taxes, social security taxes, and credit card interest payments as usable income to eat on, live somewhere, and to pay their state income taxes, sales taxes, and property taxes.
Yippeee!!!!The extra income minus income taxes, social security and Medicare taxes and credit card interest yields much higher income for the top 10% and less net income for the lower 75%. The effective income tax rate including SS and Medicare and income tax would be the sum of these taxes divided by the gross income , or
.1% .9% 90-99% 75% 50% 25%Now it’s still true that the top incomes pay, not only a greater amount of tax per capita, but a greater percentage of their income on tax than the lower income earners. Of course I haven’t included property tax. But what is not shown is that the lower tax payers cannot even afford the taxes they pay as it cuts into the vital necessities of life: food, clothing and shelter. To appreciate the relative problem in the economy of poverty and riches, one needs only to pencil out a reasonable subsistence budget for the range of incomes, respecting the opulent living of the rich and barely housing and feeding the poor. I was raised upper middle class, I live middle class, and I have rich and poor friends, not to say I’m any expert, but I can estimate basic living for these groups reasonably, I believe. A projected subsistence budget for the range of Americans follows.
% population .1% avg .9% 90% 75% 50% 25% 0 Income/wages $174K $174K $98.2K 63.5K 32.9K 15K 0 extra income $9.3M $930K $34.2K 8 K 0 0 0 Fed income tax -$1.73M -$178K -$11.9K -4.9K -2.3K 0 0 Credit card Int. -$2.4K -$2.4K -$2.2K -1.7K -.57K 0 0 SS/Medicare tax -$9.6K -$8.8K -$7.5K -4.9K -2.5K -1.1K 0 Net Income $7.732M $915K $111K $60K $27.5K $14K 0 House value $4M own $2M own $.7M $.2M rents rents 0 Housing$/yr $25K $15K $40K $15K $15K $12K $10K Prop. tax 1.3% $52K $26K
$9.1K $2.6K 0 0 0 Food/yr $30K $20K $13K $8K $5K $5K $4K Utilities $5K $4K $3.5K $2.5K $2K $2K $2K Transportation $40K $30K $8K $5K $4K $3K $2K Intrnet/phone/TV $4K $4K $3K $1.6K $1K $1K $1K Clothing/misc $100K $6K $5K $3K $1K $1K $1K Medical $50K $20K $4K $6K $2K 0 0 Total budget $306K $125K $85.6K $43.7K $30K $24K $20K $ left over
$7.426M $790K $25.4 $16.3K -$2.5K -$10K -$20K Taxes/income 18.9% 19.3% 21.5% 17.3% 14.6% 7.7%
Some of the 50% people actually own homes, since rent payments nowadays are comparable to house payments, so it pencils out. But I’ve shown them renting. If they worked extra to save up a down payment, the rent money should cover a house payment, insurance, and taxes. $1250/mo. rent could be a 2-3 bdr condo or house, or it could be, with 10% down on a $200K house at 5% for 30yrears:
Mortgage (P+I) $966.27
Tax (T) $216.66
Insurance (I) $66.66
Total Monthly Payment (PITI) $1249.61 (or $15K/yr)
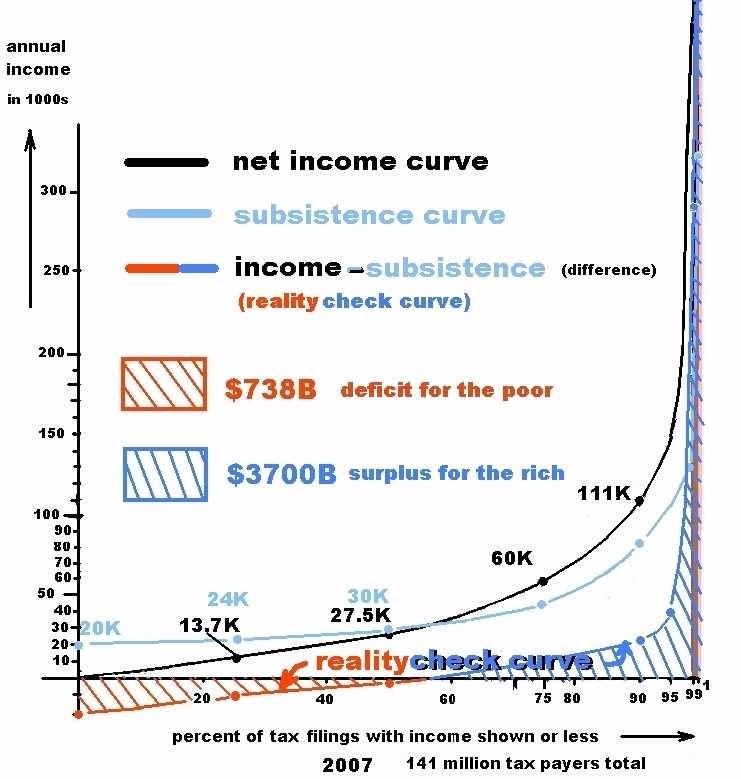
might give the 50% guy such a loan, but old man Potter and his bank would rather keep these people renting forever. (movie: “ It’s a Wonderful Life” 1947, Frank Capra), and we all live in “Pottersville” these days, so they’re renting, in my table. What is clearly evident from the table is that the lower half of the tax filers cannot subsist without government help. That may translate to the lower 60-70% of the population. Another way to understand this is to plot a subsistence curve and a net income curve and look at the difference curve. It is a reality check and shows the deficit for the poor and the surplus for the rich.
So what has caused this collapse at the low end? It’s simple. In the 1950s, 60s, and 70s, employment was up with house buying wages, and the economy was thriving. The people did not need anywhere near the level of support that the government provides these days in welfare and Social Security and Medicare were not as big a drain. But Capitalism promotes movement of the money to the top with a loss of jobs and a lower economy for the poor. With any inflation the low end buys less goods and services when the economy goes down for them so the rich make things cheaper, export labor, and work for reductions in the taxation of the rich, which makes for less government funding available, and instead the debt of the government grows. Unions are weaker, automated high speed production is more prevalent, and the poor end lose more jobs. So people take a cut in pay to keep their job. Jobs are sent overseas so that goods may be purchased more cheaply while the owners make more money. This would be good for the nation if it didn’t cost jobs. But it does. Wages would cover the cost of living and finance a home for a high school kid working in America in the 50s and 60s. But inflation (which is essentially runaway greed by companies, using supply and demand as the carrot) helps those who raise prices first, and/or have a closed market without much competition. Others need to respond when their costs go up and so it ripples through the market, giving the fixed wage worker less buying power. This has happened fairly slowly over 50 years, where minimum wages did not keep pace with inflation; it first caused Mom to go out and get a job. And the people worked more than one job or extra hours on their job to maintain their style of living. But housing costs went up, and rental costs. Medicine increased 4 times as fast as the consumer price index between 1980 and 2007. Legal issues grabbed attention as legalese wafted its pitch filled smoke into the economy and fewer hand shakes made deals. People started locking their doors at night, taking the keys out of the ignition while stopping somewhere. Corporations figured how to beat out the family farmer at the market. New car prices rose. Everyone wanted to make more profit. So the economy got tougher for the low end consumers and corporations edged out the small businesses in key areas.
Oil people are at the top, naming their own price. Their vast fields do not report the need to raise prices. It’s their greed and the supply they control. I did notice that they became kind when the markets collapsed and gas suddenly went down from 4 to below $3 a gallon in the fall of 2008. I don’t think that this was due to a comparable drop in gas use in America. It may be the oil companies manipulating the market to get the most out of it. They can raise or lower the price of gas and throttle the market up or down a bit to preserve a healthy enough economy to rake in the petrol dollars, while sitting on battery technology. Because they can lower the price of gas at the pump by more than a buck and still make profit, I suspect them for gauging the public and monopolistic practices. They control the auto companies in America, and gas hogs have been on the agenda way too long. And now big business is ravaging the Amazon basin for its trees and have been busting governments around the world with bad financial deals threatening bankruptcy to get the favors of their natural resources. The World Trade Organization forced countries to invest in American derivatives or be heavily fined. If their practices are not illegal because of their control of governments and laws, then they’re immoral and should be illegal.
And we could create guidelines for a “new” free market system that is not run by immoral tyrants, but still offers a wonderful challenge to any entrepreneur.
item 1965 2010 Ratio of cost 2010/1965
bacon $.89/lb $4.50 5
eggs $.53/doz $1.80/doz 3.4
gas $.31/gal $3.10/gal 10
milk $.95/gal $ 2.85 3
movies $1 $10 10
home $14,000. $180,000 12.9
Min wage $1.25 $7.25 5.8
Health Care 7.2%GDP65 16%GDP2010 43
Consumer
Price Ref $1 $6.91 6.91
index
I put this together from various sources and with some calculations to get to the final data shown. But the information to do this is from:
http://www.thepeoplehistory.com/60sfood.html for prices in the 60s
http://familyimpactseminars.org/s_wifis18c01.pdf p/o health care change w/GDP
http://www.bls.gov/data/inflation_calculator.htm consumer index
www.bea.gov/national/xls/gdplev.xls - GDP changes 719B1965- 14T2010
http://en.wikipedia.org/wiki/Income_tax_in_the_United_States#Types_of_income min wage
I believe the important information from the above table is that the low end took a pay cut in buying power down to 5.8/6.91 = 84% of 1965 wage while homes rose by 12.9/6.91 = 1.87 or 87% in the current era; medical care rose by 43/6.91 = 6.2or 520%, gas rose by 10/6.91 = 1.45 or 45% and the low end hung in there with milk and eggs and bacon. So as long as he lives outdoors, has good health, and rides a bicycle he’s ok; as long as he can hold down that minimum wage job and get to work on time. Although I would call capitalism like this, as it took place, a failure for not preserving the life style of the bulk of Americans over time, and I have some ideas for recapturing those beautiful days (only with clean air and green policies in energy). The following shows some of my ideas.
people and accelerated appraisals based upon selling comps (comparisons), that don’t slow down inflation and changed overnight in 2006-2007. The cure might be to have average inflation of 2-3% per year financed with the 10-20% down, as controlled by banks, who would be limited by regulations in their practices to this safe approach. If the buyer wants the more sharply inflated home, then he can put more money down on it. Otherwise lenders will refuse the 80-90% loans on fast rising properties. Comps would then be documented for maybe 5 years to show the slow growth rate, and buyers and sellers would be coached about this. This should tame the housing market. I’d regulate out the unrealistic practices, like interest only loans with balloon payments (except for commercial purposes, where buyers understand well and may want this type of service). I’d require an offering of fixed interest rate 30 yr loans on housing for all home buyers. The credit doesn’t really matter as much as the money down. With enough money down no one is going to be foreclosed, especially on a smaller loan with lower payments. I’d regulate interest rates not to gouge the poor at all. Maybe Co-ops by the poor could help the poor as well.
Co-Op Home Financing by/for the PoorImagine a co-op type company (owned by its members) that takes in $300/month (or thereabouts) from each of a group of working, but low or bad credit prospects that join the co-op This is set up like a house down payment savings account. They need stable jobs at a decent level of income that can cover a house payment and taxes and insurance (if they had no rent to pay). If they get behind two months on the $300/mo, then at the point where the third month is due, they’re out, and half their total previous input is returned to them. If they want to put more in, then they save quicker, and gain grace on the due date for the next payment. The members with a nominal 20% of the average middle class house invested in the co-op may
Describe what you're looking for in as much detail as you'd like.
Our AI reads your request and finds the best matching books for you.
Popular searches:
Join 2.9 million readers and get unlimited free ebooks