What is a 1-2-3 Pattern?
Good question. A 1-2-3 is simply best explained by looking at some charts. It’s really simple when I throw up a few charts and take it from there. Here are some recent stock charts.
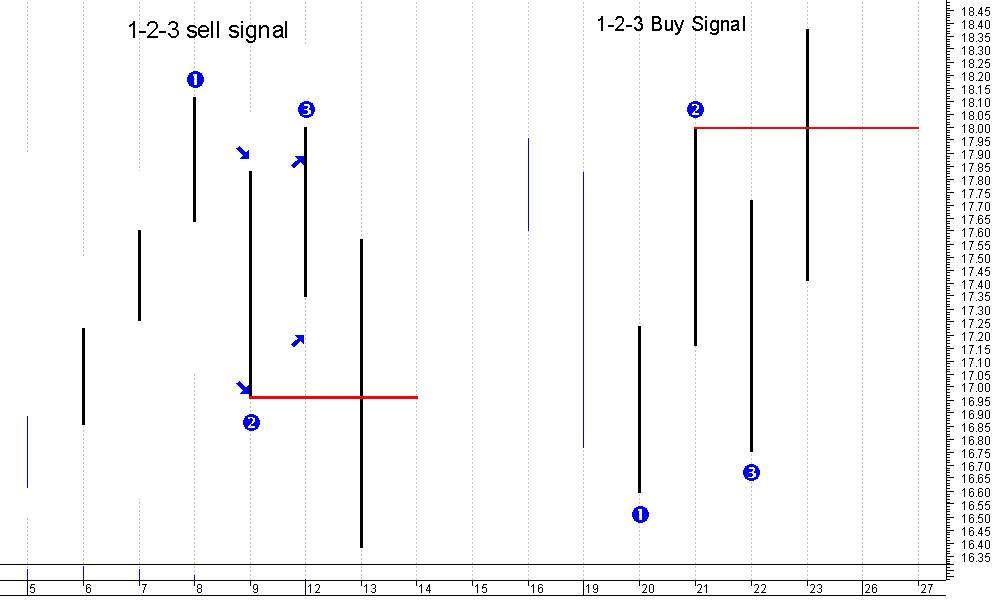
 Above is simply a daily bar chart of the stock of the big blue chip US stock General Electric. Stock symbol GE.
 Clearly marked is the 1-2-3 pattern that evolved in February. Simply put it is a 1-2-3 buy pattern.
It’s a bottom, a correction, a retest that does not go beyond the original bottom, and then a rebound beyond the correction. Phew…. That was a mouthful. But it is VERY simple when you look at the chart.
Point 1: This is the bottom.Point 2: This is the correction
Point 3: This is the retest the DOES NOT GO BEYOND point 1. If it does then all bets are off. The pattern does not exist. Scratch it off and move on.
Once you have a valid 1-2-3 pattern then place your buy order in at the *breakout of the number two point on the pattern.
Honestly, it is a VERY SIMPLE pattern that always give lots of opportunity and a great risk/reward ratio. Once you grasp the fundamental basics and practice you will see them all over the place.
Describe what you're looking for in as much detail as you'd like.
Our AI reads your request and finds the best matching books for you.
Popular searches:
Join 2.9 million readers and get unlimited free ebooks